post in May suggested that UK employment would embark on a sustained decline in Q2. This was based on the stock of vacancies having fallen 17% from its 12-month peak – declines of more than 15% historically were always associated with sustained employment falls. 

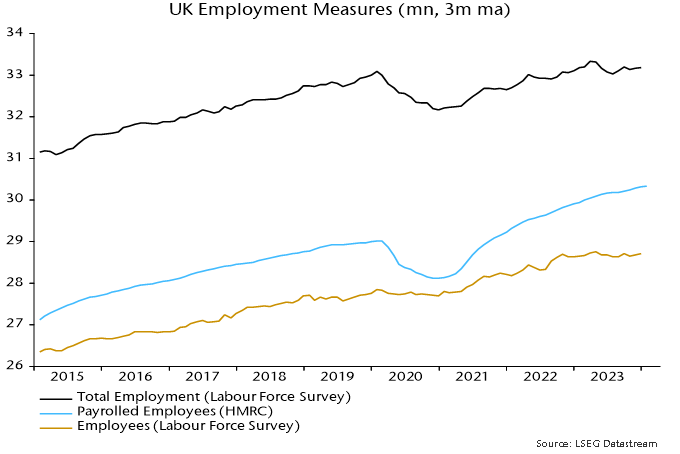
Labour Force Survey employment fell by 207,000 in the three months centred on June from three months earlier, while the workforce jobs measure (of positions rather than people) was down by 153,000 between March and June. 

Vacancies have continued to collapse, with the August stock down by 23% from its 12-month high and 29% below the April 2022 peak – see chart 1. 

Chart 1

Chart 1 showing UK Employment & Deviation of Vacancies from 12m High

The three-month average unemployment rate, meanwhile, rose further to 4.3% in July versus an August 2022 low of 3.5%, confirming a Sahm rule recession signal (an increase of more than 0.5 pp from the 12-month minimum) – chart 2. 

Chart 2

Chart 2 showing UK Unemployment Rate (3m ma)

A July post noted that the Sahm rule has an imperfect record as an indicator of UK recessions but signals were always associated with a slowdown in average earnings growth. 

Annual growth of regular earnings ticked down from 8.0% in June to 7.8% in July, while median pay growth in the more timely PAYE dataset eased to 6.7% in August – chart 3. (Caveat: the PAYE numbers are subject to significant revision.) 

Chart 3

Chart 3 showing UK Average Weekly Earnings (% yoy)

In light of the above, claims that the latest labour market news is “mixed” and shouldn’t deflect the MPC from another rate hike next week are odd and appear to reflect confirmation bias. 

Money / credit contraction argues that current policy is much too restrictive. The ongoing collapse in vacancies and faster-than-expected deterioration in more lagging labour market indicators are consistent with this interpretation. 

MPC member Catherine Mann argues for erring on the side of overtightening because rates can be cut swiftly if a mistake becomes apparent. If only the economic damage from bad policy-making were so easily reversed.

A bottoming out of the global stockbuilding cycle could be associated with a near-term recovery in manufacturing survey indicators. Money trends suggest that any revival will be modest / temporary and offset by wider economic weakness. 

Economic news has been unusually mixed since end-2021, with GDP weakness contrasting with labour market strength and manufacturing deterioration offset by services resilience. Confusing signals have contributed to market hopes of a “soft landing”. 

Sectoral and regional divergences may persist in H2 2023. The expectation here is that manufacturing survey weakness will abate but labour market data will worsen significantly. Money trends continue to cast strong doubt on soft landing hopes. Europe is likely to underperform the US. 

The US ISM manufacturing new orders index – a widely watched indicator of industrial momentum – hit a low of 42.5 in January and retested this level in May before recovering to 45.6 in June. 

Reasons for expecting a further rise include: 

  • The index has been in the 40s since September 2022 and the mean duration of sub-50 periods historically was eight months (ignoring episodes of three months or less). 
  • The global stockbuilding cycle remains on track to bottom out during H2 2023 and lows historically were usually preceded by a recovery in US / global manufacturing new orders. 
  • Recent price falls for raw materials and other production inputs may further incentivise firms to step up purchasing to maintain or replenish inventories.

Korean manufacturing is a bellwether of US / global trends and the latest Federation of Korean Industries survey reported a marked improvement in optimism, consistent with ISM new orders moving back above 50 – see chart 1. 

Chart 1

Chart 1 showing US ISM Manufacturing New Orders & Korea FKI Manufacturing Business Prospects

Sustained recoveries in ISM new orders from the mid 40s into expansionary territory historically occurred against a backdrop of positive and / or rising six-month real narrow money* momentum. Current trends are unfavourable, with momentum still significantly negative and moving sideways – chart 2. 

Chart 2

Chart 2 showing US ISM Manufacturing New Orders & Real Narrow Money (% 6m)

Examples of recoveries to above 50 without a supportive monetary backdrop include 1970 and 1989-90. In both cases the rise was modest (peaking below 55), short-lived and followed by a decline to a lower low. The recovery in 1970 occurred within an NBER-defined recession and in 1989-90 just before one. 

An ISM rebound might not be mirrored by much if any revival in European manufacturing surveys. Money trends are even weaker than in the US, while the stockbuilding adjustment started later in the Eurozone and probably has further to run – charts 3 and 4. 

Chart 3

Chart 3 showing Real Narrow Money (% 6m)

Chart 4

Chart 4 showing Stockbuilding as % of GDP

*Narrow money definition used here = M1A = currency + demand deposits.

The Sahm rule states that the (US) economy is likely to be in recession if a three-month moving average of the unemployment rate is 0.5 pp or more above its minimum in the prior 12 months. 

The rule identified all 12 US recessions since 1950 but gave two false positive signals based on current (i.e., revised) unemployment rate data (1959 and 2003) and four based on real-time data (additionally 1967 and 1976). 

The signal occurred after the start date of the recession in all 12 cases, with a maximum delay of seven months* (in the 1973-75 recession). 

The Sahm condition hasn’t yet been met in the US – the unemployment rate three-month average was 3.6% in June versus a 12-month minimum of 3.5%. 

The rule has, however, triggered a warning in the UK, where the jobless rate averaged 4.0% over March-May, up from 3.5% over June-August 2022. 

UK Sahm rule warnings occurred on nine previous occasions since 1965, six of which were associated with GDP contractions. 

The Sahm signal is another indication that the UK economy is already in recession – see previous post – but a stronger message is that earnings growth is about to slow. 

Annual growth of average earnings fell after the Sahm signal in eight of the nine cases, the exception being the 2020 covid recession, when earnings numbers were heavily distorted by composition effects – see chart 1. 

Chart 1

Chart 1 showing UK Average Earnings (3m ma, % yoy) & Rise in Unemployment Rate (3m ma) from 12m Minimum

Previous generations of monetary policy-makers understood the dangers of basing decisions on the latest inflation and / or earnings data, which reflect monetary conditions 18 months or more ago. 

The current reactive approach, apparently endorsed by the economics consensus, may partly reflect mythology about a 1970s “wage / price spiral”. Rather than causing each other, high wage growth and inflation were dual symptoms of sustained double-digit broad money expansion. 

The monetarist case is summarised by chart 2, showing that earnings growth is almost coincident with core inflation whereas broad money expansion displays a long lead. (The correlations with core inflation are maximised with lags of four months for earnings growth and 24 months for money growth.) 

Chart 2 

Chart 2 showing UK Core Consumer / Retail Prices, Average Earnings & Broad Money (% yoy)

Recent monetary weakness argues that core inflation and wage growth will be much lower by late 2024; the Sahm rule signals that the decline is about to start.

*Eight months taking into account a one-month reporting lag.

Commentators have expressed scepticism about a large monthly fall in the “experimental” PAYE employees measure in April (136,000 or 0.45%, equivalent to a 700,000 drop in US non-farm payrolls).

It is true that initial estimates are often revised significantly but the largest upward adjustment to the month-on-month change historically was 121,000, relating to a pandemic-distorted month (March 2021*). The mean absolute revision over the last year was 34,000.

The recent trend, moreover, has been for downgrades – the initially estimated month-on-month change has been revised lower for five of the last six months.

The reported fall is consistent with the latest KPMG / REC Report on Jobs: the permanent placements index in April was the lowest since the start of 2021 and the PAYE measure last declined in February 2021 (based on current vintage data).

The regional breakdown of the PAYE measure shows falls in all 12 regions, with the largest (1.0%) in London – also consistent with the Report on Jobs, which reported that permanent placements weakness was led by London.

As the chart shows, the PAYE employees measure correlates with the quarterly employee jobs series, which has “official” status but is less timely – an end-Q1 number will be released next month. (This series, like US payrolls, counts positions rather than people.)

Chart 1 showing UK Employee Jobs, Payrolled Employees & Vacancies *Single Month, Own Seasonal Adjustment

The Labour Force Survey employment measure rose by 182,000 in the three months to March from the previous three months but self-employment and part-time employees accounted for the increase – the number of full-time employees fell.

post last week suggested that employment would begin a sustained decline in Q2, based on recent weakness in vacancies. The official vacancies series – a three-month moving average – fell again in April. The single-month number calculated here is now down 20% from peak (April 2022), with the month-on-month decline accelerating last month. (The FT incorrectly reported that vacancies stabilised in April.)

Another labour market report is due before the MPC’s next meeting on 22 June. Confirmation that employment is on a falling trend would transform the policy debate.

*The revision to the month-on-month change reflected a downgrade to the level of employment in February, not an upgrade to March.

UK vacancies – like US job openings – are signalling an employment recession. 

A previous post noted that a fall in US job openings of more than 15% from a rolling 12-month high was always (since the 1950s) associated with a multi-month fall in payrolls. The 15% threshold was crossed in February data released last month, with the shortfall increasing to 18% in March.

It turns out that the 15% rule also works in the UK, correctly signalling all eight employment recessions since the 1960s with no false warnings. Recent developments mirror the US: the decline in vacancies from peak crossed 15% in January, rising to 17% in March.

The official vacancies series, based on a survey of employers, starts in 2001. Earlier numbers are available (back to 1960) for vacancies notified to Jobcentres. When the latter series was replaced in 2001, Jobcentre vacancies accounted for about 60% of the total. The analysis here combines the two series, effectively assuming that Jobcentre vacancies were a constant proportion of the total before 2001.

Employment recessions were defined as multi-quarter declines in an average of two series – total employment (from the Labour Force Survey of households) and workforce jobs (based mainly on a survey of employers). The latter series – like US non-farm payrolls – counts positions rather than workers and is about 10% larger, reflecting multiple job holding. 

As in the US, the 15% threshold was usually reached around the time that employment started to decline, although this may not have been immediately apparent because of reporting lags and revisions.

A Q1 reading of the total employment series is not yet available but LFS data through February and PAYE employee numbers suggest another rise. Based on the vacancies signal, a sustained decline may begin in Q2.

Chart 1 showing UK Employment & Deviation of Vacancies from 12m High

US February job openings were 17% below their March 2022 peak. Historically, a decline of this magnitude in vacancies – job openings or, for earlier years, help-wanted advertising – was always associated with a payrolls recession. 

Job openings numbers are available back to 2000. Regis Barnichon, now at the San Francisco Fed, constructed a proxy series – composite help-wanted advertising – for earlier decades. The Barnichon series adjusts historical data on newspaper advertising for a rising share of online job postings, modelled by an S-curve. 

The official and Barnichon series (which is no longer updated) can be spliced together to create a continuous vacancies series extending back to the early 1950s, a period encompassing 11 recessions involving sustained payrolls declines – see chart 1. 

Chart 1

Chart 1 showing US Non-Farm Payrolls & Job Openings / Help-Wanted

Every payrolls decline was preceded by a fall in vacancies but several vacancies declines were followed by slowdowns in payrolls rather than outright weakness (e.g. 1966). 

A sufficient condition for a payrolls recession was a fall of more than 15% in vacancies from their peak level in the latest 12 months – chart 2. This condition was met in February job openings numbers released last week. 

Chart 2

Chart 2 showing US Non-Farm Payrolls & Deviation of Job Openings / Help-Wanted from 12m High

Historically, the 15% threshold was reached around the time that payrolls started to decline. In six of the 11 cases, payrolls had already peaked, although this was not always known at the time. 

As an example, current data show a 1974 payrolls decline beginning in August, one month before the vacancies fall reached the 15% trigger. In real-time data, however, a payrolls peak was delayed until October.

The unusually high level of job openings may be affecting the seasonality of US labour market data. An accurate read on the non-seasonal employment trend may not be possible until the spring. 

The normal seasonality of US private payrolls is captured by the difference between BLS unadjusted and seasonally adjusted stock series, shown in chart 1. The seasonal effect is roughly neutral in September, rises to a peak in November, turns substantially negative in January and recovers back to neutral in May. 

Chart 1

Chart 1 showing Seasonal Variation in US Private Payrolls (000s) Unadjusted minus Seasonally Adjusted Levels

The normal pattern of employers shedding jobs on a large scale in January but rehiring into the spring / summer could change when the labour market is unusually tight, as currently. Firms may prefer to hold onto workers as seasonal activity slackens, anticipating difficulties refilling jobs later in the year. Laid-off employees may find alternative work more rapidly than in a normal year. 

A change of behaviour may explain the blockbuster January payrolls rise, i.e. the seasonal adjustment may have significantly overestimated the seasonal drop in employment this year. 

An alternative approach to assessing the underlying jobs trend is to compare months when the seasonal effect is neutral. As noted, September and May are neutral months, while seasonal deviations are significant over October-April. The average change in unadjusted payrolls over September-May should be an undistorted measure of employment growth. 

If the suggestion of a seasonal distortion is correct, headline payrolls growth numbers for February-May could understate the underlying trend, compensating for January’s (possible) overstatement. 

Suppose, for illustration, that monthly growth in unadjusted payrolls turns out to average 150,000 between the two seasonally neutral months of September 2022 and May 2023. (This equates to an annualised growth rate of 1.4%, in line with the reported expansion of the labour force in the year to January, i.e. the assumption is consistent with a stable unemployment rate.) 

Such growth would imply a payrolls level of 132,686,000 in May 2023, with no significant seasonal element. This compares with a currently reported seasonally adjusted level of 132,684,000 for January. The headline payrolls measure, on these assumptions, would show negligible growth over February-May.

The consensus is gloomy about UK economic prospects but is it gloomy enough? 

The current debate has echoes of mid-2008. Q2 2008 was the first quarter of the most severe post-war recession. The consensus that summer was that the economy would eke out growth with a limited rise in unemployment and no need for significant policy easing. 

A recession is widely acknowledged / expected now but the majority view is that it will be shallow and short-lived, partly reflecting recent energy price relief. Labour market damage is projected to be modest and there is general approval of recent MPC policy tightening. 

Monetary trends warned of worse-than-expected outcomes in 2008 and are giving an equally negative message now. 

The six-month rate of contraction of real narrow money (i.e. non-financial M1 deflated by consumer prices) was unchanged at 5.9% (not annualised) in December, close to a 6.1% peak reached in October 2008 – see chart 1. 

Chart 1

Chart 1 showing UK GDP & Real Narrow Money* (% 6m) *Non-Financial M1 from 1977, M1 before

As in 2008, the real money squeeze reflects both high inflation and nominal money weakness. Sectoral nominal money trends are uncannily similar to mid-2008. Corporate M1 and M4 are contracting rapidly, consistent with a sharp fall in profits and suggesting cuts in employment and investment – chart 2. 

Chart 2

Chart 2 showing UK Household & PNFC* Money (% 3m annualised) *PNFCs = Private Non-Financial Corporations

Household M4 is still growing modestly but there has been a large-scale switch out of sight into time deposits in response to rising rates – a classic signal of a shift in consumer behaviour from spending to saving. 

A continued rise in employee numbers in recent months has fed a narrative of labour market “resilience” that is expected to persist. Data and complacency were similar in mid-2008. The quarterly employee jobs series rose into Q3 2008 but the stock of vacancies in June was already down by 9% from its peak, warning of trouble ahead – chart 3. The level of vacancies is higher now but the fall from the peak has been larger, at 14%. 

Chart 3

Chart 3 showing UK Employee Jobs (mn) & Vacancies* (000s) *Single Month, Own Seasonal Adjustment

US non-farm payrolls have risen by an average of 337,000 per month in the eight months since the Fed started hiking rates in March. The household survey measure of employment was essentially flat over this period.

The gap between the eight-month changes in the two series is at a record high, excluding April-May 2020 when data were distorted by the pandemic*. (This comparison, however, uses revised data for the two series.) 

The payrolls numbers have informed the FOMC’s judgement that “job gains have been robust”, in turn influencing the magnitude of the rise in rates this year. 

The payrolls survey covers about 670,000 worksites, while the household survey has a sample size of about 60,000. Sampling error, therefore, is larger for the household survey – the standard error of the monthly change in the household survey employment measure is more than four times that of the monthly payrolls change, according to the BLS. 

The payrolls survey, therefore, is conventionally regarded as the more reliable gauge of short-term employment movements. 

A focus on monthly sampling error, however, ignores sometimes large revisions to the payrolls data due to annual benchmarking against unemployment insurance tax records. There is no comparable annual revision to historical household survey data. 

The annual payrolls revisions have averaged close to zero over the long run but there have been clusters of negative revisions around recessions – see chart 1. 

Chart 1

Chart 1 showing Annual Benchmark Revision to US Non-Farm Payrolls (March, %)

Benchmark revisions occur with a long lag. The BLS in August issued a preliminary estimate of a 462,000 upward revision to the March 2022 level of payrolls. This will be incorporated in monthly historical data up to March 2022 in February 2023. 

Benchmark revisions to recent monthly data, therefore, will occur in February 2024 under current BLS practice. 

Research by the Philadelphia Fed suggests that these revisions will be negative and potentially very large. The researchers have attempted to replicate the annual BLS benchmarking procedure using quarterly UI records. They estimate that the currently-reported level of payrolls in June 2022 of 151.9 million will be revised down by 843,000, or 0.55% – chart 2. 

Chart 2

Chart 2 showing Annual Benchmark Revision to US Non-Farm Payrolls (March, %) *Sum of Benchmarked State Data (Source: Philadelphia Fed)

This would imply that payrolls grew by only 3,500 per month on average between March and June compared with the currently-reported 349,000. 

Chart 3 compares three-month growth rates of the official payrolls series, the household survey employment measure and the Philadelphia Fed benchmarked payrolls series. The May / June readings of the latter two are equal.

Chart 3

Chart 3 showing US Employment Measures (% 3m annualised) *Adjusted for Annual Population Control Changes

The official payrolls measure has risen by an average of 329,000 per month in the five months since June. Monthly gains in the household survey employment measure averaged 72,000 over this period. 

A benchmarked September payrolls estimate from the Philadelphia Fed will be released in March but timely data on withheld income and employment taxes – including UI taxes – suggest that the official payrolls series has continued to overstate gains. The daily tax data are noisy but year-on-year growth of a moving average has fallen sharply since June, widening an undershoot of the normal relationship with aggregate private sector earnings growth from the payrolls survey – chart 4. 

Chart 4

Chart 4 showing US Aggregate Payroll Earnings of Private Sector Employees (% yoy) & Daily Withheld Income & Employment Taxes (10w ma, % yoy)

*The payrolls series measures jobs while the household survey measures people. The wide gap partly reflects a rise in the number of people with multiple jobs. A BLS research series is available that attempts to convert household survey employment data to a payrolls concept, including by adding multiple jobs. This series rose by an average of 103,000 per month in the eight months to November. The difference with payrolls growth is also a record excluding 2020 data.

UK payrolled employment rose solidly again in November, while pay growth numbers for October surprised to the upside. It has been suggested that this news reinforces the case for a Bank rate hike of at least 50 bp this week. 

Employment is a lagging economic indicator. There is ample coincident evidence that a recession is under way. Annual broad money growth – as measured by non-financial M4 – is down to 3.4%, a level suggesting a medium-term inflation undershoot. The view here is that any rate rise this week will be a mistake. 

The monthly payrolled employment measure has a short history but it correlates closely with the quarterly (and less timely) Workforce employee jobs series. In the 2008-09 recession, the latter measure peaked two quarters after GDP.

Labour market indicators that lead employment / unemployment include the stock of vacancies and average hours worked. These indicators are usually roughly coincident with GDP.

The headline vacancies series is a three-month moving average but non-seasonally-adjusted single-month numbers are available and can be adjusted using a standard procedure. The resulting series peaked in April, one month before GDP, and fell again in November – see chart 1. The recent pace of decline is comparable with the 2008-09 recession.

Chart 1

Chart 1 showing UK Monthly GDP Index & Vacancies* *Single Month, Own Seasonal Adjustment

The weak November vacancies number suggests that GDP contracted significantly last month after October’s catch-up from reduced September activity due to the Queen’s funeral.

Average weekly hours tell a similar story. The series, which is available only as a three-month moving average, peaked in March and fell again in October, reaching its lowest level – excluding the pandemic recession – since 2012.

Should the MPC react to strong pay numbers? The monetarist view is that pay pressures are an effect rather than a cause of high inflation and will moderate as the dramatic slowdown in money growth since 2021 feeds through to slower price rises.

The latest upside surprise, in any case, reflects a belated catch-up in public sector pay; six-month growth of private sector regular pay is high but moving sideways – chart 2. A public sector pay pick-up may be bad news for real government spending and / or the public finances but will have little effect on the pricing behaviour of private sector suppliers of goods and services – especially against a backdrop of deepening recession and a loosening labour market.

Chart 2

Chart 2 showing UK Average Weekly Regular Earnings (% 6m annualised)