A shift long overdue
Small-cap stocks often go unnoticed by mainstream investors, overshadowed by large-cap equities’ high visibility and liquidity. However, historical evidence shows that small caps outperform large caps over time, particularly following periods of underperformance and economic recovery. As market dynamics evolve going into 2025, we are on the cusp of such a shift, where small caps are poised to take centre stage. In this article, we explore why small caps offer a unique investment opportunity driven by valuation, earnings growth, economic trends and favourable global developments.
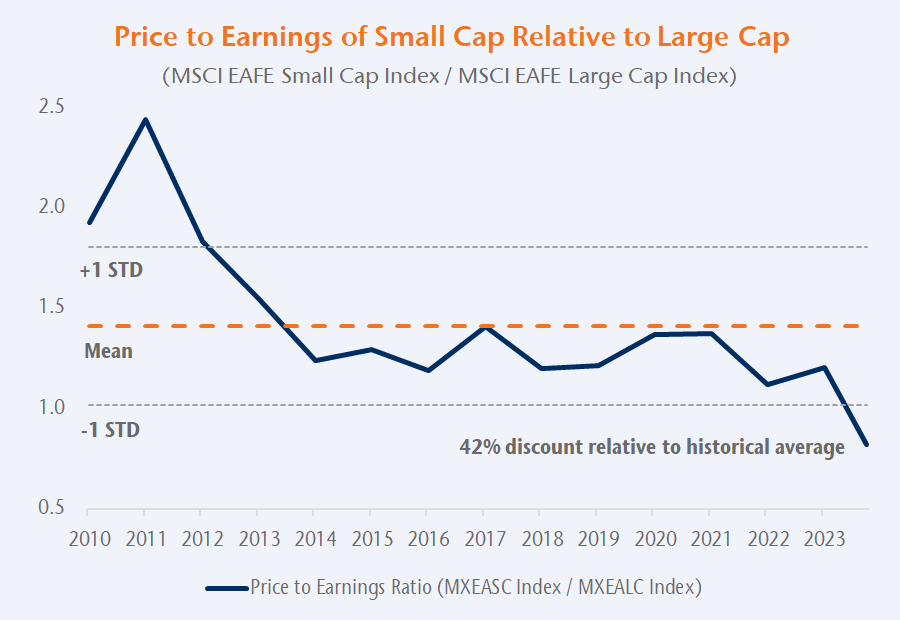
1. The biggest opportunity in a decade: It is all about valuation
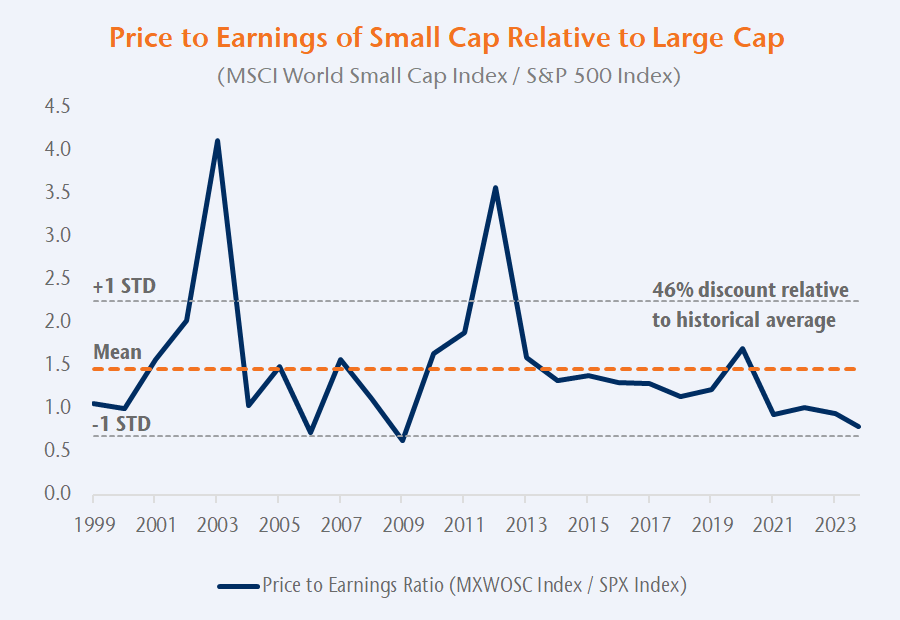
The valuation spread between small and large caps is near historic highs, presenting a rare buying opportunity. Over the past decade, small caps underperformed largely due to multiple compression and market focus on a handful of mega-cap tech stocks. Small caps are not lagging because of weak fundamentals, but due to shrinking valuations.
Valuation reversion: Markets are cyclical, and periods of large-cap dominance are often followed by small-cap rallies. Historically, small caps have delivered superior returns during periods of economic expansion and market recovery. Small-cap stocks are trading at discounts to historical averages, offering investors a margin of safety that large caps currently lack.
Source: Bloomberg
Source: Bloomberg
2. Superior earnings growth and the case for quality
Earnings growth is a critical driver of stock performance, and small caps are well-positioned in this regard. Analysts estimate small caps will post higher EPS growth than large caps through 2025 and 2026. Considering the current macroeconomic environment, focusing on quality is likely the most effective way to gain exposure to small-cap companies. The valuation reset in 2022 and the dominance of large-cap stocks in 2023 have resulted in many high-quality small caps being available at more attractive prices. Additionally, adopting a global perspective is beneficial in this context, as it reduces reliance on the performance of specific economies.
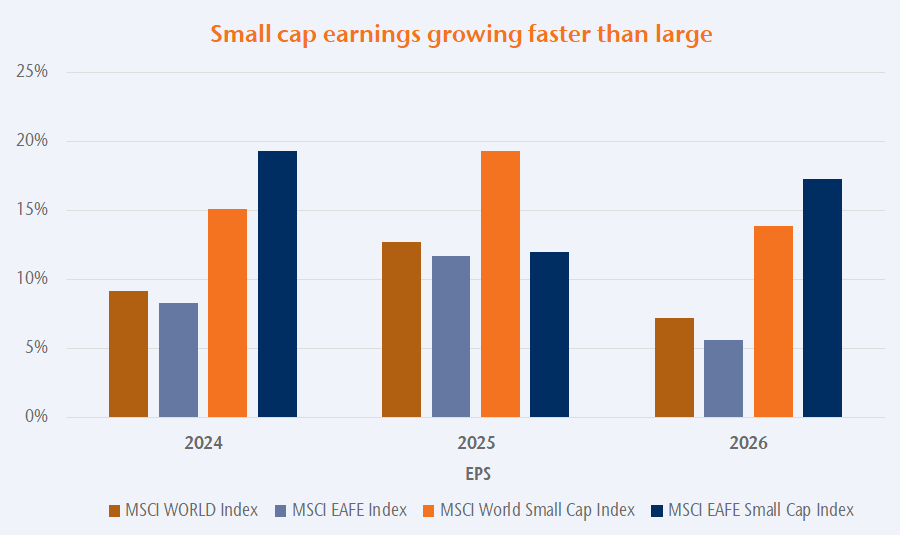
Source: Bloomberg
3. Macro trends favouring small caps: The winds of change
Small caps are particularly sensitive to changes in interest rates and economic policies. As inflation moderates and central banks signal a shift toward more accommodative monetary policies, small caps stand to benefit. Many small-cap companies rely on external financing for growth, making them more responsive to falling interest rates than large-cap peers. The current outlook suggests that even modest rate cuts could trigger significant outperformance in small caps.
Broadening market performance: The 2024 equity market has seen a shift in breadth, with smaller companies starting to outperform mega-cap technology stocks. A narrowing of the gap between outperforming large-cap tech and the broader market is historically a precursor to small-cap rallies. In the third quarter, both MSCI World Small Cap and MSCI EAFE Small Cap outperformed large caps and the NASDAQ index.
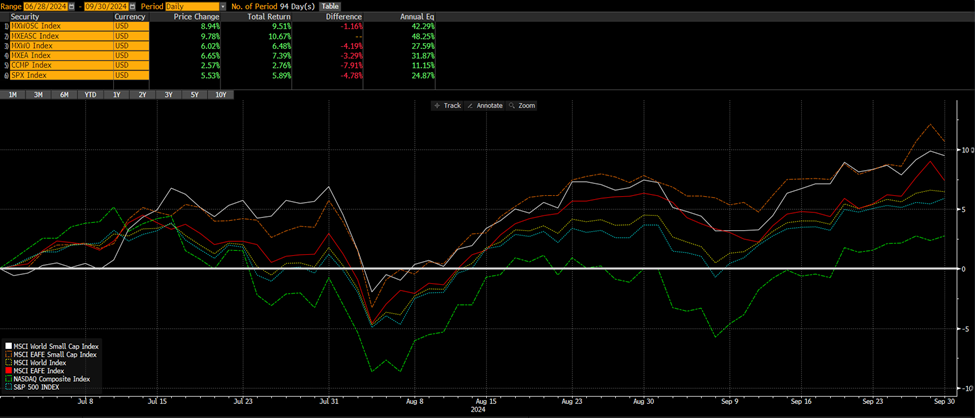
Source: Bloomberg
4. EAFE small caps: Untapped potential and diversification
Beyond US borders, global small-cap equities present an additional layer of opportunity for investors seeking diversification. These stocks offer superior risk-adjusted returns, with lower correlations to US large-cap equities. International small caps have consistently outperformed their large-cap counterparts in various regions, including Europe and Japan. Despite this track record, they remain underrepresented in most portfolios, offering an underexplored opportunity.
Risk mitigation through diversification: Small-cap indices globally encompass over 6,000 companies, allowing for exposure to diverse industries and geographies. This diversity can help offset regional risks and stabilize returns.
5. Volatility: Embracing market fluctuations for long-term gains
While small caps are inherently more volatile than large caps, this volatility can be harnessed as an advantage. Experienced investors recognize that volatility creates opportunities to buy undervalued stocks.
Opportunities in market inefficiencies: Small-cap stocks are often under-researched and mispriced, creating fertile ground for active managers to generate alpha through stock selection.
Active management as a competitive edge: Active small-cap managers, particularly those focused on value and quality, have historically outperformed passive benchmarks during periods of heightened volatility.
Downside protection through quality: Quality-focused small-cap portfolios have demonstrated lower drawdowns during bear markets, providing investors with enhanced downside protection and peace of mind.
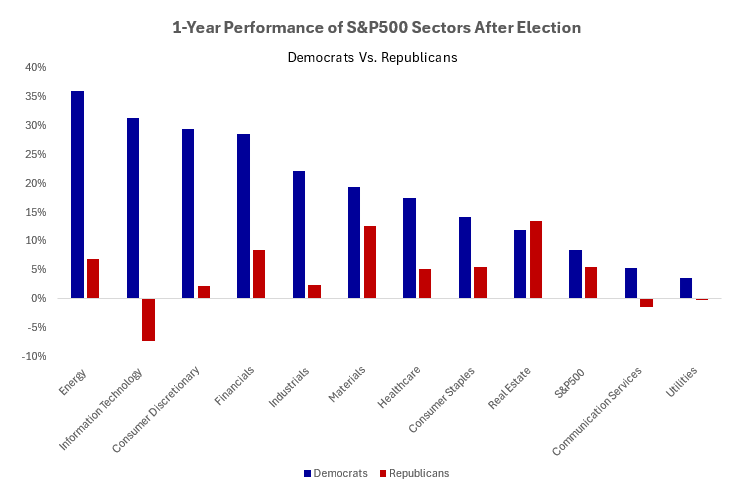
6. Historical patterns: Small caps shine in post-election
Historical evidence suggests that small caps tend to outperform following US presidential elections, driven by reduced policy uncertainty and potential regulatory easing. This trend is expected to continue in the current cycle, especially as small caps are well-positioned to benefit from a pro-growth environment.
Post-election boosts: Small caps have outperformed large caps in the 12 months following each of the past 10 presidential elections, regardless of the party in power.
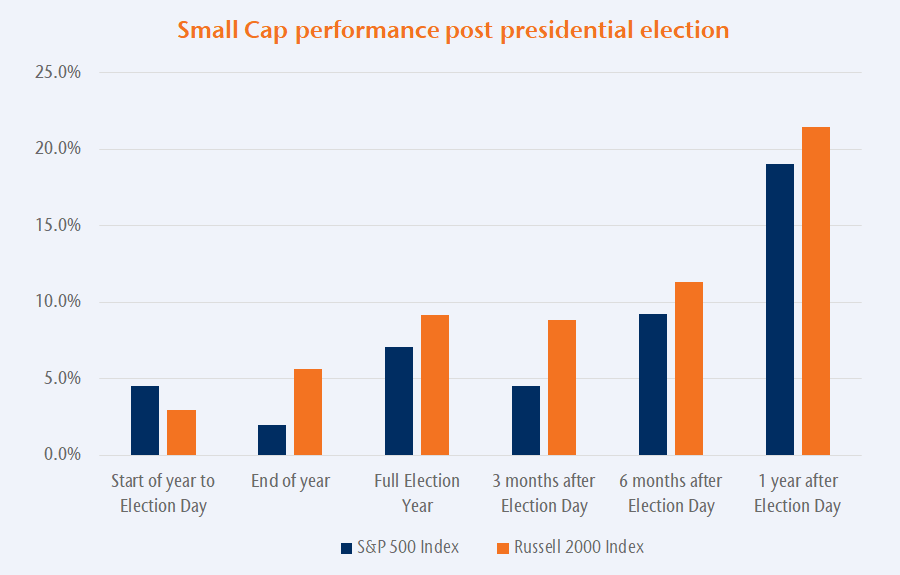
Source: Bloomberg
Conclusion: A rare and timely opportunity
The case for small caps has never been stronger. Valuation gaps, superior earnings growth, favourable macroeconomic conditions, and global diversification opportunities all point to a potential resurgence in small-cap performance. Investors who embrace small caps today stand to benefit from both short-term reversion trends and long-term structural advantages.
While volatility remains a hallmark of small-cap investing, the opportunities it creates are well worth the ride. A focus on quality companies with strong fundamentals can help mitigate risks and enhance returns. With the market poised for a shift, now is the time for investors to rebalance portfolios and capitalize on the potential offered by small caps. As the famous phrase goes, « A picture is worth a thousand words, » below illustrates why small cap is the asset class to be invested in.
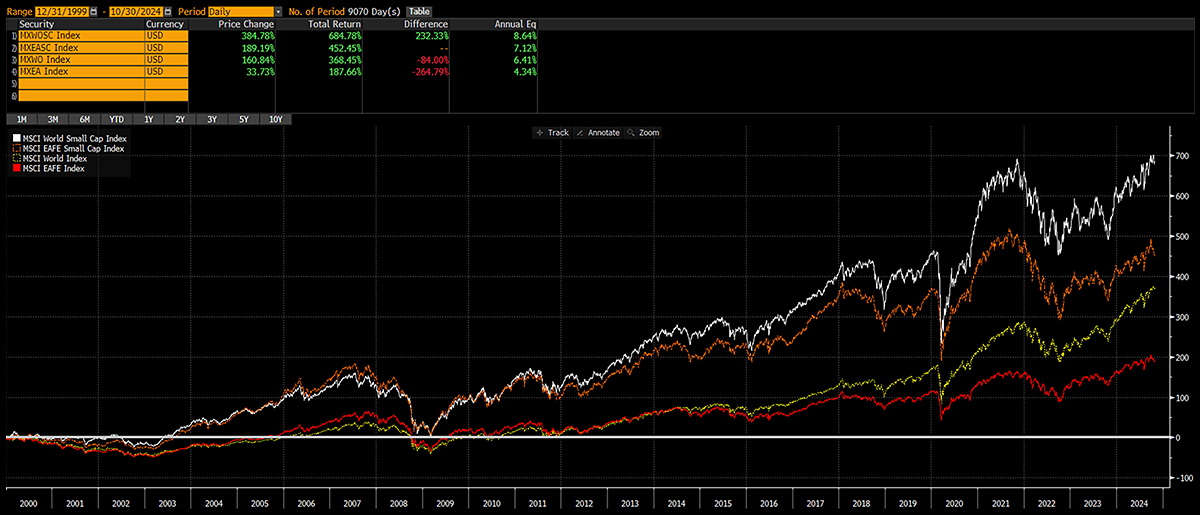
Source: Bloomberg