Downtown Warsaw skyline at night.

Building on insights from our prior research visits in 2023 and 2024, we returned to Warsaw this summer to assess how Polish companies are navigating the current economic and geopolitical environment. Over the course of a week, we conducted a series of reverse roadshows, meeting with corporate executives across sectors including consumer, real estate, infrastructure, industrials, health care, technology, media and gaming. Visiting companies in their own environments, rather than at conferences, gave us a more grounded view of their strategic focus, day-to-day operations and internal culture.

While Poland is often still viewed through the lens of its post-communist past, the reality on the ground tells a very different story. Today’s Poland is a modern, outward-looking EU economy, entrepreneurial, digitally driven and increasingly integral to regional supply chains and defence infrastructure.

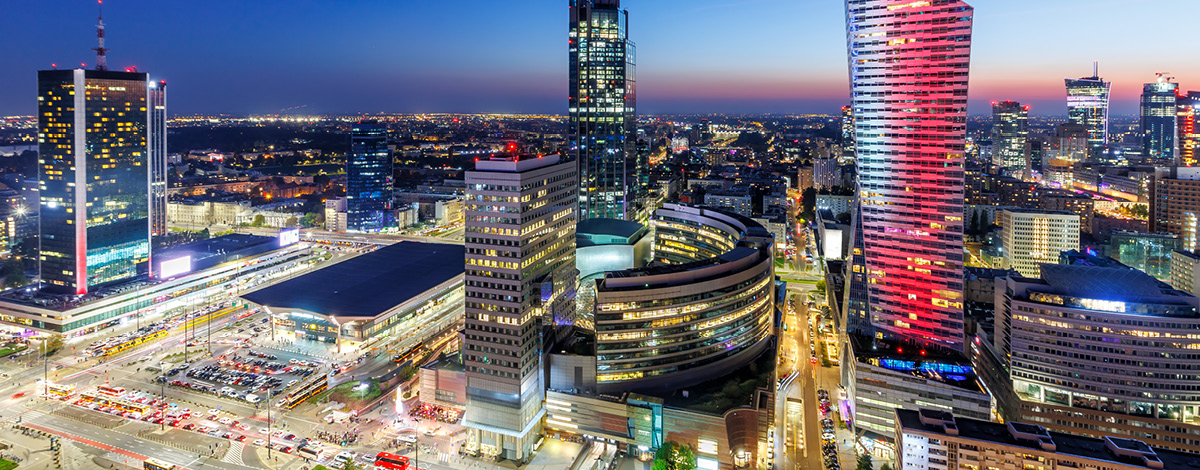
What stood out this year was the visible progress in urban infrastructure. Warsaw continues to modernize, supported by EU-backed investment in roads, rail and public transit. The subway system is not only clean and efficient, but also notably safe. Highways are well-maintained, and we observed more active construction than in prior visits, particularly in residential projects. These developments reflect ongoing urbanization, with growing challenges around land availability further reinforcing housing demand.

On the macro front, Poland appears to be regaining its footing. Wage growth has outpaced inflation over the past two years, helping to restore purchasing power. Unemployment remains among the lowest in the EU, and the National Bank of Poland has implemented two rate cuts in 2025, with room for further easing. That said, while household balance sheets are healthier, consumers remain selective in their spending. Management teams across sectors described a more stable but cautious demand environment.

Overall sentiment was notably more optimistic than in prior visits. While risks remain (from labour shortages and EU fund disbursement delays to geopolitical uncertainty) most companies projected confidence in their positioning. Disruption in global trade flows and ongoing tariff negotiations between the EU and the United States were also cited as areas to monitor, though their immediate impact on domestic operations has been limited.

Several structural themes emerged from our conversations. First, consolidation continues to reshape the competitive landscape in Poland. This was particularly evident in diagnostics, fitness, convenience retail and residential development. Second, an increasing number of Polish companies are executing or planning regional expansions into Central and Eastern Europe, and even Western Europe, suggesting growing confidence, scale and ambition.

We were also encouraged by the practical adoption of artificial intelligence (AI). Rather than buzzwords, companies are deploying AI to improve efficiency, customer experience and decision-making. Use cases included radiology interpretation in diagnostics, store network optimization in retail, chatbot support and workflow tools in classifieds, targeting in digital advertising and content generation in game development. These deployments are already contributing to margin enhancement and productivity gains.

Anecdotally, one leading convenience chain noted that it is now the largest seller of coffee and pizza in Poland, a testament to how local champions are reshaping consumer behaviour and capturing everyday spend.

In our view, Poland continues to offer a depth of high-quality, bottom-up ideas. It combines structural EU support with entrepreneurial dynamism, accelerating technological adoption and rising regional ambition. Our research efforts allow us to identify hidden champions early and build conviction through firsthand engagement.

Budimex SA (BDX PW)

A position we initiated earlier this year, Budimex reflects several of the structural themes we observed on the ground: public infrastructure, disciplined execution and regional relevance. The company is Poland’s largest infrastructure contractor, playing a critical role in the country’s road, rail, military and energy-related construction projects. It benefits from NATO and EU certifications that enable participation in sensitive public tenders, particularly in the defence sector.

Budimex follows an asset-light model, maintaining in-house design and project management capabilities while outsourcing labour-intensive work. This structure enhances flexibility and allows the company to scale efficiently across diverse projects.

While Poland remains its core market, Budimex is also expanding its footprint across the region, with active operations in Germany, the Czech Republic, Slovakia and the Baltics. These markets offer infrastructure demand that fits with Budimex’s core competencies and represent a natural next step in its evolution.

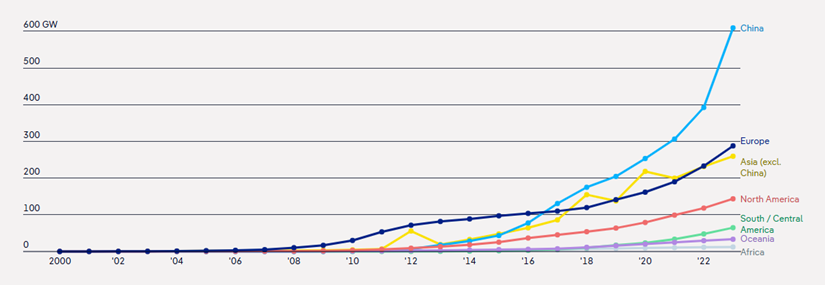
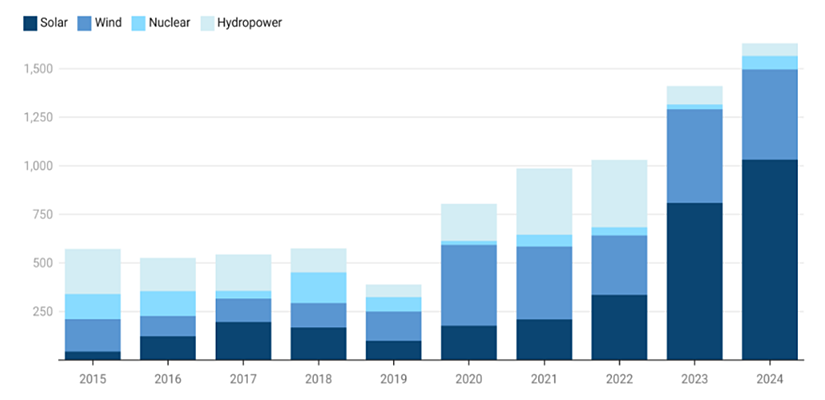
Poland is undergoing a historic infrastructure transformation, supported by EU cohesion funds, national defence investments and long-term energy transition plans. Budimex’s strong execution track record, disciplined bidding strategy and established relationships with key government entities make it well-positioned to benefit from this cycle.

While the company has developed capabilities in infrastructure services and maintenance, it is currently evaluating the strategic direction of that segment.

Windmill turbines on a sunny day in Germany on a blooming bright yellow field and blue sky.

In our last commentary, we discussed Germany’s recent infrastructure bill worth EUR500 billion to be deployed over twelve years. A key component of this bill is climate-led investments, worth one-fifth of the total budget, which finances the energy transition and climate protection measures. Examples of these measures include energy-efficient building renovations, development of electric mobility infrastructure, expansion of the hydrogen industry, promotion of energy efficiency, technologies to decarbonize industrial operations, etc.

Many countries have implemented clean energy plans to mitigate climate risk. Norway generates almost 100% of its electricity from renewable sources, primarily hydropower. Other leaders in renewable energy adoption include Sweden, Costa Rica, the UK, Iceland, New Zealand and Germany, etc.

A lesser known, but much bigger investment plan, is Japan’s Green Transformation (GX) policy worth JPY150 trillion (over USD1.1 trillion) to be executed over ten years. It was announced in February 2023 with many detailed targets across energy, transport, construction, industry and finance. Its goal is to achieve carbon neutrality by 2050 and transform the country’s economy toward clean energy.

In our Sustainable Global Small Cap Strategy, clean energy and sustainable infrastructure are among the major themes. We have witnessed the strong growth of some holdings benefiting from these mega trends. Below are a few examples:

  • Boralex Inc. (BLX CN) develops, builds and operates renewable energy power facilities (wind, hydroelectric, solar and thermal). It owns and operates about 100 wind power stations, 15 hydroelectric plants, a dozen solar power stations and two energy storage facilities. Its combined installed capacity has more than doubled in the past five years to over 3.1 GW, with 8 GW in the pipeline. Major markets are Canada, France, the United States and the UK.
  • Aecon Group Inc. (ARE CN) is a Canadian construction company, providing a range of services to private and public sector clients in infrastructure, mostly in North America. In 2024, 59% of its revenues and 78% of backlog were tied to sustainability projects from renewable energy (hydroelectric, geothermal, solar) to energy transition (nuclear, battery storage, energy transmission and grid modernization) and water management (supply, distribution and wastewater treatment). As of March 31, 2025, it had a record-high backlog of CAD9.7 billion.
  • Nexans SA (NEX FP) is a global leader in cable systems and services. It is strategically focusing on the electrification market. 75% of sales generated from products and services contribute to energy transition and efficiency. Well-known for its high-voltage transmission cable and subsea cable, Nexans specializes in power generation, transmission, distribution, infrastructure, telecommunication, mobility services and more. As of March 31, 2025, it had a record-high backlog of EUR8.1billion. Major markets are Norway, France, Germany and Canada.

Within the theme of sustainability is the growing industry of green hydrogen. The global green hydrogen market size is currently estimated at over USD12 billion in 2025 and is expected to expand at a CAGR of 41% from 2025 to 2034.

Projected growth of green hydrogen market size from 2024 to 2034.

There are national policies in place that favour green hydrogen: Germany’s hydrogen strategy targets at least 10 GW production of green hydrogen by 2030; the UK’s hydrogen strategy requires at least half of its 10 GW target to come from green hydrogen by 2030; Japan’s hydrogen strategy focuses on achieving carbon neutrality by 2050 through the widespread adoption of hydrogen across various sectors.

There are three main types of electrolysis used for green hydrogen production: Proton Exchange Membrane (PEM), Alkaline and Solid Oxide. Advantages of PEM electrolysis specifically are that it uses a solid polymer electrolyte membrane and operates at higher current densities, making it suitable for dynamic and intermittent renewable energy sources. Major players in the PEM segment include Plug Power, Nel Hydrogen, Cummins and, one of our holdings, ITM Power PLC (ITM LN).

ITM Power is a pure-play in green hydrogen and manufactures electrolyzers based on PEM technology; it’s known for its work with Linde on large-scale PEM electrolyzers. Germany is its biggest market generating 37% of total sales, followed by the UK, Austria, Australia and rest of Europe.

Countries prioritizing initiatives for renewable energy, sustainable infrastructure and electrification will look to work with companies specializing in these sectors. We feel that the holdings within our Sustainable Global Small Cap Strategy are well positioned to benefit from this global effort toward a greener future.

Arial view of bank towers in Frankfurt, Germany.

Germany has embarked on a historic transformation of its fiscal and economic landscape with the passage of its latest infrastructure bill in March 2025. This legislation, resulting from a rare constitutional amendment, is poised to have profound and far-reaching effects on the German economy, public services and the broader European region over the next decade.

The new law creates a €500 billion infrastructure fund, to be deployed over twelve years, aimed at modernizing Germany’s aging infrastructure and stimulating economic growth. This fund operates outside the traditional constraints of Germany’s “debt brake,” a constitutional rule that previously limited new government borrowing to 0.35% of GDP. The reform also allows for increased borrowing by the federal states and exempts defence spending above 1% of GDP from debt restrictions, thereby freeing up additional fiscal resources for investment.

Last week, the government coalition agreed to borrow almost €500 billion to raise the defence budget to the new NATO target of 3.5% of GDP by 2029, and to borrow almost €300 billion for infrastructure over the same period.

This fiscal expansion should boost domestic demand for many years and more than compensate for weaker external demand. Fixed investment in machinery and equipment, as well as in construction, are likely to benefit from this fiscal impulse.

The infrastructure bill is expected to have positive spillover effects across the European Union. Improved transport links, increased demand for goods and services and a more competitive German economy could strengthen the EU’s overall economic resilience. Furthermore, the focus on energy transition and digitalization aligns with broader European climate and innovation goals.

Konecranes PLC (KCRA HE), one of our holdings in our international strategy, is well positioned to benefit from this massive infrastructure spend.

Konecranes is a global leader in material handling solutions, serving a broad range of customers across several industries. Its product portfolio lifts, handles and moves goods in a safer, more productive and sustainable way. The company reports under three business segments:

  • Industrial services: It provides maintenance services and spare parts for any kind of cranes and hoists. With presence in more than 23 countries, Konecranes has one of the most extensive maintenance coverages globally. This segment represents 36% of revenue but more than 56% of income.
  • Industrial equipment: It provides industrial cranes and hoists for a wide range of customers, including general manufacturing, logistics, distributors, construction and engineering, metals and transportation equipment. This segment represents 29% of revenue and 20% of income.
  • Port solutions: It provides heavy cranes, mobile equipment, software and services for the container handling industry. Konecranes remains the only western player with a broad end-to-end offering for port terminals. Most of the world’s automated container terminals run on Konecranes product. This segment represents 35% of revenue and 24% of income.

Konecranes is exposed to structural growth through increasing automation and digitalization in industry, where its smart lifting and IoT solutions are in high demand. The global rise in e-commerce and logistics boosts demand for its port and warehouse equipment. Sustainability trends drive customers to modernize with Konecranes’ energy-efficient and low-emission solutions. Additionally, infrastructure investment and industrial growth in emerging markets continue to expand its long-term customer base. We believe it is well-positioned to benefit from higher defence and infrastructure spending globally.

GACM_COMM_2025-06-13_Banner

Last week, we visited Federal Signal’s flagship manufacturing facility alongside a select group of investors. Touring the plant floor, seeing the latest innovations in action and engaging directly with the teams driving Federal Signal’s record-setting growth gave us invaluable insights that numbers alone can’t provide. This on-the-ground approach reflects our commitment to deep diligence and transparency – values that set us apart in the investment community.

Our group witnessed not only the impressive scale of production, but also the operational excellence and culture of continuous improvement that permeate every corner of the company. From the hum of new automated machinery to the pride in the eyes of long-tenured employees, the visit reaffirmed why Federal Signal remains a leader in its field and a valuable investment.

GACM_COMM_2025-06-13_Image01
Vactor Manufacturing production plant in Streator, IL. Source: Global Alpha.

GACM_COMM_2025-06-13_Image02
A truck outside the Vactor Manufacturing production plant. Source: Global Alpha.

GACM_COMM_2025-06-13_Image03
Another section of the production plant, highlighting other brands produced by Federal Signal. Source: Global Alpha.

GACM_COMM_2025-06-13_Image04
A specialized truck produced by Federal Signal. Source: Global Alpha.

Who is Federal Signal?

Federal Signal Corp. (FSS NY) makes specialized vehicles and equipment that help keep communities safe, clean and running smoothly. In simple terms, the company builds things like street sweepers, sewer-cleaning trucks, fire rescue vehicles and emergency warning systems. Their products are used by cities, governments and businesses to clean streets, manage waste, respond to emergencies and alert people to danger.

Federal Signal: A platform built for power and agility

Federal Signal’s story is one of transformation and resilience. Over the past decade, the company has built a powerful platform that combines organic growth, strategic acquisitions and a robust aftermarket business. Since 2016, net sales have grown at a compound annual rate of 13%, reaching a record $1.86 billion in 2024. The company’s ability to scale quickly has been critical in overcoming challenges and seizing new opportunities.

Inside the plant: Innovation, efficiency and teamwork

During our visit, we saw firsthand how Federal Signal’s operational strategies translate into real world results:

Production efficiency: The Streator, Illinois facility set a new record for unit production in 2024, thanks to improved supply chains and process enhancements.

Lean initiatives: The Federal Signal Operating System, including 80/20 programs and lean manufacturing, is driving efficiency, cost savings and reduced lead times across the organization.

Electrification and new product development: The company continues to invest in electrification, with new offerings like the fully electric Broom Bear street sweeper and Rugby Vari-Class dump platform.

Safety and security: The Safety and Security Systems Group (SSG) posted a 7% sales increase, with EBITDA margins rising by 170 basis points, reflecting strong demand for public safety equipment and operational discipline.

These achievements are not abstract – they are visible on the plant floor, in the streamlined workflows and in the pride of the workforce.

Strategic growth: M&A and aftermarket expansion

Federal Signal’s disciplined approach to mergers and acquisitions (M&A) has been a key driver of its growth. Since 2016, about half of top-line growth has come from M&A, with a focus on integrating and strengthening acquired businesses. The recent acquisition of Hog Technologies, a leader in road marking and water blasting equipment, expands Federal Signal’s reach into new geographies and end-markets, such as airports.

The company’s aftermarket business – parts, service, rentals and training – continues to expand, providing stable, recurring revenue and deeper customer relationships. This diversification of revenue streams helps buffer the company against economic cycles and positions it for long-term sustainability.

Positioned for the future: Resilience and opportunity

Federal Signal’s future is bright, supported by a robust backlog, a healthy M&A pipeline and a diversified customer base. The company is well-positioned to benefit from ongoing infrastructure investment, including federal stimulus funds and the bipartisan Infrastructure Bill, which are driving demand for essential equipment like sewer cleaners, street sweepers and safe digging trucks.

A key differentiator is Federal Signal’s ability to adapt – whether by bringing more production in-house, optimizing distribution or leveraging cross-selling opportunities among its brands. The company’s platform approach ensures that every new acquisition and product line strengthens the whole.

What sets Global Alpha apart: The value of being there

Our recent plant visit is more than a symbolic gesture – it’s a core part of our investment philosophy. By engaging directly with Federal Signal’s people and processes, we gain a nuanced understanding of the company’s strengths and opportunities that goes beyond financial statements. This hands-on diligence gives us – and our investors – confidence in the company’s trajectory and our decision-making.

In a world where many rely solely on remote analysis, our willingness to “walk the floor” sets us apart. It’s how we build conviction, spot emerging trends early and ensure we’re investing alongside the best teams in the business.

Conclusion: Moving forward together

Federal Signal’s journey is one of continuous growth, innovation and resilience. As we saw firsthand this week, the company’s success is driven by a powerful platform, a culture of excellence and a commitment to serving customers and communities.

We are excited to continue this journey with you – on the ground, in the field, and at the forefront of industry leadership. Thank you for your trust and partnership.

Strawberries and oranges displayed at a fruit stand in a market in London, England.

One of the greatest disruptions in recent years to the global grocery market has been the rising popularity of discount retailers like Lidl and Aldi. The two German-based supermarket chains have expanded rapidly, challenging the incumbent grocery players to rethink their strategies.

Lidl and Aldi have consistently taken market share in key markets. In the United States, Lidl and Aldi had a combined market share of 10% in 2024. It is a similar story in the UK where the two now account for around 18% of the grocery market, up from just 4% in 2008.

Line graph showing the percentage of market share for different grocers in Great Britain.

Source: Grocery Market Share – Kantar

The recipe for their massive success is well known: a low-cost business model that aims to offer customers high-quality products at lower prices compared to traditional grocery chains.

The Global Alpha team recently added B&M European Value Retail SA (BME LN) to the portfolio to gain exposure to the discount retailer trend. B&M is the UK’s leading variety goods value retailer. The main brand, B&M itself, offers grocery, fast-moving consumer goods (FMCG) and general merchandise in a variety of stores, located in out-of-town, suburban retail parks or, more recently, town centers.

B&M has a similar playbook to when Aldi and Lidl first entered the UK market, with an everyday-low-cost operating model leading to an everyday-low-price offering. Where B&M differs from Aldi and Lidl is that they offer a more targeted range of branded convenience grocery products such as shelf-stable food, soft drinks, confectionery and alcohol, in addition to FMCG categories such as toiletries and cleaning products.

Aldi and Lidl’s success has been built largely on the back of private-label products. Aldi stocks its stores with around 90% private-label products across all categories. B&M sells the well-known brands that families have been accustomed to using for years, sometimes generations, often at a 15% to 20% discount to the traditional grocer. B&M can do this as they have a disciplined approach to which stock keeping units (SKUs) they keep in store. By focusing on the top sellers, the volume demanded for a particular SKU creates buying power and more advantageous buying terms.

An easy way to visualize what B&M offers is to think of the middle aisles of a supermarket. B&M’s offering should be seen as complementary to, rather than a substitute for, a fresh grocery shop. Management has even communicated that some of their better performing stores are located next to an Aldi or Lidl; a customer will shop for fresh or frozen items in Aldi or Lidl, then completes the shopping in a B&M store.

In addition to the focused grocery offering, B&M offers higher-ticket general merchandise products that cover product categories such as homewares, electrical, gardening, toys and DIY. As customers wander the aisles, there is a “treasure hunt” browsing experience that often leads to impulse purchases. The general merchandise products are more aligned to seasonal trading patterns – the spring/summer seasons will see more garden and outdoor living products, whereas the autumn/winter seasons will see more toys and Christmas decorations.

The low-cost sourcing discipline is key to maintaining a price advantage over the competition. The reduced complexity of the supply chain helps keep costs low. Selling no fresh or frozen products means no need for refrigeration or freezers either on the shop floor or in storage areas. There is also less waste and the need to reduce prices to clear fresh produce approaching expiration date. B&M does not have an online or click-and-collect operation. As well as being historically lower profitability than offline purchases, it also adds a layer of complexity.

When shopping for groceries, a little bit of planning can go a long way. B&M has increasingly become a part of the weekly routine for budget-conscious shoppers. B&M will be a long-term beneficiary of the discount retailer trend and shows that growth can be found in “value.”

Like-for-like growth is typically highly profitable and the most desirable form of growth. B&M themselves state that 1% in LFL sales growth is the same as opening over seven new stores, but without the associated capex or increase in fixed costs. This can be achieved by taking a bigger share in existing catchment areas by offering a great value proposition. But B&M has a parallel growth strategy. The company expects to increase store numbers by at least 60% to reach no less than 1,200 B&M stores in the UK. This represents a decade-long growth runway at the current pace of openings. The new stores tend to be larger and often with a garden centre attached, so underlying sales are expected to grow ahead of the 60% increase in stores. More stores equal more volumes and, in turn, greater benefits to buying and productivity.

France is another avenue of growth. B&M entered the French market in 2018 via an acquisition, but all stores now operate under the B&M fascia. B&M currently operates 124 stores in France which has a population like that of the UK where B&M is targeting over 1,200 stores. Despite the upside potential in new stores, the pace of the rollout is slower than in the UK, opening around 10 new stores per year, due to a focus on profitable growth rather than rapid expansion.

The traditional top four UK grocers are not idly standing by while the discounters take market share. Asda was the first to come out and promise price cuts to be more competitive. Tesco PLC (TSCO LN), the market leader, expects a significant reduction in profitability owing to “a very competitive market.” J Sainsbury PLC (SBRY LN) then announced price cuts to compete with Tesco and Asda.

Price war or not, discount retailers are here to stay, and we believe B&M has a long cycle of growth ahead.

Greek yogurt, blueberries and cantaloupe.

“You are what you eat.”

The importance of gut health has been gaining a lot of attention in the last couple of years. There has been research highlighting the importance of gut health and how it contributes to the better overall health of an individual. More research is emerging, but many experts believe that we are still at the tip of the iceberg in terms of understanding the incredible role that the gut has to play in our bodies.

The gut is responsible for breaking down the food that we eat and absorbing nutrients. The trillions of microorganisms that live inside the gut are meant to help boost the immune system, help with weight management and stabilize the body’s blood sugar levels, among many other functions. These microorganisms are impacted by the foods we ingest; eating nourishing whole foods rather than processed foods can promote greater colonization and multiplication of the gut bacteria, improving overall health. Numerous studies have shown that ultra-processed foods – typically high in fat, sugar and additives like emulsifiers – can alter the gut microbiome and trigger chronic inflammation. Since the discovery of the gut microbiota’s role in health, research on how diet affects it has grown significantly.

Ultra-processed foods are industrially manufactured, highly palatable and convenient, but they often have poor nutritional value. Their consumption is especially high in high-income countries where they contribute a substantial portion of daily energy intake. As incomes rise, dietary patterns shift toward these types of foods, leading to increased rates of non-communicable diseases such as obesity, type 2 diabetes and cardiovascular conditions. This rise in disease burden in wealthier nations is closely linked to both changes in diet and lifestyle, including more sedentary behaviour and urbanization.

Given the negative impact of ultra-processed foods on gut health and their association with chronic diseases in high-income countries, there is growing interest in strategies to support and restore a healthy gut microbiome. One such approach is the use of probiotics which are live microorganisms that help increase the diversity of the gut microbiome and enhance overall gut health. With rising consumer awareness of gut health’s importance, probiotics have gained popularity as a vital component of dietary supplements and functional foods. Beyond gut health, probiotics contribute to a stronger immune system.

A significant portion of the body’s immune cells lives in the gastrointestinal tract, and a healthy microbiome is essential for optimal immune function. Probiotics can enhance immune response, reduce the incidence of respiratory infections and may even help manage allergic conditions. Furthermore, emerging research suggests potential mental health benefits linked to the gut-brain axis, indicating that probiotics might help alleviate anxiety and depression symptoms. Among the companies leading this movement, BioGaia stands out due to its strong scientific foundation, innovative products and dominant market presence.

BioGaia

BioGaia AB (BIOGB SS), a Swedish biotechnology company, has positioned itself as a global leader in probiotic development, specifically in the medical-grade and pediatric segments. With over 30 years of research, BioGaia focuses on developing probiotic products based on robust scientific research. Their flagship strain, L. reuteri DSM 17938, is backed by numerous clinical studies demonstrating its effectiveness in treating infant colic, reducing diarrhea in children and improving oral health.

One of BioGaia’s key strengths is its commitment to science and partnerships with academic institutions and healthcare professionals. Unlike many supplement companies that rely on generalized claims, BioGaia ensures its probiotics are clinically tested and validated for specific health conditions. This evidence-based approach has earned the company credibility and trust among pediatricians, dentists and gastroenterologists worldwide.

Additionally, BioGaia has achieved a strong market presence through strategic global distribution. Its products are available in over 100 countries, either under the BioGaia brand or through licensing partnerships with pharmaceutical companies. This extensive reach, combined with a focus on high-quality, well-researched products, has helped BioGaia capture significant market share in the growing probiotics industry.

Alkaline batteries with focus on a single red battery in the middle.

One of the joys of investing in the world of small caps is discovering a company that has carved out a niche in the most unexpected of markets. Most of these companies go unnoticed as part of a larger value chain, their products often hidden from the eyes of the end consumer. The idea of a “hidden champion” toiling away in deliberate obscurity while quietly dominating a niche sector or technology was first highlighted by renowned management consultant Hermann Simon in his book – “Hidden Champions of the Twenty First Century.”

What is a hidden champion, one might ask? According to Simon, hidden champions have the following three attributes:

  1. They are in the top three of their chosen global niche.
  2. They generate revenue between $5 million and $5 billion.
  3. They maintain obscurity in terms of brand recognition (B2B in most cases).

Some of the attributes that define them are also what makes them successful. The key lessons we can take from observing hidden champions are:

  • Ambition: Despite their size, they set extremely ambitious goals. It is market leadership or bust. Goals are invariably long-term focused with decades in mind.
  • Specialization: Their preference is both extreme focus and depth of focus. They identify narrow markets and specialize in them.
  • Globalization: Their specialization is then unleashed on global markets. They aggressively hunt for new markets and prefer to serve those markets with their own subsidiaries instead of getting tied up with third parties.
  • Innovation: Scarcity of resources due to their small size means they need to be much more effective with R&D. Thinking outside the box means you need to innovate not just products, but processes as well.
  • Customer closeness: Large customers can be demanding and often want the lowest price. Hidden champions respond by engaging closely with customers. Providing advice and system integration services by closely engaging with customers creates stickiness and deep moats.
  • Financing: Most hidden champions are self-financed with ownership that is long-term oriented and conservative with capital allocation.
  • Culture: Culture is high performance with more work to go around than headcount. Turnover is low and managers tend to have long tenures.

Hidden champions tend to be everywhere in the world of small caps, including in emerging markets. In our emerging market small cap portfolio, we have a good representation of hidden champions serving a diversity of end markets. Take Hongfa Technology Co. Ltd. (600885 CH), a Chinese company which has carved out a niche in power relays and is the global leader with over 20% market share. Power relays are a crucial component of any electric equipment that is a part of modern life. They convert a low power input into a high power outcome. From home appliances to industrial equipment, alarms and automobiles, its relays form a ubiquitous part of our lives. As the world upgrades its power grids and AI drives higher power consumption, Hongfa’s high-voltage products should see enhanced demand in the coming years.

Similarly, we own a company in Korea called Vitzrocell Co. Ltd. (082920 KS) which is among the top three players globally in manufacturing primary batteries. Primary batteries have high energy densities, a low discharge rate (allowing them to run for 10 years and beyond) and a wide operational temperature range (-55°C–+85°C). This makes them ideal for use in harsh conditions that require extremely high reliability like oil and gas equipment, rockets and utility meters.

Finally, over in India, we own Suprajit Engineering Ltd. (SEL IN), which is the second largest global manufacturer of control cables and third largest manufacturer of halogen lamps. Suprajit makes over 15,000 types of control cables used in passenger vehicles, two- and three-wheelers and off-highway vehicles like tractors and recreational vehicles. Control cables, as the name suggests, transmit control signals to control equipment versus power cables that transmit high voltage power.

Suprajit is the textbook example of a hidden champion with their stated goal of being a leader in control cables, growing a global manufacturing footprint, deep relationships with leading OEMs and nimble, low-cost R&D efforts leveraging talent in India. With most of global manufacturing now located in emerging markets, we see a landscape littered with hidden champions waiting to be uncovered.

The two flags for Mexico and Brazil on textile cloth.

President Trump’s spree of tariffs has incited many global leaders to respond in kind by imposing their own tariffs on US exports. But not all leaders have been pulled into the tit-for-tat game. Mexico and Brazil’s economies depend on trading relationships with the United States and their leaders have employed different strategies with which to respond to Trump’s tariffs.

Mexico

The United States is Mexico’s largest trading partner by far. Mexico was the second-largest destination for US exports and the top source of US imports. In 2024, Mexico exported an estimated USD505.9 billion: over 80% of total Mexican goods exports were to the United States and over 40% of total Mexican goods imports were from the United States.

Mexico’s largest exports to the United States include vehicles and automotive parts, followed by electrical equipment like computer data processing units, as well as medical instruments and fruits and vegetables. Given the relationship between the countries, Mexican President Claudia Sheinbaum has a crucial part to play to reduce impacts.

President Trump threatened Mexico with tariffs if there was no increase in effort to reduce fentanyl trafficking. Mexico responded by placing 10,000 troops at the border to reduce drug trafficking and illegal entry, but did not react with reciprocal tariffs, unlike China and Canada. We believe this has played well given that the United States has not implemented any additional tariffs, whereas other countries received a range of 10% to 49%.

Sheinbaum is prioritizing a commercial relationship with the United States and Trump has adopted a warmer tone with Sheinbaum than with foreign leaders who have matched his confrontational style. This strategy has been received well not only by Trump, but by Mexico’s citizens – Sheinbaum’s popularity has surpassed that of previous Mexican leaders.

Bar graph illustrating the popularity of previous Mexican presidents, showing that President Sheinbaum is in the lead.

A company we like in Mexico is Bolsa Mexicana de Valores, S.A.B. de C.V. (BOLSAA MX). Bolsa is a Mexico-based stock exchange operator that functions as an integrated and organized market for equities, financial derivatives and OTC fixed-income instruments. It has access to custody, clearing and settlement of transactions and the sale of information.

The company generates over 50% of revenue through transaction fees. Bolsa should be seeing benefits, given the volatility of the market and the high volume of transactions as investors try to capitalize.

Brazil

The United States’ total goods traded with Brazil was an estimated USD92 billion in 2024, and imports from Brazil in 2024 totaled USD42.3 billion. Industrials comprised over three quarters of Brazilian exports to the United States. Key industrial products exported include crude oil, aircraft, coffee, cellulose and beef.

Brazilian President Luiz Inacio Lula da Silva (also known as “Lula”) has been in a tough spot. As the trade fight escalates between Brazil’s two largest trading partners, Lula does not want to have to choose between China or the United States. China has been Brazil’s largest trading partner for the last 15 years and this relationship has only grown.

The United States has implemented just 10% tariffs on Brazil. Lula has not retaliated, which we believe has worked in his favour, and recent approval ratings reaffirm.

Line graph illustrating the popularity of Brazilian President Lula over time, showing that his approval ratings are recently rising.

A company we like in Brazil is Vivara Participações S.A. (VIVA3 SA). Vivara is the largest jewelry player in Brazil. The company sells jewelry, watches and luxury accessories under two different brands: Vivara and Life.

Vivara has unparalleled scale, doubling their store footprint since 2018 with 265 Vivara and 180 Life stores representing 20% market share. The next four jewelry players represent a total of 6%, and the remaining smaller players represent 74%. Vivara has built all its production steps vertically, manufacturing ~80% of products sold. Vivara’s main production facility is in the Free Economic Zone of Manaus where it benefits from certain business tax incentives. The company currently trades at a P/E ratio of 7x which is half the multiple that its global luxury jewelry peers trade at.

Using smartphone & laptop to view gambling app.

Nobody is as opiniated as a fan of a particular sport team. This probably explains why there exist so many metrics for any given professional sport: to justify why your team is the better team. Despite multiple millions of data points now gathered per baseball game, no one seems to be replicating the success of the Moneyball story, but that doesn’t stop fans from spending hours upon hours analyzing data in an attempt to make a quick dollar from sports betting.

Sports betting was legalized in the United States in 2018 after the Supreme Court decision to strike down the Professional and Amateur Sports Protection Act (PASPA). Since then, 39 states have legalized sports betting, and that number is expected to reach 45 in the next two to three years. The US market therefore represents a large opportunity compared to the more mature international markets:

Modern sports betting is much more data-driven and real-time than it was just 10 years ago when the majority of bets were simply on which team would win. Now, more than half of bets are made during the games (in-play betting) and can be made on virtually anything from coin toss (NFL), first foul (NBA) or number of fights (NHL). This new breadth of betting requires robust data integrity and is therefore why industry stakeholders must rely on a single source of truth (read: data providers).

“Without data you’re just another person with an opinion.” – W. Edwards Deming, Statistician

The professional sports data-aggregation business is essentially a duopoly run by Sportradar Group AG (SRAD US) and Genius Sports Ltd. (GENI US), and Global Alpha is a shareholder of both. These two companies offer B2B data and technology solutions for the sports industry. The core of their business models is to hold streaming rights and exclusive data acquisition for specific sports leagues that are then sold to sportsbook operators like DraftKings and Flutter. They also offer solutions back to sports leagues, teams and broadcasters such as data analytics and insights, as well as augmented display and data overlay or even odds creation.

The lucrative reason for their existence is straightforward: the technology platforms used to collect, clean and aggregate live data require specific expertise that sports leagues do not possess and would be expensive to replicate; it is much easier for leagues to outsource to SportRadar and Genius Sports and benefit from the materially increased consumer engagement as well as royalties.

SportRadar was founded in 2001 and was one of the first online live sports statistics data collection websites. Its initial public offering (IPO) happened in 2021 and it owns rights to the NBA, NHL, MLB, F1 and the European Football League.

Illustration of Sportradar's relationships with sports leagues and sportsbooks.

Genius Sports is the new(er) kid in the industry, resulting from a merger of Betgenius and SportingPulse in 2016 to create a direct competitor to SportRadar. It owns data rights to NCAA, NASCAR, NFL, PGA Tour and European Basketball.

Illustration of Genius Sports' relationships with sports leagues, sports betting and broadcasters.

These two companies check many of the boxes we look for when investing:

  • The majority of revenue is steady, predictable and globally diversified.
  • A net cash position and resilient balance sheet allowing for flexibility and potential M&A.
  • A large growing market with catalysts for accelerated growth.
  • A competitive advantage that is unlikely to be challenged over our investment period.

Between the two companies, SportRadar and Genius Sports own the official rights to virtually all major western sports leagues. Furthermore, they have been developing other angles for partnering with leagues beyond just distribution of data and they’re progressing toward becoming their technology arms. Through their data aggregation and technology solutions, the US sports-betting players are poised to grow and with plans for future innovation, they look to be investments you could bet on.

A field of solar panels with oil pumps in the background.

Since taking office in January, the Trump administration has attacked the wind and solar energy industry. It withdrew the United States from the Paris climate agreement and rolled back the Inflation Reduction Act (IRA).

President Donald Trump took swift action on the first day of his second term. He paused federal permits and leasing for onshore and offshore wind projects and ordered a review of existing leases. On April 17, he went even further and blocked work on a wind project already in progress off the shores of New York State.

This is not a new direction for President Trump.

In January 2018, the first Trump administration put a 30% tariff on solar panel imports. Despite the challenges, the federal Investment Tax Credit (ITC) remained in place and the solar energy industry continued to grow. However, amid much confusion in the tariff announcements and rollbacks of the last few weeks, solar cells were not exempted from US tariffs and are now subject to tariffs that range from 50% to 3,521%. If we add the 25% tariffs on steel and aluminum imports, the cost of installing solar energy has increased dramatically.

Why is this important?

In the last two decades, the growth in both US oil and gas production and in renewables made the United States an energy superpower that enjoyed a competitive advantage over most countries.

Electricity prices for enterprises worldwide in March 2024, by country (in USD per kilowatt-hour)

UK 0.52 Mexico 0.19
Italy 0.43 Canada 0.14
Singapore 0.32 India 0.12
Japan 0.19 Brazil 0.11
France 0.18 China 0.09
USA 0.14  

Source: Statista

However, in the last few years, with the reduction in costs for solar and wind energy, the cheapest additional kilowatt of electricity is wind-powered, closely followed by solar (taking into account capital cost, operating costs and efficiency). The advantage the United States is currently enjoying will disappear fast and become a disadvantage by 2035 – possibly before.

It is already a major disadvantage compared to China.

While the United States backtracks, China is accelerating, installing more wind and solar power last year than ever before. The nation built capacity for 357 gigawatts (GW) of solar and wind power generation, a 45% and 18% respective increase over what was operating at the end of 2023, according to China’s National Energy Administration. That is equivalent to building 357 full-sized nuclear plants in one year.

The United States also had a record clean energy installation in 2024, supporting millions of jobs. Although less than China, it built capacity for 268 GW of solar and wind energy, according to preliminary numbers from the American Clean Power Association.

With the restrictive legislation put in place by the administration, the impact of tariffs, the complexity of multiple jurisdictions, as well as multiple grid operators with complex interconnections, the cost to install a GW of solar or wind power in the United States is now among the highest in the world: twice that of the UK or Germany and over 400% more than in China.

As the share of renewables in total electricity generation increases, the United States will soon face some of the highest electricity costs in the world. This, at a time when demand is increasing significantly – driven by AI, data centres, warming temperatures, etc. – will prove to be costly.

Let us examine how various countries and region are investing in renewables:

Europe

The Ukraine war was an enormous shock for Europe. About a quarter of the energy Europe consumes comes from natural gas and before the Ukraine war, much of that gas came from Russia. Europe needed a new source of gas quickly. It built LNG terminals and increased its imports from the United States, Norway and Qatar. As a result, Russia’s natural gas now accounts for less than 12% of Europe’s imports.

High energy prices pushed Europe to accelerate the green transition. Renewables doubled as a share of EU energy consumption from 2004 to 2022 but still accounted for only about 20% of total consumption.

In 2023, the EU increased its 2030 target for renewable energy from 32% (set in 2018) to 42.5%. By easing regulations surrounding new projects, it should reach that target ahead of the deadline.

EU countries invested over €110 billion in renewable energy generation in 2023 – ten times more money than it invested in fossil fuels. The EU wants to end its dependence on foreign sources.

Investment in the energy transition ($ billion), by region
GACM_COMM_2025-04-24_Chart01
Source: Bloomberg NEF. From 2020, grid investments are added.

Solar power is booming in Asia and Europe
Total installed solar power capacity
GACM_COMM_2025-04-24_Chart02
Source: IRENA 2024

What about China?

Clean energy contributed a record 10% of China’s GDP in 2024, represented 40% of the economic growth in China and overtook real estate sales and agriculture in value. China’s 2024 investment in clean energy alone was close to the global total invested in fossil fuel and was similar in size to Saudi Arabia’s entire economy.

China’s investment in solar power capacity has risen 10-fold in five years
Value of investments in new clean power capacity, billion yuan
GACM_COMM_2025-04-24_Chart03
Source: CREA analysis for Carbon Brief.

Solar and other clean energy sources have gone global in the past decade. In 2010–2015, 70% of solar and 50% of global wind installation occurred in developed economies. By 2023, these proportions had fallen to just over 20%. The United States now represents only 7% of the global market for newly installed solar power plants. The EU is around 12% while the rest of developed economies is around 47%.

The United States has imposed tariffs on imports from China for a long time. As a result, most of the United States’ clean energy supply now comes from Southeast Asia which was just imposed new tariffs of up to 3,521%. Only 4% of China’s total exports of solar power and wind power equipment and electric vehicles (EVs) go to the United States. Almost half of China’s export of clean energy products now go the Global South.

So, despite what looks like a step backward in the United States, the rest of the world is moving on.

According to the IEA (International Energy Agency), global renewable electricity generation is forecast to climb to over 17,000 TWh by 2030, an increase of almost 90% from 2023. This is more than the combined total power demand of China and the United States projected for 2030. Over the next six years, several renewable energy milestones are expected:

  • In 2024, solar and wind generation together surpassed hydropower generation.
  • In 2025, renewables-based electricity generation overtakes coal-fired.
  • In 2026, wind and solar power both surpass nuclear.
  • In 2027, solar electricity generation surpasses wind.
  • In 2029, solar electricity generation surpasses hydropower and becomes the largest renewable power source.
  • In 2030, wind-based generation surpasses hydropower.
  • In 2030, renewable energy sources are used for 46% of global electricity generation.

How do Global Alpha portfolios participate in the clean energy boom?

Over the last fifteen years, Global Alpha has always had investments that benefit from the growth of renewable energy. We have written numerous weekly commentaries on the topic and our exposure, all of which are available on our website under the Insights tab. Below are a few of our current holdings.

Ormat Technologies Inc. (ORA US)  is a holding in our Global, International and Global Sustainable funds and has been profiled numerous times in our weeklies. Ormat is a global leader in geothermal power, recovered energy and solar energy, as well as energy storage solutions.

Nexans S.A. (NEX FR), a holding in our international small cap portfolio, is a leading global player in sustainable electrification, supplying high-voltage transmission cables.

Nextracker Inc. (NEX US) is a holding in our global sustainable small cap portfolio and is a global leader in intelligent, integrated solar tracker and software solutions used in utility-scale and distributed generation solar projects.

Mentioned earlier, the Global South and emerging markets are now the fastest growers in the renewable energy market. In our emerging market small cap portfolio, we own many companies benefiting from that growth.

One example is Cenergy Holdings S.A. (CENER GR). Cenergy is a global leader in energy transmission infrastructure, and a competitor of Nexans, highlighting the synergies between our research analysts and opportunities created by our thematic overlay.