Analyste de données d’affaires afro-américaine utilisant un ordinateur; l’écran affiche une carte géographique mondiale et des données.

À l’échelle mondiale, les investisseurs ont adopté les actions mondiales à petite capitalisation comme source de diversification boursière. Malgré son nom, cet univers se compose en grande partie de sociétés dont la capitalisation boursière est supérieure à un milliard de dollars américains et il comprend un nombre croissant de titres bien connus dans de nombreux marchés locaux et dont certains jouissent d’une notoriété de marque mondiale.

Principaux avantages des petites capitalisations mondiales

Moins petites qu’on ne le croit Plus de 2 600 sociétés mondiales à petite capitalisation ont une capitalisation boursière supérieure à 1 G$ US
Ampleur et profondeur Le titre le plus important ne représente que 0,2 % de l’indice et la diversification sectorielle est supérieure à celle des autres grands indices
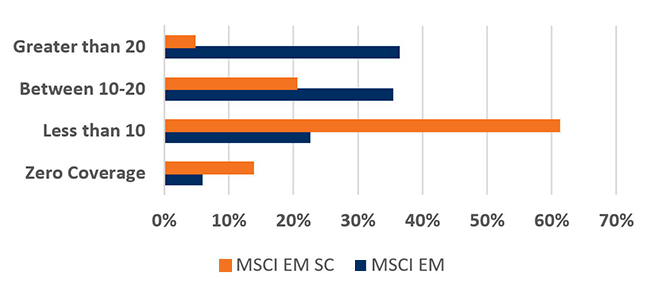
Occasions d’alpha Les marchés mondiaux d’actions à petite capitalisation sont moins prisés par les analystes de recherche que les marchés boursiers développés à grande capitalisation, de sorte que les recherches indépendantes menées par des gestionnaires actifs ouvrent la voie à des possibilités de valeur ajoutée.


L’univers des petites capitalisations

Les actions mondiales à petite capitalisation offrent aux investisseurs la possibilité de profiter d’un éventail d’occasions incomparable. L’indice MSCI Monde à petite capitalisation regroupe des sociétés à petite capitalisation de 23 pays développés. Comparativement aux titres canadiens, les occasions mondiales à petites capitalisations ne sont pas si petites. Au 31 décembre 2022, 2 643 sociétés affichaient une capitalisation boursière supérieure à 1 G$ US. L’indice composé S&P/TSX ne comptait que 209 sociétés de cette envergure.

La part du titre le plus important au sein de l’indice mondial des petites capitalisations n’est que 0,2 %. En revanche, le titre le plus important de l’indice composé S&P/TSX à la fin de 2022 représentait 6,3 % de l’indice.

De plus, les 15 actions les plus importantes de l’indice du marché boursier canadien constituaient 45 % de l’indice, tandis que les 15 titres les plus importants de l’indice mondial des actions à petite capitalisation en représentent moins de 3 %. Il faudrait que les 627 titres les plus importants atteignent une pondération indicielle de 45 % au sein de l’indice mondial des titres à petite capitalisation, ce qui met en évidence l’éventail beaucoup plus vaste des occasions de placement offertes par l’univers des titres mondiaux à petite capitalisation.

Les sociétés mondiales à petite capitalisation sont généralement bien connues sur leur marché local et certaines jouissent d’une notoriété de marque mondiale. Par exemple : L’Occitane, le fabricant, distributeur et détaillant de produits de soins de la peau et de beauté naturels et biologiques; Samsonite, la plus connue et la plus grande société de bagages de voyage au monde; IWG, qui offre des solutions d’espaces de travail à court terme (et à long terme) partout dans le monde; ainsi que des marques bien connues comme Regus.

Les avantages que comportent les actions mondiales à petite capitalisation au chapitre de la diversification vont au-delà des titres individuels. Tandis que les secteurs de la finance, de l’énergie et des matériaux dominent les principaux indices canadiens (voir la figure 1), les marchés des actions mondiales à petite capitalisation offrent une meilleure représentation sectorielle. De fait, les secteurs de la consommation discrétionnaire (p. ex., sociétés de restauration, de produits de luxe et de voyage) et de la santé y occupent une place plus importante.

Figure 1 – Avantages de la diversification que procure le marché des petites capitalisations

  Indice MSCI Monde à petite capitalisation (%) Indice composé S&P/TSX (%)
Énergie 5,0 18,1
Matériaux 7,6 12,0
Industrie 19,4 13,3
Consommation discrétionnaire 12,5 3,7
Biens de consommation de base 4,7 4,2
Soins de santé 10,7 0,4
Finance 14,3 30,8
Technologies de l’information 10,8 5,7
Services de communication 2,8 4,9
Services aux collectivités 3,2 4,4
Immobilier 8,9 2,6
Total 100 100


Sources : MSCI et Thomson Reuters Datastream. Données au 31 décembre 2022

Au cours des 10 dernières années, l’indice des actions mondiales à petite capitalisation a enregistré le meilleur rendement, mais avec une volatilité plus élevée (figure 2). Comme pour tous les marchés, il est important de comprendre les risques de placement.

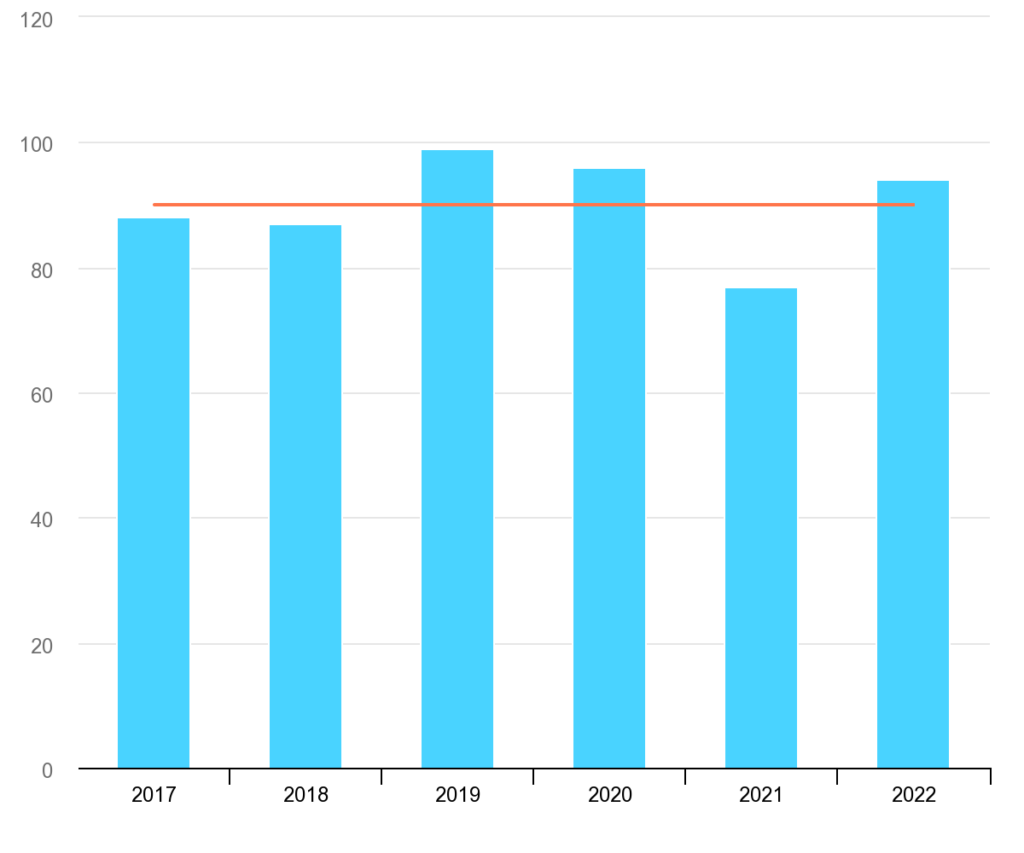
Figure 2 – Risque et rendement sur une période de 10 ans (terminée le 31 décembre 2022)

Sources : MSCI et Thomson Reuters Datastream. Remarque : Les rendements des indices sont exprimés en dollars canadiens.

Comprendre les risques

Bien que les gestionnaires actifs puissent atténuer les risques grâce à leurs recherches et à une sélection minutieuse de titres, pour ce qui est des titres mondiaux à petite capitalisation, les investisseurs doivent tenir compte de ce qui suit :

  • Risque de liquidité : Il faut parfois plus de temps pour négocier une action à petite capitalisation qu’une action à grande capitalisation.
  • Manque d’information : Même si la propriété plus élevée des initiés, associée aux actions mondiales à petite capitalisation, s’arrime aux intérêts des investisseurs, il peut en résulter un manque de transparence et d’information, ce qui n’est pas le cas des placements dans les actions mondiales à grande capitalisation.
  • Accès au crédit : Les petites sociétés n’ont pas le même accès aux marchés du crédit que les grandes entreprises, ce qui peut parfois limiter leur capacité à réaliser leur potentiel.

Reconnaître les avantages potentiels

Voici quelques avantages potentiels des petites capitalisations mondiales qui permettent de compenser les risques :

  • Potentiel de croissance : Les investisseurs qui sont en mesure de repérer la prochaine génération de petites sociétés qui connaissent une croissance rapide et qui deviennent de grandes sociétés seront largement récompensés.
  • Meilleure harmonisation des intérêts : En règle générale, les sociétés mondiales à petite capitalisation exercent leurs activités dans des secteurs plus spécialisés et les initiés y détiennent une participation plus élevée, de telle sorte que les propriétaires et les actionnaires partagent les mêmes intérêts.
  • Potentiel de diversification sectorielle : Les investisseurs peuvent profiter de la meilleure représentation des secteurs de la consommation discrétionnaire et de la santé qu’offre l’indice des actions mondiales à petite capitalisation. Par exemple, les habitudes de consommation indiquent que le secteur de la consommation discrétionnaire devrait bien se comporter à long terme. Le secteur de la santé devrait également profiter du vieillissement de la population dans les pays développés.
  • Occasion de valeur ajoutée : Les analystes externes ne font pas autant de recherches sur les sociétés à petite capitalisation. Par conséquent, les gestionnaires qui privilégient une gestion active ont une meilleure chance de surpasser l’indice de référence lorsqu’ils repèrent des actions dont le cours ne reflète pas pleinement leur valeur intrinsèque ou leur potentiel de croissance. Selon la base de données d’eVestment, 71 % des gestionnaires de l’univers des actions mondiales à petite capitalisation à gestion active ont surpassé l’indice MSCI Monde à petite capitalisation au cours de la période de cinq ans terminée le 31 décembre 2022.
  • Occasion de contrebalancer les effets du style : À la fin de 2022, plus de 4 425 sociétés faisaient partie de l’indice MSCI Monde à petite capitalisation. L’ensemble plus vaste d’occasions a donné lieu à un nombre accru de stratégies mondiales à petite capitalisation offertes par des gestionnaires de placements systématiques (quantitatifs). Grâce à une approche systématique, un gestionnaire de placement est en mesure de profiter d’une étendue de connaissances à l’égard d’un vaste univers de sociétés, comparativement à la portée des connaissances associées aux gestionnaires fondamentaux, qui se concentrent sur la sélection d’un plus petit nombre de sociétés dans lesquelles investir. Pour ce qui est des autres marchés boursiers, les investisseurs qui peuvent intégrer plusieurs gestionnaires dans une catégorie d’actif peuvent profiter des styles systématiques et fondamentaux complémentaires.

Pourquoi investir dans les actions mondiales à petite capitalisation

Ces dernières années, la concentration de l’indice des actions mondiales à grande capitalisation des marchés développés a augmenté. L’intégration d’une composante d’actions mondiales à petite capitalisation dans les portefeuilles peut offrir une source de diversification complémentaire, un plus vaste éventail d’occasions de sociétés faisant l’objet de moins de recherche à l’externe, et par conséquent offrir la possibilité de dégager des rendements supérieurs à ceux de l’indice au moyen d’une gestion active.

View of Mountain Fuji at Shizuoka prefecture, Japan.

Nuclear power is a low-carbon, reliable source of energy. Yet, over the past decade, it has struggled to play a strong role in energy transition. Nuclear power generation has been around since the 1960s and saw massive growth from the 1970s to 1990s. Since then, however, its share of global electricity production has declined from 17% in the 1990s to the current 10%, largely due to safety concerns following the tragic accidents in Chernobyl in 1986 and Fukushima in 2011.

Chart 1: Share of electricity production by source, World.

Today, nuclear energy’s role in the energy system varies by country. In 2021, for example, nuclear accounted for 69% of total domestic electricity generation in France, 51% in Belgium, 28% in South Korea, 20% in the United States, 12% in Germany, 7% in Japan, and 5% in China.

Amid the global energy crisis following the war in Ukraine, many nations have prioritized efforts to reduce their reliance on imported fossil fuels. Against the backdrop of the global climate crisis, the search for other sources takes on increased importance. Renewable energy sources have experienced remarkable growth in recent years, yet renewables alone are not sufficient to fully decarbonize the energy grid. This opens the door to an increased role for nuclear power.

According to the International Energy Agency (IEA), global nuclear capacity needs to expand by about 10 gigawatts (GW) per year to be on track with the Net Zero Emissions by 2050 Scenario. In 2022, nuclear energy had an operational capacity of 413 GW in 32 countries, thereby helping reduce reliance on fossil fuels while also avoiding 1.5 gigatonnes (Gt) of global emissions and 180 billion cubic metres of global gas demand a year. Emerging countries accounted for almost all new nuclear capacity added in recent years, while developed economies are catching up.

The UK currently has 5.88 GW of nuclear capacity, accounting for 15.5% of energy generated in 2022. It has set a goal to reach 24 GW by 2050, about 25% of UK’s predicted energy demand.

In the U.S., meanwhile, nuclear energy has consistently provided about 20% of total electricity generated over the past 30 years, and that country’s 93 operating nuclear reactors had a combined capacity of 95 GW at the end of 2021. However, as most of the American nuclear plants are approaching their 40-year design life, capacity will need to be extended or added to achieve the 2050 net zero goal.

Before the Fukushima disaster, Japan sourced about a third of its electricity from 54 nuclear reactors, but only nine are still operational. Following the war in Ukraine and the subsequent energy crisis, Japanese citizens’ sentiment toward nuclear reactors has shifted positively. In December 2022, the Japanese government announced a new nuclear energy policy aimed at maximizing the use of existing nuclear power plants and building next-generation reactors. Nuclear currently accounts for 7% of total power generation in Japan, and their goal is to increase the percentage to 20-22% by 2030. But getting there will require about 26 to 33 operational nuclear reactors.

Two major barriers hindering the growth of nuclear power are safety concerns, and elevated construction and operating costs. However, advancing technologies can help to overcome those barriers. Small Modular Reactor (SMR), for example, can be made in factories and installed on site, reducing both initial costs and construction times. The smaller size also makes economic sense for small electric grids. It is also believed to have enhanced safety characteristics.

Most recently, scientists have achieved a breakthrough by successfully producing a nuclear fusion reaction resulting in a net energy gain, instead of just breaking even as past experiments have done. Nuclear fusion provides carbon-free energy, without the highly radioactive, long lived nuclear waste created by current nuclear reactors. The process is inherently safe as fusion is a self-limiting process, the reaction can come to a halt within seconds. However, it will take years if not decades before fusion can meaningfully contribute to energy transition. The next step is to figure out how to produce more energy from nuclear fusion on a much larger scale, and at a lower cost.

Global Alpha has some holdings in the nuclear power sector that we believe offer good investment value.

For example:

Curtiss-Wright (CW US) supports the global nuclear power industry by providing precision components and highly engineered products and services. The company has an installed base of products at all nuclear plants operating in the U.S., and many operating internationally. Curtiss-Wright designed the world’s most advanced reactor coolant pump for Westinghouse’s AP1000 reactor, one of the safest and most economical nuclear plant designs available worldwide and has been approved or planned at many nuclear plant projects globally, notably in China, India, U.S., and UK. Curtiss-Wright also works with SMR and Advanced Reactors designers to ensure its presence in the future growth of this market. It has the opportunity to secure US$10 million to US$100 million in content per location.

Horiba (6856 JP) manufactures measurement equipment, specializing in the analytics and measurement of small particles in the field of environment, health, safety, and energy. Among its extensive product lineups, Horiba offers a wide range of measuring instruments and sensors to measure the pH of secondary water in nuclear power plants. For example, measurement of silica is paramount in preventing the problem of scaling, which reduces the efficiency of power generation. Horiba provides silica analyzers to allow for quick and automatic measurement for boiler water, and trace amount of silica present in pure water. 

Solar panels and wind turbines generating renewable energy.

Sustainability Theme 

One of the sustainability themes that we will be closely paying attention to in 2023 is company alignment to green CAPEX. In other words, capital expenditures (i.e., investments in physical assets such as buildings, equipment, and infrastructure) made with the intention of improving the environmental impact of a company’s operations. We believe this will be an important theme to watch on the back of the many positive regulatory changes in 2022, and those expected in 2023. In August 2022, for instance, the United States passed its Inflation Reduction Act (IRA), injecting close to $370 billion to support energy security and climate change programs. Many believe that Europe will follow suit in the coming months to help stave off a migration of Europe-based firms seeking to benefit from the American program. Ursula von der Leyen, President of the EU Commission, recently indicated that such plans are indeed in the works. Speaking last month at the World Economic Forum in Davos, she said the EU is looking at drafting a law similar to the IRA to support clean and green technologies across various value chains in Europe. This new law is said to be called the Net-Zero Industry Act. We will closely monitor these developments. 

Green CAPEX 

Green CAPEX can include investments in renewable energy sources, electrification, and other technologies or practices that help to reduce greenhouse gas emissions and improve resource efficiency. Green CAPEX is an important part of the energy transition as it enables organizations to invest in the infrastructure and technology needed to support the shift to cleaner and more resource-efficient operations. This also helps investors monitor the scale at which a company is committed to making these changes. Green CAPEX acts as a positive signal, as it shows that a company is ready to inject real capital and make the necessary financial moves to reach its goals beyond statements and empty claims. 

There are many reasons and benefits why companies would want to make investments of this kind. These benefits are explored in more detail below: 

  1. Cost savings: Green CAPEX investments can help companies reduce costs associated with energy consumption, water usage, and waste management. For example, investments in energy efficiency can help reduce energy consumption, leading to lower energy costs. 
  1. Risk reduction: Green CAPEX investments can help companies mitigate risks associated with environmental regulations and carbon pricing. For example, investments in renewable energy can help companies avoid potential penalties for emissions violations. 
  1. Reputation enhancement: Companies making green CAPEX investments can improve their reputation with customers, investors, and other stakeholders. This can be particularly important for companies that operate in sectors that are highly dependent on public opinion, such as consumer goods and services.  
  1. Increased competitiveness: Green CAPEX investments can help firms gain a competitive advantage over companies that do not invest in environmentally friendly assets or technology and stay ahead of competitors as environmental regulations accelerate around the world. For example, the EU reached a provisional agreement on their carbon border adjustment mechanism which will be “taxing” all imports based on their carbon footprints. Companies working to reduce their carbon footprint will benefit from lower financial pressures compared to higher emitting peers.   
  1. Long-term benefits: Green CAPEX investments can help companies adapt to future environmental challenges, such as climate change and dwindling natural resources, by providing long-term solutions and avoiding stranded assets. It also increases their resilience to unforeseen circumstances.  

Green CAPEX is relevant for most companies, but some will require more commitments than others. This is particularly true for the harder to abate sectors such as energy, transportation and materials.  Firms in these sectors leverage green CAPEX investments to find less carbon-intensive ways to produce the same goods. They could also use new materials, or design products which are more resource efficient. In in other words, making more with less. They can then transition to decarbonization through technologies such as carbon capture and storage (CCS) or use alternative fuels such as hydrogen or ammonia. Finally, these firms can invest in breakthrough technologies that may not yet be at the commercial scale, thereby giving themselves – and those early-stage technologies – a boost.   

From an investment perspective, we look at this theme through two lenses: 

The first is by identifying companies that have aligned their CAPEX plans with their environmental goals.  

Evaluating the extent to which they have capital committed can signal their level of potential improvement. Such a measure is still a fairly new concept and may not be reflected in the company’s valuation or appreciated by the market. However, finding traces of this kind of alignment can present interesting investment opportunities.   

Secondly, we look for companies that enable others to embrace green CAPEX.  

Finding companies that have those breakthrough technologies required to reach environmental goals will benefit. They will not only see an accelerated rate of investment, but they will also receive policy support as we saw in the U.S. As other countries and regions step up their own energy transition plans, we expect this theme to gain even more relevance going forward.  

Eurozone flash PMIs this week were less bad than expected, bolstering a growing consensus that economic prospects are improving. Monetary trends continue to argue the opposite. 

The preferred narrow money measure here – non-financial M1 – fell for a fourth consecutive month in December in nominal terms. Bank lending also contracted on the month, while the broad non-financial M3 measure grew by just 0.1%. 

The three-month rate of contraction in narrow money is a record in data back to 1970. Three-month growth of non-financial M3 is down to 2.3% annualised, less than half its 2015-19 average. Bank loan growth is also now below its corresponding average – see chart 1. 

Chart 1

Chart 1 showing Eurozone Narrow / Broad Money & Bank Lending (% 3m annualised)

Bank lending weakness is being driven by repayment of short-term corporate loans, consistent with a violent downswing in the stockbuilding cycle – chart 2. 

Chart 2

Chart 2 showing Eurozone Stockbuilding as % of GDP (yoy change) & Short-Term* Bank Loans to Non-Financial Corporations (yoy change in % 3m) *Up to 1y Maturity

The six-month rate of decline of real narrow money was little changed from November’s record despite a sharp drop in six-month CPI momentum – chart 3. 

Chart 3

Chart 3 showing Eurozone GDP & Real Narrow Money* (% 6m) *Non-Financial M1 from 2003, M1 before

The rate of contraction of real M1 deposits remains fastest in Italy, reflecting both weaker nominal money trends and higher inflation. Spanish positive divergence is mainly due to a much sharper recent CPI slowdown. 

Chart 4

Chart 4 showing Real Narrow Money* (% 6m) *Non-Financial M1 Deposits

Echoing the better PMI news, German Ifo manufacturing expectations rose for a third month in January. The new demand index, however, has recovered by less and fell back this month – chart 5. European cyclical equity market sectors have outperformed on soft landing hopes and are vulnerable if business surveys now stall, as suggested by monetary trends. 

Chart 5

Chart 5 showing Germany Ifo Manufacturing Survey & MSCI Europe Cyclical Sectors ex Tech* Price Index Relative to Defensive Sectors *Tech = IT & Communication Services
Microphone on stage in an auditorium.

For fans of Seinfeld, the line “What’s the deal with…” reminds us of a particular brand of observational comedy from the 90’s. Well, turns out 90’s humor is still a big deal, as Netflix paid half a billion dollars in 2021 for the streaming rights of Seinfeld. Not bad for a show about nothing. As we kick off a brand-new year, we thought it’s the perfect time to ask ourselves “What’s the deal with EM small cap…?”

For most investors, emerging markets (EM) as an asset class is high on the risk spectrum. They could be forgiven for thinking of small caps within EM to be a step too far. The EM small cap universe (EM SC) for the most part is ignored or misunderstood. We hope to change a few perceptions along the way by shining a light on EM SC as potential ground for adding alpha.

Added value

Before we begin to answer “What’s the deal with EM small caps…” let’s look at how MSCI EM SC has performed compared to its all-cap counterpart, MSCI EM. As seen below, whether on a three year, five year, 10 year or 20 year period, the MSCI EM SC index adds value compared to its all-cap counterpart. At the start of 2023, as we possibly enter a prolonged period of higher inflation and interest rates, we expect small caps to outperform by leveraging the flexibility and nimbleness that comes with smaller size and lower bureaucracy.

% Annualized USD Returns

3 yr5 yr10 yr20 yr
MSCI EM SC5.38%1.32%3.45%9.60%
MSCI EM-2.42%-1.10%1.77%9.04%
Source – Bloomberg. As on 30 Dec 2022.

A big stage

The reasons for its relative outperformance are many. Let’s start off with the fact that the EM SC universe is vast, with plenty of space to find the next big compounder among 11,000 companies, 24 countries and 11 sectors. The benchmark index – MSCI EM SC (MXEFSC) – is constructed with no index weight bias. Also, except for Taiwan, there is no sector bias among the big countries that constitute the index. This size and diversity mean that the EM SC universe offers plenty of scope for portfolio diversification and alpha generation.

Low to no coverage

With big size comes lack of proper coverage. This universe’s vastness, combined with liquidity constraints, means this asset class doesn’t get extensive coverage, despite the value it has added historically. We see under coverage from both the buy side and sell side. This lends perfectly to our process at Global Alpha where we put in the hard yards to travel, meet management in person, and understand local business customs to stay on top of the story.

Analyst Coverage Comparison

Bar chart comparing MSCI EM & MSCI EM SC for analyst coverage, with EM SC being more than twice as much as EM when less than 10.
Source – Bloomberg. As on 30 Dec 2022

Less sino-centric

China dominates the large cap index – making up over 30% of the benchmark – while making up just around 10% of the small cap index,as seen in the graph below. The more balanced construction of the EM SC index helps investors avoid the policy and geopolitical risk that comes with concentrated exposure to a single market. At the same time, this differentiated exposure is a good complement in terms of total portfolio diversification.

EM Index Composition

Bar chart comparing MSCI EM & MSCI EM SC for EM Index Composition, with EM more than twice as much in China, and EM SC higher in India, Taiwan, South Korea, Brazil, and others.
Source – Bloomberg. As on 30 Dec 2022

Tailwinds

After decades of globalization, the pandemic exposed the fragility of the global supply chain system. De- globalization, near shoring and a greater reliance on domestic consumption as an engine of growth could come to define the next decade. EM small caps have greater exposure to consumer-facing sectors like healthcare, industrials, and discretionary and lesser exposure to global cyclicals like IT and energy compared to its all-cap peer.

MSCI EM

Source – Bloomberg. As on 30 Dec 2022

MSCI EM SC

Source – Bloomberg. As on 30 Dec 2022

SOE’s are minor actors

The EM SC benchmark has a lower allocation to State-Owned Enterprises (SOEs) than its large cap counterpart. Our experience informs us that SOEs are the same regardless of the country in which they are domiciled. They suffer from:

  • poor capital allocation,
  • lack of alignment of incentives,
  • slow pace of decision making, and
  • a track record of poor shareholder returns.

On the flip side, many of our small cap names need to be nimble and innovative to survive. Experience has shown that first generation entrepreneurs with skin in the game and properly aligned incentives tend to create shareholder value in the long run.

Being active

Emerging markets is a space where portfolios can look different from benchmarks. Research confirms that the average active share in this space has historically been close to 70%* and that there is a positive and significant relationship between active share and fund performance. Further, being consistently active is a strong predictor of fund performance. In other words, managers who back themselves on their ability to outperform by maintaining a high level of active share do well in the long run.

As we travel around the world, we are also seeing a generational shift in thinking among many of our family-owned companies. There is an openness among them to hire professional management. We also see a willingness to enhance corporate governance standards, and a better appreciation of what constitutes good capital allocation. While we don’t underestimate the challenge of finding the next HDFC Bank or TSMC, we feel the EM SC space offers the best playing field to generate value for our clients in the long run. And in our mind, that’s a big deal.

*Based on 67 emerging market funds that use MSCI Emerging Market Index as their benchmark. Active share is defined as percentage of holdings in a portfolio that differs from its benchmark.

High inflation resulted in poor equity market performance in 2022 despite economic / earnings growth. Inflation relief in 2023 may limit further market weakness despite a global recession.

Absent shocks, economic momentum usually reflects real money trends six to 12 months earlier. Global six-month real narrow money momentum turned negative in March 2022, reaching a low in June before recovering slightly into November – see chart 1. This suggests that economic weakness will intensify in early 2023, with no monetary signal yet of a subsequent meaningful rebound. 

Chart 1

Chart 1 showing Global Manufacturing PMI New Orders & G7 + E7 Real Narrow Money (% 6m)

Real money contraction is fastest in the housing bubble / bust economies of New Zealand, Sweden and Canada, although the UK, Eurozone and US are only slightly behind – chart 2. China and Japan are positive outliers, suggesting less unfavourable prospects.

Chart 2

Chart 2 showing Real Narrow Money (% 6m)

Hopes are high that China’s covid policy U-turn will lead to a V-shaped economic recovery, as occurred in G7 economies post reopenings. Strong G7 rebounds, however, followed a surge in money growth. Chinese real narrow money expansion is still modest by historical standards and a rise in money rates in late 2002 may indicate less expansionary PBoC policy, possibly reflecting concern about inflationary effects of rapid reopening. 

Still-negative global real narrow money momentum indicates that a Chinese economic pick-up won’t offset recessions elsewhere. Forecasts of China-driven strength in commodity prices, therefore, are suspect. Additional weakness is more likely, based on an accelerating downswing in the global stockbuilding cycle, a key driver of commodity prices historically – chart 3. 

Chart 3

Chart 3 showing G7 Stockbuilding as % of GDP (yoy change) & Industrial Commodity Prices (% yoy)

The 2021-22 inflation surge was a consequence of central banks applying record monetary stimulus in 2020 as the stockbuilding cycle was tracing out an extreme low. Monetary fuel supercharged the usual cyclical rise in commodity prices. 

The monetary backdrop, like the status of the stockbuilding cycle, is now the opposite of 2020. G7 annual broad money growth crashed to 2.0% in November, below a pre-pandemic (i.e. 2015-19) average of 4.5% and down from a February 2021 peak of 17.3% – chart 4. The monetarist understanding of a roughly two-year lead implies an inflation crash from early 2023. 

Chart 4

Chart 4 showing G7 Consumer Prices & Broad Money (% yoy)

The latest trends, indeed, suggest rising medium-term deflation risk. G7 broad money contracted marginally in the three months to November. Bank loan growth to the private sector had been providing support but is now slowing as higher rates curb mortgage demand and corporate borrowing needs moderate with the stockbuilding downswing. 

The weak economic outlook is, according to the monetarist view, of limited relevance for assessing equity market prospects, which will hinge instead on “excess” money developments.

Two global excess money proxies are followed here: the gap between six-month real narrow money and industrial output momentum; and the deviation of 12-month real money momentum from a long-term moving average. The first indicator turned negative in December 2021 (allowing for data reporting lags), with the second following in February 2022. Historically (i.e. over 1970-2021), global equities underperformed cash by 8.9% pa on average when both were negative. The underperformance between end-February and end-December 2022 was larger, at 14.9% pa. 

As noted earlier, six-month real narrow money momentum has recovered slightly from a June low. Industrial output momentum, meanwhile, is estimated to have turned negative at end-2022, with further weakness likely. A cross-over, therefore, appears imminent and may even have occurred in December – chart 5. Allowing for the data reporting lag, a December cross-over would imply a shift in sign of the first indicator from positive to negative from end-February. 

Chart 5

Chart 5 showing G7 + E7 Industrial Output & Real Narrow Money (% 6m)

The second indicator – the deviation of 12-month real money momentum from a moving average – is heavily negative and unlikely to turn positive before mid-2023 at the earliest. 

The expected combination of positive and negative readings of the first and second indicators respectively was historically associated with equities underperforming cash by an average 4.5% pa, suggesting retaining a cautious investment stance.

The combination could result in significant sector / style rotation: tech, quality and growth outperformed on average with value and energy underperforming. Non-energy defensive sectors would be expected to continue to outperform non-tech cyclicals. EM equities outperformed developed markets on average.

The suggestion of a reversal of growth underperformance in 2022 is consistent with indications that Treasury yields will decline during 2023 – surging yields contributed to the derating of growth stocks last year.

Equity markets are bullish or bearish depending on whether excess money is positive or negative. Bond markets, by contrast, are sensitive to the rate of change of excess money, rather than its sign. Changes in US real Treasury yields have been inversely correlated with changes in the first excess money measure historically, i.e. yields have fallen when the measure has risen, even while still negative – chart 6. The current / expected improvement in the measure, therefore, suggests an extension of the recent yield decline.

Chart 6

Chart 6 showing US Real 10y Treasury Yield (6m change)

Treasury yields, in addition, usually move down into a low around the same time as the stockbuilding cycle trough – chart 7. Based on the average cycle length of 3 1/3 years, the next low could occur in Q3 or Q4.

Chart 7

Chart 7 showing G7 Stockbuilding as % of GDP (yoy change) & US 10y Treasury Yield

A fall in Treasury yields requires a Fed policy “pivot” but this could be imminent. Chart 8 shows the estimated probability of the Fed tightening policy in a particular month based on the latest data on core inflation, unemployment and supply bottlenecks. The probability estimate fell from 100% in October to 80% in December and currently stands at 75% for the FOMC meeting on 31 January / 1 February, consistent with market speculation of a step down from a 50 to 25 bp hike.

Chart 8

Chart 8 showing US Fed Funds Rate & Fed Policy Direction Probability Indicator

Based on the FOMC’s December median projections, the probability of tightening is forecast to fall below 50% in Q2 and below 10% in Q3. This outlook is consistent with the Fed shifting to an easing bias in Q2 and starting to cut rates in Q3.

Silhouette of working oil pumps on sunset background.

Anyone who’s kept an eye on the markets is aware that the energy sector had a blowout performance in 2022. It started with the war between Russia and Ukraine in February that spiked oil and gas prices, the discussion then shifted to European LNG supply for the following winter, including which countries would be able to absorb Russia’s excess oil supply. Clearly, the energy resurgence in 2022 was a European-driven one.

With that in mind, what is the situation going into 2023? It appears that the worst-case scenario for this European winter has been avoided. Natural gas prices are now back at the pre-Ukraine invasion level, EU gas storage is sitting a comfortable 5% above its five-year trend, and winter weather has been lenient so far.

European Union gas storage levels, 2017 – November 2022

Source: IEA, European Union gas storage levels, 2017-November 2022, IEA, Paris https://www.iea.org/data-and-statistics/charts/european-union-gas-storage-levels-2017-november-2022, IEA. Licence: CC BY 4.0

Governments are now focusing on planning for next winter, and the data points are more mixed. In 2022, Europe benefitted strongly from having Russian LNG flow for most of the summer and from lower LNG demand from China. Both things are unlikely to repeat in 2023. Indeed, a worst-case scenario, where Russian pipelines stop flowing completely for 2023, would represent a gap of nearly 50% of total gas storage requirements for the winter of 2023/24. And there are not many options for Europe to fill this gap elsewhere. Indeed, China’s 2023 LNG imports are expected to reach 2021 levels, which would capture over 85% of the estimated increase in 2023 LNG global supply, with much of that increase already contracted by China.

The market however does not appear to be discounting this. December 2023 futures contract for LNG is sitting around €70 per MWh, three times pre-2021 levels but well below the peak of €345 seen in August. There are certainly some indicators that support this optimism. Between August and November 2022, EU natural gas consumption dropped 20.1%, well above the government self-imposed target of 15% for the period between August 2022 and March 2023. Finland reduced its consumption by as much as 52%. Many countries capped the price for consumers and businesses. These lower prices should help alleviate the size of deficits generated from these programs, allowing those countries to face next winter with a healthier balance sheet. Furthermore, the weather for the rest of the winter will be a key driver of the requirements for next year, as estimates for gas storage levels at the end of the heating season vary between 5 and 35% of full capacity. Clearly it is too soon to predict a worst-case scenario, and Global Alpha does not expect a worst-case scenario to materialize. But the pain is likely to be felt more than markets currently discount.

At Global Alpha we have historically underweighted energy in our portfolios, not because of any macro views, but instead because the team consistently found better stock picking opportunities elsewhere. Indeed, pure oil and gas stocks are often at odds with Global Alpha’s investment philosophy: the quality of their balance sheet is volatile, they depend on macroeconomic factors to outperform, and as such tend to be more momentum based.

So how does Global Alpha get its energy exposure? An example of a name we have owned for many years is Schoeller Bleckmann Oilfield Equipment AG (SBO VIE). The company is the global market leader for high precision drilling components, providing nonmagnetic drill string components to directional drilling oil field service companies. Headquartered in Austria, more than 80% of its business is done in the U.S. and Europe, with high profile clients such as Schlumberger, Halliburton, and Baker Hughes.

With a healthy balance sheet and key market positioning backed by proprietary technologies, Schoeller-Bleckmann provides an attractive exposure to energy prices without being dependent on a few oil and gas projects. Indeed, its stock price has benefited from the pick-up in rig counts since mid-2021, with the firm boasting a book-to-bill ratio consistently above 1x, while at the same time showing its ability to pass on cost inflation to clients. There have also been discussions of green energy diversification, though the strategy remains unclear for now.

SWOT analysis

Strengths

  • +50% market share in most of its products
  • Strong balance sheet supported by low net debt

Weaknesses

  • Dependence on the big three oil services companies

Opportunities

  • Increased geographical diversification
  • Opportunistic M&A

Threats

  • Technological competition in their key plug market
  • Loss of market share in the U.S.

Schoeller-Bleckmann is a perfect example of the type of quality names Global Alpha is looking for in its portfolios: a niche, market leader with global exposure and a clean balance sheet that allows for sustained growth.

Image of human hand stacking generic coins over a black background with hexagonal golden shapes. Concept of investment management and portfolio diversification.

As discussed recently, inflation will be supported by low unemployment in 2023. This could be described as a classic inflation gap, as we expect a wave of salary adjustments persisting well into 2023.

Many important factors will keep unemployment at low levels. These include:

  • Demographics, especially in the U.S. where more and more Baby Boomers are accelerating their exit from the workforce, following a difficult COVID period.
  • Many developed countries halted immigration during COVID, causing backlogs compared to normal intakes.
  • Long COVID among many workers has been keeping them out of the workforce for lengthy durations.

As economic data comes out, high interest rates are beginning to affect the economy, as reported by the recent consumer price index (CPI) report. Weakening demand mixed with higher costs will weigh on corporate profits in 2023. The good news is Global and EAFE Small Cap valuations are at their lowest since the 2008-2011 period. These low valuations could provide stock price support as corporations reduce their profit guidance. As well, sentiment is at multi-year low and can only improve.

So, where to position in an economic downturn? Warren Buffet once famously asked, “What was the most popular chocolate bar in 1962?” Snickers, he answered. And what was the most popular chocolate bar in 2020? Snickers. Focus on what is resilient is the moral of this story.

The second anchor in a downturn is balance sheet strength as interest expense for many corporations start to rise. Recent Federal Reserve statements forecast a lengthy period of elevated interest rates. And the recent Carvana debt debacle will not be the only one. We certainly feel that many companies and analysts are too conservative in their medium-term (i.e., two year) interest rate outlook.

A third anchor relies on themes and long-term positive industry trends. Stocks with high exposure to critical, well-supported trends (renewables or onshoring, for example) will certainly help weather markets suffering from consumer demand decelerations.

Our portfolio companies hold substantial net cash war chests, and they have important M&A growth options during a slowdown. Let’s have a closer look at some holdings.

Several of our firms have net cash as a percentage of their market cap at a level greater than 10%. These include: Mabuchi Motor Co., Ltd. (37%), LINTEC Corp. (28%), SEGA SAMMY Holdings Inc. (17%), THK Co., Ltd. (12%), and Globus Medical, Inc. (11%). In addition, Ain Holdings Inc., Sakata Seed Corp. and Daiseki Co., Ltd. are all at 10%. This is only a short list of holdings at or above the 10% mark. Many of our companies have simply no debt.

What is even more reassuring is that a variety of tailwinds benefit our holdings. Let’s take SEGA SAMMY (6460 JT) for example. The Japanese gaming provider has transformed into an integrated entertainment powerhouse. Born from gaming, Sega’s Sonic the Hedgehog brand has been featured in movies, including a recently launched Netflix animated series. Additionally, the entertainment company’s newest 3D Sonic game, Sonic Frontiers, has sold more than 2.5 million copies worldwide since its launch in early November.  

Mabuchi Motor (6592 JT), the leading small motor provider out of Japan, is flush with cash and has no requirement of large expansion capex. Small motors are growing faster than many industrial markets due to increased demand for robotics. Moreover, the market in which Mabuchi operates is highly fragmented. The company can certainly use its cash for highly accretive acquisitions in the future.

At 11% net cash, Globus Medical is a quality anomaly in the medical technology world. The U.S.-based provider of orthopedic devices and robots is clearly a technology leader. Its surgical robots increase productivity four-fold in terms of successful back surgeries. As the company will ultimately see a peak penetration for its robots, it will be in a strong position to accelerate new innovations either by development or acquisitions.

Many of our companies demonstrate three key attributes:

  • product resilience,
  • positive tailwinds, and
  • balance sheet strength.

Product resilience can come in many forms and can be found in types of business models: Software as a Service (SaaS), maintenance services, and long-term fixed agreements, just to name a few. Global Alpha initiated in Reliance Worldwide Inc. (RWC AU). The Australian company is a leading provider of emergency plumbing equipment sold through global retailers such as Home Depot and Lowes. Reliance Worldwide’s sales performed well during the 2009 real estate collapse, and we feel its sales will hold up equally well in current market conditions.

Net cash is not the only way to uncover balance sheet strength. One of our holdings, Meliá Hotels International (MEL SM), recently went through an asset valuation analysis with CBRE. The Spanish hotel owner and operator is presently benefiting from strong volumes from its quality portfolio of hotels. The CBRE valuation of real estate assets came in at € 4 billion. This is against a debt level of € 1.3 billion and a market cap of € 1.1 billion.


In mid-October 2022, after more than 2.5 years of strict border control measures, Taiwan lifted all its COVID entry restrictions and allowed foreigners free access. As countries returned to their pre-pandemic routine, Taiwan was among the laggards (along with China and Hong Kong) in loosening requirements for visitors to complete a mandatory lengthy quarantine. That is why we welcomed (to say the least) the announcement of easing travel restrictions. And after two weeks of preparation, we landed in Taoyuan International Airport at the beginning of November.

Except for the requirement to wear a mask in all public places including outdoors, lifted only on December 1, life in Taipei looked normal. There was strong traffic in malls, convenience stores, hotels and restaurants. Over the span of a week, we met with 28 corporates engaged in the information technology, consumer, healthcare and industrial sectors.

Our general impression was mixed, with more optimism around healthcare and consumer-oriented companies balanced by a more cautious outlook provided by the technology operators. Overall, most corporates noted quite low visibility going into 2023, with only a handful of companies ready to provide guidance for the next year.

Key takeaways from our meetings:

  • Strong domestic consumption recovery after the reopening in Taiwan.
  • Most of the semiconductor companies are in the midst of weak momentum due to slow demand for consumer electronics and inventory corrections. PC and handset unit sales are expected to decline in 2023.
  • Data servers, automotive and industrial remain the only bright spots for now. The U.S. hyperscaler server market is expected to continue growing at a double-digit rate in 2023, although global enterprise and China server demand are expected to remain weak. Demand for ASIC (application-specific integrated circuit) design remains strong, as does demand for the ABF (Ajinomoto build-up film) substrate despite a correction in the PC market.
  • The impacts so far of U.S. sanctions on the Chinese semiconductor space are limited on Taiwan semiconductor companies because the new rules target only the most advanced technology, and most Chinese IC (integrated circuit) designers are making changes to fall within key thresholds of those sanctions. Moreover, some companies aim to reap benefits on lower competition with Chinese peers in the long term. However, there is a risk of further escalation in U.S.-China relationships, which could disrupt global technology supply chains and impact demand in 2023.
  • Many technology companies pointed out an increased need to de-risk their production facility locations following their customers’ requests for production capacities outside of both China and Taiwan.
  • General supply chain normalization, with remaining tightness in the supply of some key components.

Taiwan is the second largest market for our Emerging Markets strategy (behind India), with about 20% weight in the MSCI EM Small Cap index. It is the only country in the EM universe with a clear sector bias, as information technology accounts for more than half of the country weight in the benchmark. In the first 10 months of the year, Taiwan Small Cap underperformed the EM benchmark by more than 10%, a result mostly driven by derating of the technology sector. However, its performance in November looks like the beginning of a year-end rally on the expectations of semiconductor inventory correction bottoming. Likewise, moderating geopolitical risk may ease following the results of local mayoral elections on November 26, in which the Kuomintang, a party taking a more moderate stance on China, scored a big win over the incumbent Democratic Progressive Party.

Although we remain cautious on the technology inventory correction cycle, as there are multiple risks that might delay the sector recovery (e.g., deep recession in the U.S. and Europe, and broader geopolitical escalation), we acknowledge that some of the corporates in Taiwan are progressing well ahead of their peers. Most of market participants expect that a cyclical bottom in semiconductor demand might occur in the first half of 2023, with sequential improvement starting in the second half of 2023. This could drive a strong recovery in technology stocks. The importance of understanding inventory cycles was discussed in our note published on March 13, 2009. We see similar patterns here and remain alert to understanding where we are in the cycle.

Our EM portfolio is currently in a market-neutral position in Taiwan. We have a balanced roster of technology leaders, dominant operators catering to domestic markets, and exporters benefiting from secular tailwinds.

Here is a description of a sample of our holdings in Taiwan.

Chroma ATE Inc. (2360 TT) is a power and semiconductor testing equipment provider enjoying a leading position among the top-five global IC testers. For instance, NVIDIA uses Chroma testing equipment for all its products. Chroma also enjoys strong growth momentum in the electric vehicle (“EV”) industry. The company is one of the few operators in the technology sector that is less susceptible to industry cyclicality, and it has better visibility into the longer-term growth trajectory of the semiconductor industry.

Universal Vision Biotechnology Co., Ltd. (3218 TT) is the largest ophthalmology chain in Taiwan. The firm offers various eye treatments and related medical services such as laser vision correction and cataract surgeries. It is the leading brand in Taiwan, backed by a 30-year track record of high-quality services and innovation, with a dominant position in advanced eye surgeries such as SMILE (Small Incision Lenticule Extraction) and FLAC (Femtosecond Laser Assisted Cataract Surgery). The company also sells optometry products such as eyeglasses, contact lenses, and orthokeratology lenses at its self-operated eyewear stores. Benefiting from structural demographic tailwinds in Taiwan – due to high prevalence of myopia in the population – UVB is also a beneficiary of China’s COVID reopening, where it derives 25% of revenue. Following the recent easing of COVID restrictions, the company is looking to accelerate clinic openings in China.

Makalot Industrial Co., Ltd. (1477 TT) is one of the major global apparel manufacturing companies with industry- leading design flexibility, lead times, product offering and scale. We believe it is one of the main beneficiaries of the supply chain consolidation trend due to its diversified production sites, aggressive expansion in Indonesia and Bangladesh, and ability to deliver rush orders.

U.S. flag and Wall street sign in Manhattan's financial district.

As we write this commentary, stock markets around the world have been staging a spectacular rebound over the last few weeks. Many are now in a bull market, meaning they are up more than 20% since the last bottom.

How to explain such optimism when inflation remains stubbornly high, central bank rates are still rising, the war in Ukraine rages on, and China is still committed to a COVID-zero policy?

In the last few weeks, we attended numerous small cap conferences in the U.S., Japan, the UK, Norway, France, Taiwan and Vietnam to further research that optimism. In all, we met over 100 companies and attended various industry and thematic panels.

There were a lot of takeaways from these meetings, and in this week’s commentary we will focus on the U.S.

  • A majority of companies indicated they will continue to raise prices in 2023 to offset continued inflationary pressures. For example, cement companies expect cement prices to go up 12% in 2023. Residential housing may be down, but infrastructure spending – turbocharged by the Inflation Reduction Act – will more than offset this decline. John Deere just announced equipment prices will go up 11% in 2023. Meanwhile, agricultural prices remain high and farm income is near a record, boosting demand. New car prices will go up double digits.
  • Companies expect to increase salaries in 2023 by more than they did in 2022, with the general expectation that wage inflation will be between 5-10%. As a possible indication of things to come, four freight rail unions – with a combined membership of close to 60,000 rail workers – recently voted down the five-year contract agreement brokered by the Biden administration back in September. The rejected deal would have given workers a 24% raise over five years and an average immediate payout of $16,000 in back raises and bonuses. As we write this comment, Amazon workers in more than 40 countries are staging walk-off protests with the slogan “Make Amazon Pay.”
  • Demand remains strong. Although some weakening has been felt since the latter part of November, the latest economic indicators seem to reflect a resilient economy that is still growing. For example, the Empire Manufacturing Survey came in at 4.5 compared to expectations of -5.0, indicating positive expansion. This follows -9.1 in October. Durable goods orders were very strong. Of note, retail sales were solidly positive – accelerating from the prior month – and new home sales were stronger than expected. As well, jobless claims remain below the pre-pandemic levels. In the hotel sector alone, more than 200,000 positions remain vacant.

Does the stock market believe in a soft-landing scenario? Maybe. But it is now convinced that the Fed will pause its interest rate hiking cycle and may even lower rates in 2023! The consensus right now is that inflation will continue to go down and should end next year at around 3.5%. Interest rates will continue going up but should peak around 4.5 to 5% by mid-2023, and may start coming down by the end of 2023.

Our scenario is very different.

We believe inflation at the end of 2023 will still be at 5% or above. Why?

As indicated above, wages will rise more than 5% and rent increases will continue to exceed 5%. Meanwhile, commodities – after relatively easy year-over-year comparisons in the early part of 2023 – will start going up again towards mid-2023. Metal prices are already going up, as are natural gas prices. Food prices will continue going up, and insurance prices are poised to explode in 2023. 

Facing such inflation, and at the risk of losing its already low credibility, the Fed will continue raising rates. How high? We believe the only way to break the inflation expectation, which is what the Fed is focused on, is to see slack in the labour market. That probably means an unemployment rate above 6%. We are far from that level.

The Fed also needs to see home prices decline 20% or more. Yet despite price declines in the last few months, home prices were still up year over year at the end of October.

In other words, the market is too optimistic.

The rally is also explained by seasonal effect and oversold conditions. This rally, however, has been of poor quality, similar to what we saw in the summer of 2020. Unprofitable companies with weak balance sheets have been the best performers.

We knew that we might trail the market performance this fall and maybe even into early 2023. However, our portfolio is well-positioned for a more difficult environment in 2023, in which we will see much lower economic activity and possibly even a recession combined with higher interest rates.

Towards the end of the first quarter of 2023, we expect to see a rotation to higher-quality companies with little to no debt and the ability to gain market share.