Identifier : Actions internationales
Global industrial output has flatlined since early 2021, reflecting supply disruptions but also a loss of demand momentum. Output may recover into 2022 as supply problems ease but money trends signal a further weakening of underlying momentum. Second-round inflation effects, meanwhile, may force central banks to bring forward plans for stimulus withdrawal – unless markets weaken sharply. This backdrop suggests retaining a cautious investment strategy unless money trends rebound in late 2021 – possible but not a central scenario.
The ”monetarist” forecasting approach used here relies on the rules of thumb that 1) real narrow money growth directionally leads demand / output growth by 6-12 months (average 9 months) and 2) nominal broad money growth directionally leads inflation by 1-3 years (average 2+ years). Global narrow / broad money growth surged in 2020 but has slowed this year. This slowdown is being reflected in a loss of economic momentum but the inflationary impact of the 2020 bulge will continue well into 2022. Current “stagflation” concerns, therefore, are likely to persist.
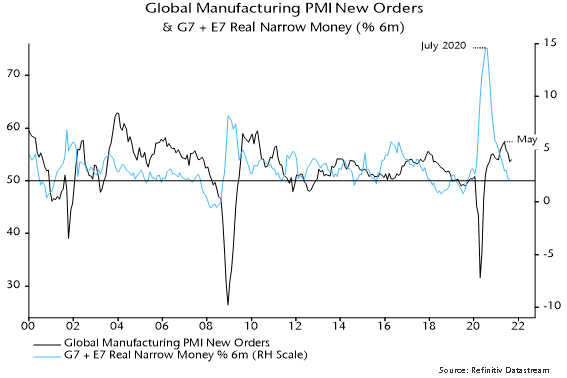
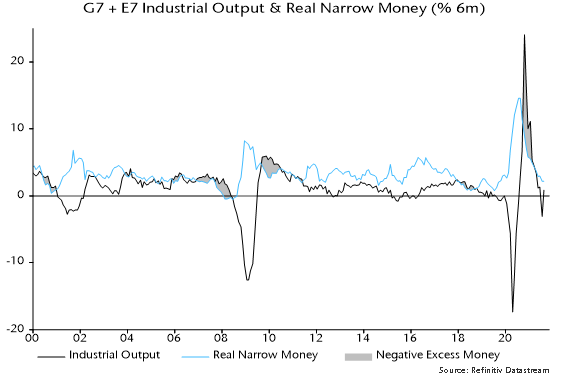
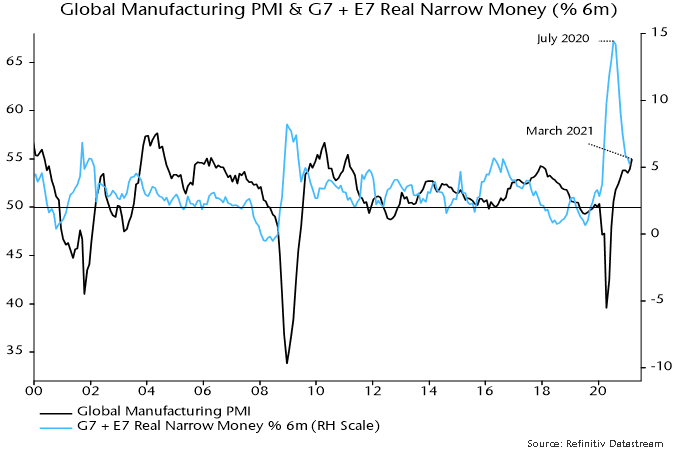
Supply chain disruption is distorting economic data, complicating analysis. The presumption here is that the global manufacturing PMI new orders index is a reasonable guide to underlying industrial demand momentum. The index has fallen since May, mirroring an earlier decline in global (i.e. G7 plus E7) six-month real narrow money growth from a July 2020 peak – see chart 1. With real money growth sliding further into July / August 2021, the suggestion is that the PMI new orders index is unlikely to reach a bottom before early 2022.
Chart 1
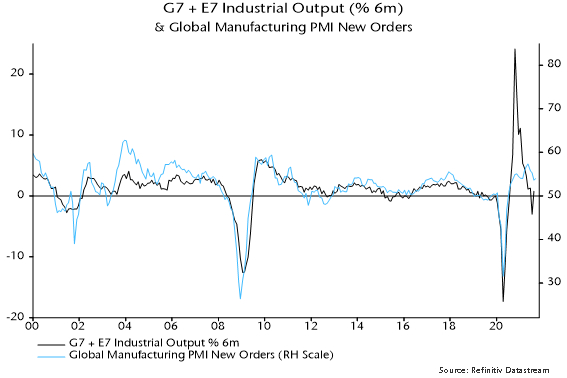
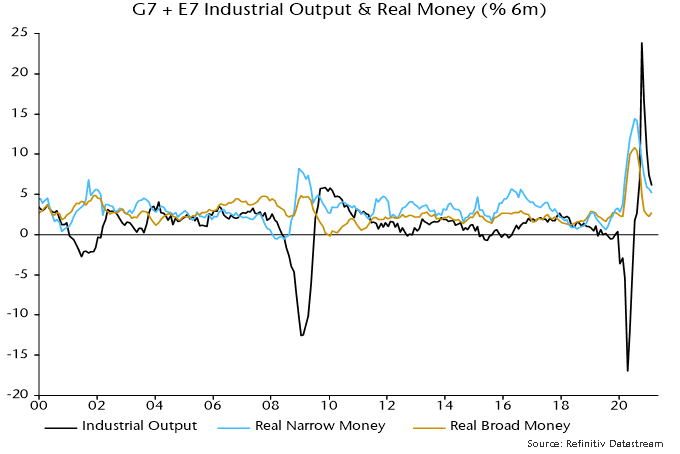
Supply chain disruption, however, has resulted in a substantial undershoot of industrial output relative to the growth rate suggested by the PMI new orders index, implying scope for a short-term catch-up – chart 2. Market participants could wrongly interpret such a pick-up as a reversal in trend momentum. Confusing signals could lead to greater market volatility but any revival in the cyclical / reflation trade is likely to be short-lived unless monetary trends – and hence PMI prospects – improve.
Chart 2
The approach here uses cycle analysis to cross-check monetary signals and provide longer-term context. The 3-5 year stockbuilding and 7-11 year business investment cycles are judged to have bottomed in Q2 2020 and are currently providing a tailwind to the global economy, cushioning the impact of less expansionary monetary conditions.
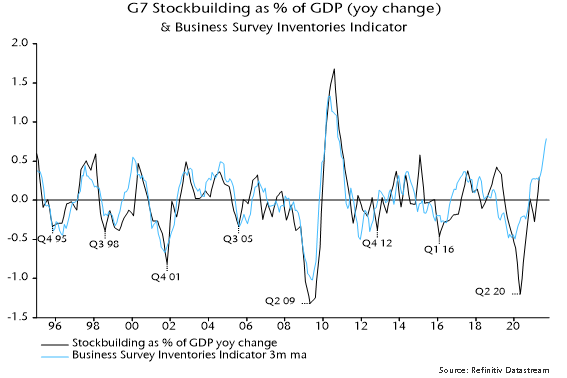
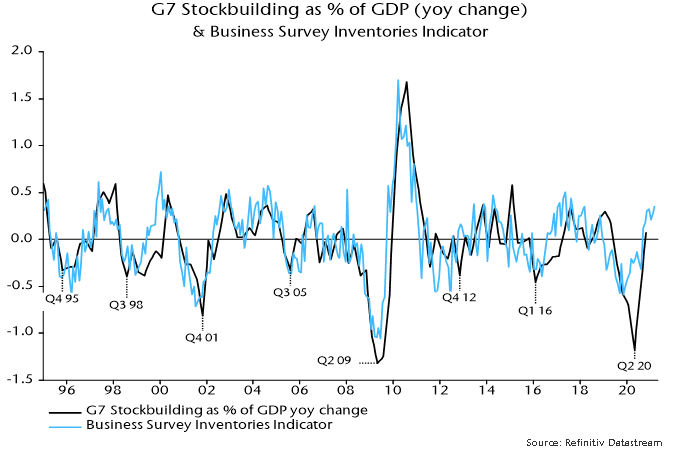
The next cyclical “event” will be a peak and downswing in the stockbuilding cycle. Based on its average historical length of 3 1/3 years, the next cycle low could occur in H2 2023, implying a peak by H2 2022 at the latest. The business survey inventories indicator calculated here, however, suggests that the cycle upswing is already well-advanced, hinting at an early peak – chart 3.
Chart 3
The upshot is that monetary trends suggest a slowdown in global economic momentum through early 2022 while the stockbuilding cycle is likely to act as a drag from H2 2022. This leaves open the possibility of a resumption of strong economic growth in a 2-3 quarter window around mid-2022. An immediate rebound in global real narrow money growth, however, is needed to validate this scenario.
Such a rebound is possible despite the Fed and other central banks moving to wind down stimulus. It could be driven, for example, by Chinese policy easing to support a weak economy, a sharp reversal in commodity prices as industrial momentum softens (boosting real money growth via a near-term inflation slowdown) or a pick-up in bank lending (normal at this stage of stockbuilding / business investment cycle upswings). It is, however, unnecessary to speculate – it is usually sufficient for forecasting purposes to respond to monetary signals rather than try to anticipate them.
Chart 4 shows a breakdown of G7 plus E7 six-month real narrow money growth. Earlier US relative strength / Chinese weakness has been reflected in divergent year-to-date equity market performance, with DM ex. US and EM ex. China indices charting a middle course. A recent cross-over of US real money growth below the G7 ex. US average suggests reducing US exposure in favour of other developed markets.
Chart 4
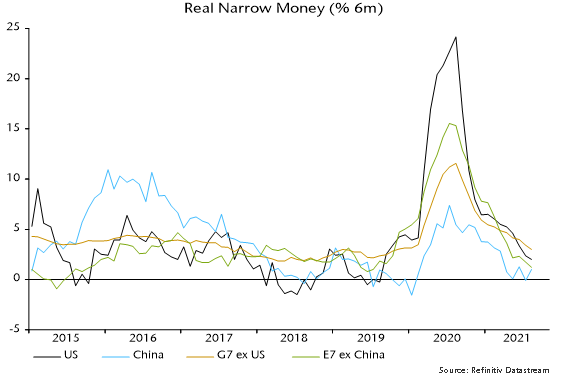
Chinese real money growth, meanwhile, was showing signs of bottoming before the recent escalation of financial difficulties at property developer Evergrande. This could result in faster policy easing, an “endogenous” tightening of credit conditions, or both. The net monetary impact is uncertain but a recovery in money growth in late 2021 would argue for adding Chinese exposure in global and EM portfolios despite likely further weakness in economic data.
Investors continue to debate whether high inflation is “transitory” as central bankers naturally assert. The monetarist view is straightforward: the roughly 2-year transmission of money to prices implies no significant inflation relief before H2 2022, while a return to pre-covid levels requires a further slowdown in global broad money growth.
Inflation drivers are likely to shift, with energy and other industrial commodity prices cooling as the global economy slows but offsetting upward impulses from food, rents and accelerating unit wage costs as labour shortages and mismatches force pay rises above productivity growth.
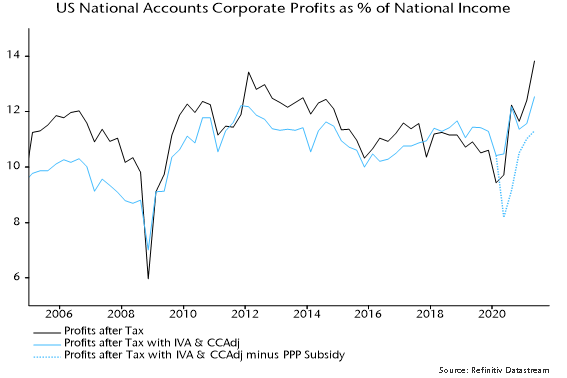
Rising labour costs could, in theory, be absorbed by a reduction in profit margins rather than being passed on in prices. Recent profits numbers, however, overstate underlying health because of stock appreciation and pandemic-related government support. The share in US national income of an “economic” measure of corporate profits (i.e. adjusted for inventory valuation effects and Paycheck Protection Program subsidies, and to reflect “true” depreciation) is in line with its average over 2010-19, in contrast to inflated book profits – chart 5.
Chart 5
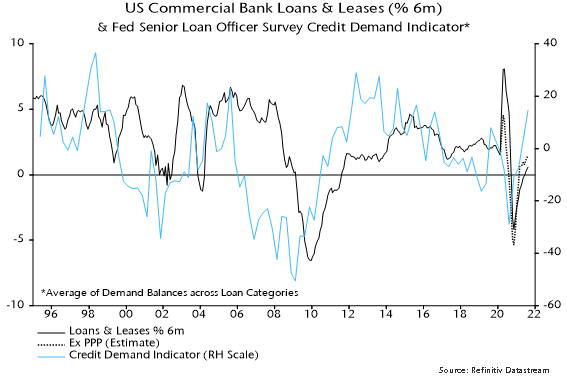
G7 annual broad money growth has fallen from a peak of 17.3% in February 2021 to 8.3% in August, with 3-month annualised growth at 6.2%. This is still high by pre-covid standards: annual growth averaged 4.5% over 2015-19. Reduced support to money growth from QE could be offset by faster expansion of bank balance sheets, reflecting strong capital / liquidity positions and rising credit demand. US commercial bank loans and leases have recently resumed growth, with the Fed’s senior loan officer survey suggesting a further pick-up – chart 6. The ECB’s lending survey is similarly upbeat.
Chart 6
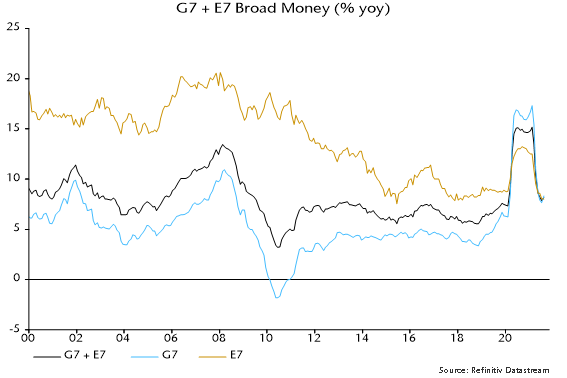
Adding in the E7, annual broad money growth is closer to the pre-covid level, at 8.2% in August versus a 2015-19 average of 6.4% – chart 7. Growth is below average in China, Mexico and Russia and in line in India. Inflationary pressures are more likely to prove “transitory” in these economies, suggesting support for local bond markets.
Chart 7
Global equities held up over the summer despite weaker activity news and upside inflation surprises. A monetarist explanation is that markets were supported by “excess” money, as supply disruptions contributed to global six-month industrial output growth falling below real narrow money growth – chart 8. A temporary output catch-up as supply problems ease could reverse this crossover – a further argument for maintaining a cautious investment stance emphasising defensive sectors and quality.
Chart 8
This year has started on strong footing for global mergers and acquisitions (M&A). According to Refinitiv, global M&A hit a new record of $1.3 trillion as of March 31st, 2021.[1] What is driving this boom? On the news we have seen many big deals take shape, from GE divesting its business to Canadian Pacific expanding its footprint. But behind the headlines, something else is accelerating M&A activities, especially in the Unites States (US). We are talking about SPAC, which alone represent about 25% of the total deal volume in the US.
The first quarter of this year was also one of the busiest for IPOs, of which, once again, SPACs took the limelight. There were 296 SPACs raising $87 billion, a 20-fold increase over the same period last year.
What is a SPAC?
A SPAC or “Special Purpose Acquisition Corporation” is a vehicle used to acquire a private company and make it public without going through the traditional IPO process. Back in the 1980s, there was something called a “blank check offering”. These were companies focused on finding promising operating enterprises — prospects that sounded great on brokers’ cold call pitches (typical “pump and dump” schemes). Fraud and manipulation was so rampant among these blank check companies, the SEC adopted Rule 419 under the Securities Act of 1933 , “requiring investors’ funds to be held in escrow, filing of a post-effective amendment upon execution of an acquisition agreement, and the return of the escrowed funds if an acquisition has not occurred within 18 months of the effective date of the initial registration statement.”.
David Nussbaum, a Long Island based lawyer and CEO of GKN Securities, understood the new rules would reduce interest from investors. So he reinvented the blank check concept in 1992, and SPACs were born. The SPAC structure allowed for trading, but included many provisions to protect investors — like allowing investors to opt out of the merged company and get their money back once a deal is done.
How do SPACs work?
First, a sponsor raises capital and incurs the cost of an IPO in a new shell company. To make the deal attractive to investors, the units are usually priced at $10 each and provide a warrant to buy more shares. The sponsor then has 12 to 24 months to find the target. If no target is found, or if the investors decide to vote “no” on the deal, the holders can redeem their investments.
We have seen this movie before
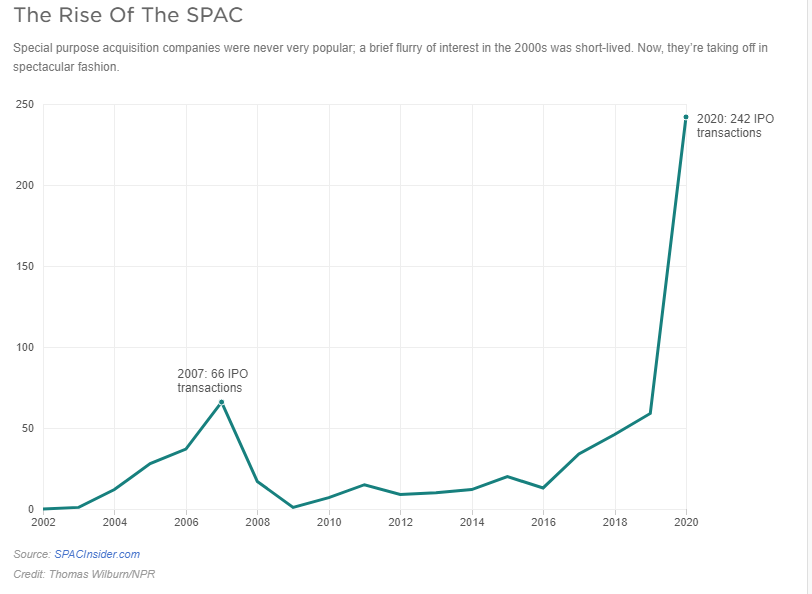
SPACs are in their third decade of existence. In the early 1990s, they were marketed as vehicles that helped small companies go public, while offering outsized favourable terms to their sponsors. In the late 90s, SPACs took a back seat. After all, why would a company do a reverse merger when you could easily raise money during the tech bubble? SPACs enjoyed a renaissance in late 2002, peaking at 66 IPOs just before the great financial crisis. They reappeared in early 2016, and have been going strong ever since. According to SPAC Analytics, in 2020, SPACs were 55% of IPOs, compared to 4% in 2013. So far this year, SPACs represent 79% of total IPOs.
SPACs versus a traditional IPO
SPACs are a pure genius way of going public. Since there is no identified target, a sponsor’s prospectus has no information about the business or the strategy. On the other hand, an IPO roadshow raises a lot of questions and invites a lot of scrutiny from investors.
In an IPO, there is no guarantee on the final valuation of the company. With a SPAC, the IPO has been done, and you have negotiated the valuation of your company with the sponsor. Plus the due diligence required for a merger is much less than SEC requirements for a regular IPO.
Cost could be another key factor. An IPO can cost anywhere between one to seven percent in fees for investment banks. With a SPAC, the underwriter may charge about five to six percent. However, there are other fees associated with the merger, which can end up being almost 20-25 percent of the total money the sponsor may raise.
Why are SPACs so popular?
A recent Wall Street Journal article counted 61 sports-related SPACs formed this year alone, compared to just five in 2019.[2] Athletes from Serena Williams, Stephen Curry, Naomi Osaka, Tony Hawk, Colin Kaepernick, and even Shaquille O’Neal, have shown interest in SPACs.
Everyone loves money, especially free money. SPAC founders and sponsors generally get about 20% of the shares of the SPAC as a fee for raising capital, finding the target, and, of course, giving it their brand name. Hedge Funds like it because they can use leverage to buy SPACs and also get preferential access to SPAC deals at the $10 share price. Everyone else has to wait and likely pay a higher price.
Most investors don’t read the annual reports of the companies they own, so they miss out on the fine print in the SPAC prospectus. For example, many are unaware of the lock-up period, which can be anywhere from six months to a year. Once the lock-up period is over, the floodgates open and add pressure to the stock price.
The clock is ticking?
SPACs don’t have time on their side because there is a limited window to close a deal. Targets are well aware of this restriction. They also know that a SPAC is required to spend at least 80% of its assets on a single deal. So the target always has the advantage. SPACs are paying a median price-to-sales ratio of 12.9, compared to 4.1 paid by other companies, according to 451 Research.[3]
SPAC-mania has been going on for a few years now, which means there is a lot of capital chasing deals, combined with ticking clock syndrome, which signals an inevitable decline in deal quality. We could easily see the SPAC bubble go bust once again.
How have SPACs performed historically?
A team of researchers analyzed completed mergers from January 2019 and June 2020, and found that SPACs lost 12% within the first six months, and dropped 35% on average after the first year. Bain & Co looked at 121 SPAC mergers from 2016 to 2020 and concluded that “more than 60% have lagged the S&P 500 since their merger dates, and 50% are trading down post-merger”. The other 40% are trading below the $10 IPO price.
Portfolio Impact
Regulators like the SEC are beginning to take a closer look at SPACs. SEC recently issued an investor alert pointing out that just because celebrities are backing SPACs doesn’t mean retail investors should follow suit.
At Global Alpha, we do not invest in SPACs. Our focus is on finding high-quality companies with defensible business models and strong balance sheets that should outperform the small-cap benchmark.
[1] https://news.yahoo.com/deal-making-smashed-records-q1-141243172.html
[2] https://www.wsj.com/articles/the-celebrities-from-serena-williams-to-a-rod-fueling-the-spac-boom-11615973578
[3] https://usa-latestnews.com/technology/with-valuations-on-us-startups-skyrocketing-spacs-are-starting-to-shop-overseas/
The assessment in the previous quarterly commentary was that the monetary backdrop for markets had deteriorated at end-2020. This was arguably reflected in weak bond market performance during Q1 but global equities rose further as earnings expectations were revised higher. The monetary indicators followed here continue to give a cautionary message for markets while suggesting that global industrial momentum will slow into late Q3. A summer growth “scare” could trigger a correction in equities and a recovery in defensive sectors.
The market assessment relies on two indicators of “excess” money, which, according to the “monetarist” view, is a key influence on demand for financial assets: the difference between global six-month real narrow money and industrial output growth, and the deviation of 12-month real money growth from a long-term moving average. The entire outperformance of global equities relative to US dollar cash since 1970 occurred during periods when both indicators were positive. Equities underperformed cash on average when either or both were negative.
Allowing for data publication lags, the indicators gave a joint positive signal at end-April 2020. The MSCI All Country World Index (ACWI) returned 33.9% in US dollar terms between then and end-2020, reflecting both a recovery in earnings expectations and a rerating of markets. The “buy” signal, however, was rescinded at end-December following a cross-over of real narrow money growth beneath industrial output growth – see chart 1.
Chart 1
Global equities derated during Q1 – the ACWI 12-month-forward PE ratio fell by 4.2% – but the index nevertheless returned 4.7% as forecast earnings rose by a further 8.6%. Earnings optimism was boosted by confirmation of additional large-scale US fiscal stimulus, which also contributed to continued outperformance of cyclical sectors. The view here, however, is that global industrial momentum is peaking and will slow through late 2021. This would be a shock to the consensus and could trigger an unravelling of recent market trends.
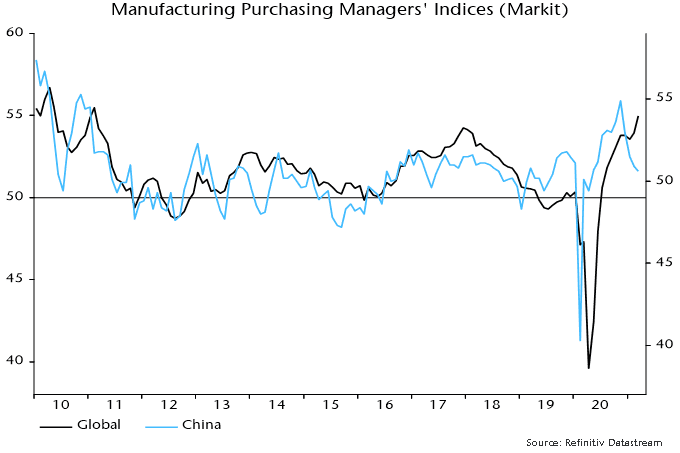
The slowdown forecast rests on the relapse of global six-month real narrow money growth from its July-August 2020 peak – turning points have led those in industrial output growth by nine months on average historically. The lead time on the global manufacturing purchasing managers’ index (PMI) is slightly shorter, suggesting that a new high in the index reached in March will mark the peak of the current upswing – chart 2.
Chart 2
China’s industrial recovery has already decelerated, with the Markit / Caixin manufacturing PMI falling to an 11-month low in March. Chinese monetary policy was less stimulative than elsewhere in H1 2020 and retightened in H2, explaining relatively weak money trends – chart 3. China’s PMI has led the global measure since the GFC – chart 4.
Chart 3
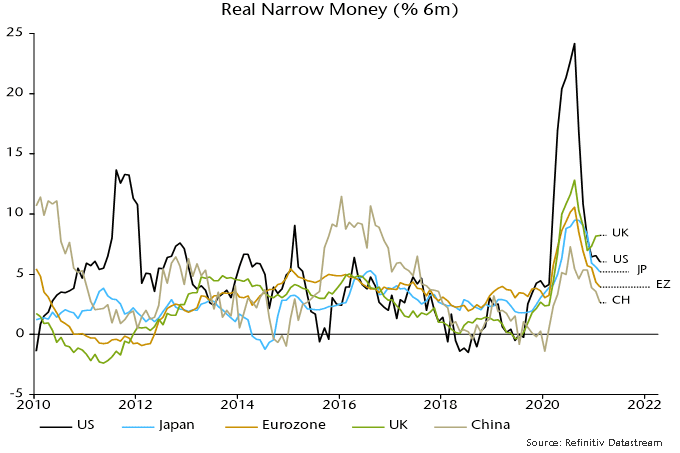
Chart 4
Global six-month real narrow money growth continued to subside in February. A recovery could unfold into the summer as US money numbers are boosted by disbursement of fiscal stimulus and if the PBoC relaxes policy in response to softer economic data. Such a scenario could result in another “excess” money buy signal by mid-year while suggesting industrial reacceleration from late 2021. A money growth rebound, however, is likely rather than guaranteed and the judgement here is that the focus for now should be on downside economic / market risks.
An industrial slowdown could be offset in GDP terms by services strength if covid developments allow economic reopening. This could, however, contribute to industrial deceleration by reversing last year’s substitution by consumers of goods for services spending. Industrial trends are likely to be more important for markets, partly reflecting a stronger correlation with equity earnings. Services-driven GDP strength could make central banks less inclined to offer support in the event of industrial / market weakness.
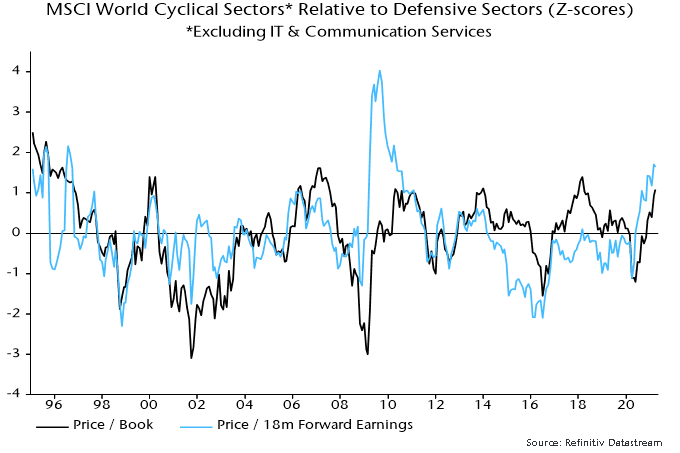
Global CPI inflation rates are spiking higher in reflection of recent commodity price moves and base effects but inflation worries could be near a short-term peak if the above industrial scenario unfolds – another reason for doubting that the cyclical / value rally will extend in Q2. Input price components of business surveys will fall away into the summer barring another surge in oil and other industrial commodities – chart 5. Cyclical sectors may be fully discounting “reflation”, judging by valuation relative to defensive sectors – chart 6.
Chart 5
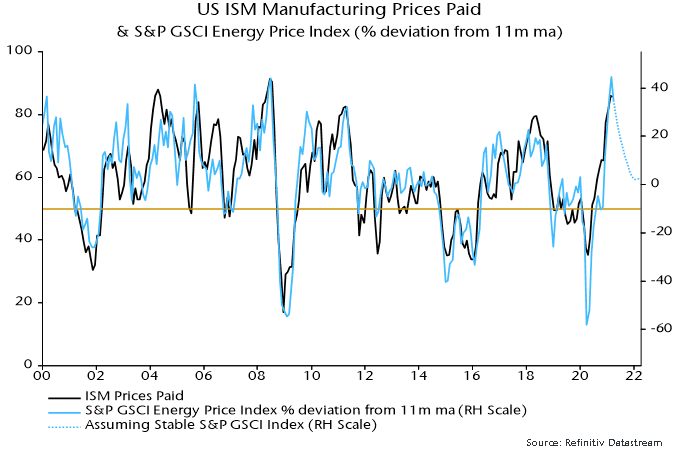
Chart 6
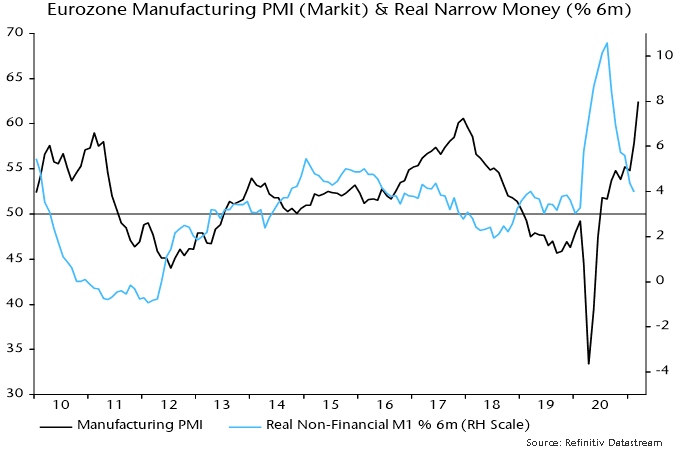
The March rise in the global manufacturing PMI was driven by European components, with the US PMI little changed and China’s – as noted – easing further. Eurozone strength is consistent with a real money growth spike last summer but a subsequent slowdown argues against current levels being sustained – chart 7.
Chart 7
UK money trends, by contrast, are diverging positively from other majors, signalling a relatively bright economic outlook and possible support for UK equities – chart 3. Money growth strength reflects larger-scale monetary deficit financing than in other countries, which may continue given PM Johnson’s big spender bias and a supine Bank of England. “Excess” money could partly flow overseas, suggesting downside risk for sterling, in which speculators appear to have accumulated a significant long position.
The forecasting approach here uses cycle analysis as a cross-check of the monetary analysis and to provide longer-term perspective. The previous assessment, which is maintained, was that the stockbuilding and business investment cycles bottomed in Q2 2020, while the long-term housing cycle remains in an upswing. The suggestion that all three cycles were turning supportive for the global economy and markets reinforced the positive message from monetary trends in mid-2020.
The next scheduled low is in the short-term stockbuilding cycle. Based on an average historical cycle length of 3.5 years, this could occur in late 2023, with the downswing into the low starting 12-18 months earlier, i.e. in mid- to late 2022. Risk markets tend to weaken in the 18 months leading up to a cycle trough – major equity bear markets have usually occurred during this time window.
The suggestion is that the primary trend in the global economy and markets will remain up through H1 2022. Stockbuilding cycle upswings, however, typically unfold in a zig-zag pattern, with an initial upthrust followed by a corrective phase before a final move higher into the peak. The judgement here is that the initial phase is ending and cycle momentum will diminish into H2, consistent with the monetary forecast of an industrial slowdown. The view that the initial phase is mature is supported by the business survey inventories indicator in chart 8.
Chart 8
Market moves since Q2 last year, moreover, have in most cases matched or exceeded averages during 18-month periods following previous stockbuilding cycle lows – see table 1. Developed market equities, cyclical sectors and commodity prices, in particular, have performed strongly, suggesting limited further upside even though a stockbuilding cycle downswing may be a year or more away.
Table 1
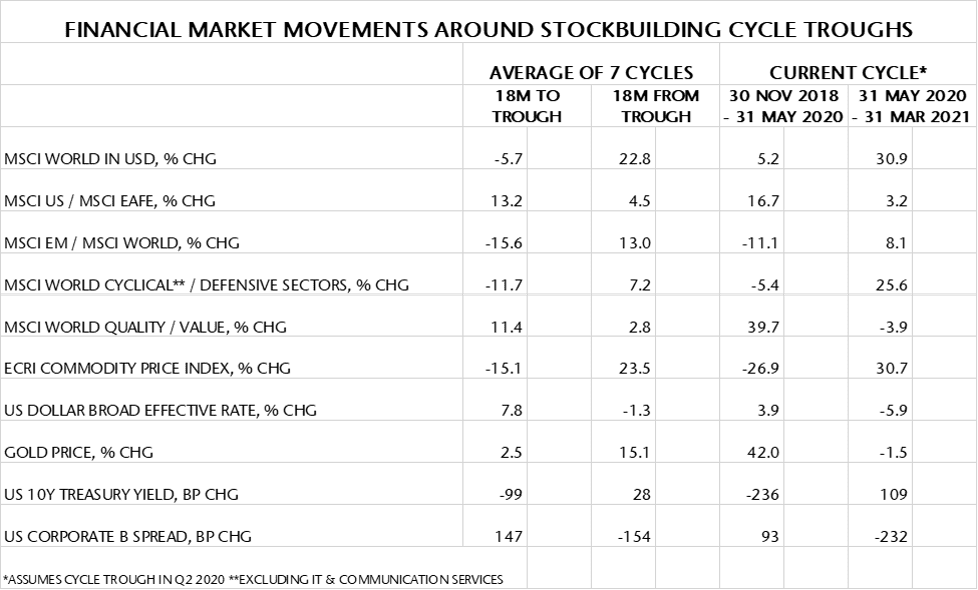
A further consideration is that the current stockbuilding cycle could be shorter than average. The covid shock appears to have extended the previous cycle to 4.25 years. If the current cycle were to display an offsetting deviation from the average 3.5 years, the next low would occur in early rather than late 2023 (i.e. 2.75 years from the Q2 2020 trough). This, in turn, would imply that the 18-month negative period for markets ahead of the low would start in H2 2021.
The latter possibility, it should be emphasised, is not the central case here and would require confirmation from a further fall in global six-month real narrow money growth during H1 2021 rather than the US-led rebound suggested earlier.
The comparison of recent returns with stockbuilding upswing averages, as well as supporting the case for reducing cyclical sector exposure in favour of defensive sectors, suggests relative value in emerging market equities, quality and gold, and scope for a further rally in the US dollar. Stronger EM equity performance, however, may be conditional on a recovery in Chinese money growth, probably requiring a prior PBoC policy shift.
These are the views of the author at the time of publication and may differ from the views of other individuals/teams at Janus Henderson Investors. Any securities, funds, sectors and indices mentioned within this article do not constitute or form part of any offer or solicitation to buy or sell them.
Past performance does not predict future returns. The value of an investment and the income from it can fall as well as rise and you may not get back the amount originally invested.
The information in this article does not qualify as an investment recommendation.
Marketing Communication.
As a result of COVID-19 and the consequent travel restrictions, household consumption has increased in recent months while spending on leisure travel has declined. It is anticipated that spending on leisure travel will gradually return, however we doubt it will result in a decrease in at-home leisure spending. Due to the pandemic, a greater number of people are working from home, thus spending more time at home. The cocooning and healthy living trends should continue to support household spending in categories such as gardening, well-being, and home-related expenses. We believe that long-term growth trends in the swimming pool industry are looking bright. Fluidra, a company we initiated a few months ago, should benefit from strong market fundamentals.
Spanish-based Fluidra is one of the leading manufacturers of pool equipment. The company is the most vertically integrated player in that industry, with manufacturing and distribution activities for residential and commercial pools. Fluidra manufactures all components of a residential or commercial pool (i.e., pumps, heaters, valves, filters, cleaners, chemicals). In 2018, the company merged with Zodiac, another well-established pool equipment manufacturer. With that merger, Fluidra became the world’s largest pool equipment manufacturer with a market share of around 18%. The company generates 49% of its sales in Europe, 31% in North America and 20% in other international markets. For fiscal year 2020, consensus estimates are for sales of €1,475 million and an EBITDA of €304 million.
We expect demand to remain strong in the coming months, both in the aftermarket and new build areas. In addition, product innovation should continue to drive demand for pool products up. Last year was a good year for new builds, and based on pool builders, 2021 will be even stronger. Further, the commercial segment will be another driver, despite a relatively soft 2020. As the hospitality sector gradually recovers in 2021, we anticipate that the commercial market will experience renewed growth soon.
Market size
- The market size for pool equipment is €7.1 billion, growing at 4%-6% per annum. Growth will come from an increasing average ticket size, growth in the installed pool base as well as new build growth.
- The aftermarket represents about 73%, while new build is 21%.
- Regarding end markets, the residential pool market is 70%, the commercial pool market (hotels, spas, etc.) is 7%, pool water treatment is 14%, while other uses account for 9%.
- On average, the base of new pool installations grows by 325,000 units per annum.
Growth strategy
- Product development driven by innovation (e.g., energy efficiency products, Internet of Things, sustainability, etc.).
- Growing the distribution network by signing new distributors.
- Bolt-on acquisitions.
Strengths
- Fluidra is the dominant player in pool equipment with a market share of 18%.
- Following the merger with Zodiac, Fluidra is well positioned in all market segments.
- Widespread global coverage with a strong distribution network.
- Broad diversification by products, geographies, and distributors.
- Management has delivered the balance sheet over the past two years and the company is now in a stronger financial position.
- Commercial and industrial synergies.
- Ability to innovate.
Opportunities
- Environmental consideration and stronger demand for energy efficient products.
- The average basket value for pool equipment is expected to soar (e.g., variable speed pumps are 50% more expensive than single speed pumps).
- There is also a strong demand for better product functionality, such as connected devices (only 3% of existing pools are considered somewhat connected).
- Emergence of the middle class in developing countries would generate new demand. Global warming should support demand for pools.
- Housing activity and urbanization overall.
- The market is very fragmented and there are many small to medium companies that could be consolidated.
Risks
- There is some seasonality in the business skewed towards the first half of the year.
- Their products are discretionary by nature and could be impacted by a deterioration of housing activity, and by weaker disposable incomes.
- Competition.
COMMENTARY
January 27, 2014
Dear clients and colleagues,
We recently had a chance to meet with over 40 companies based in Germany and France. Here are some thoughts on the two biggest European countries and our views for 2014.
France
The main topics of discussion in France remain on how they can stimulate their job market and economy while engaging in much needed reforms. The government is now accelerating measures to improve France’s competitiveness and tackle its fiscal deficit. President Hollande just announced that €30 Billion in employer contributions for family allowances will be eliminated by 2017. There is also a strong willingness to streamline business regulations and bureaucracies to support the manufacturing sector.
Regarding fiscal issues, France is committed to cut public spending by €50 Billion between 2015 and 2017, on top of an additional €15 Billion for this year. France has little room to maneuver and finally politicians have realized the importance of reforms. Let’s hope that these announcements will translate into real actions sometime soon.
Germany
Germany’s strong economic performance should remain intact for 2014. The German model, which relies on leading edge technology to produce highly desirable products, should continue to deliver good performance overall. Automotive, Cap goods and Technology companies should do especially well. Despite the currency headwinds that German exporters are facing, most companies expect to maintain or increase their operating margins. One reason being that companies remain very much focused on bringing down their cost base. Even 5 years after the financial crises, rigorous restructuring programs are still on the agenda. Finally, we feel like the introduction of a minimum wage by 2015 and an increase in workers benefits would stimulate domestic consumption.
European markets
We see growth accelerating in 2014 but at very slow pace. In this context of anemic growth, we anticipate small caps to outperform their larger counterparts. In our view, European stocks offer better margins expansion and thus, more re-ratings potential than most other regions. Europe in general remains under-owned in many portfolios and we anticipate a gradual capital inflow to the region.
Balance sheets at corporate levels are sound and most of the deleveraging has been done. Corporate leverage is approaching its bottom level of 1995-1997 when the net debt to capital was around 40%.
Healthy balance sheets and an improvement in business sentiment could trigger an acceleration of M&A activities. A potential pick-up in M&A, even a small one, would be very beneficial for smaller companies. Keep in mind that more than 96% of all deals come from companies with less than 5 Billon dollars in market cap.
The Global Alpha Team
This report is provided solely for informational purposes and nothing in this document constitutes an offer or a solicitation of an offer to purchase any security. This report has no regard to the specific investment objectives, financial situation or particular needs of any specific recipient and does not constitute a representation that any investment strategy is suitable or appropriate to a recipient’s individual circumstances. Global Alpha Capital Management Ltd. (Global Alpha) in no case directly or implicitly guarantees the future value of securities mentioned in this document. The opinions expressed herein are based on Global Alpha’s analysis as at the date of this report, and any opinions, projections or estimates may be changed without notice. Global Alpha, its affiliates, directors, officers and employees may buy, sell or hold a position in securities of a company(ies) mentioned herein. The particulars contained herein were obtained from sources, which Global believes to be reliable but Global Alpha makes no representation or warranty as to the completeness or accuracy of the information contained herein and accepts no responsibility or liability for loss or damage arising from the receipt or use of this document or its contents. Performance figures are stated in Canadian dollars and are net of trading costs and gross of operating expenses and management fees. Further information about the Global Small Cap Composite is available by contacting the firm. Global Alpha Capital Management Ltd. (Global Alpha) claims compliance with the Global Investment Performance Standards (GIPS ®) and has prepared and presented this report in compliance with the GIPS. Global Alpha has not been independently verified.