Photo de plusieurs voies ferrées et de trains en correspondance.

Connor, Clark & Lunn Infrastructure (CC&L Infrastructure) et Alpenglow Rail (Alpenglow) ont le plaisir d’annoncer la clôture réussie d’un financement de placement privé inaugural de plus de 280 millions de dollars canadiens. Le processus a suscité l’intérêt d’un groupe diversifié d’institutions financières nord-américaines de premier plan, de sorte que la transaction a été largement sursouscrite. Les billets de placement privé ont reçu une cote de catégorie investissement.

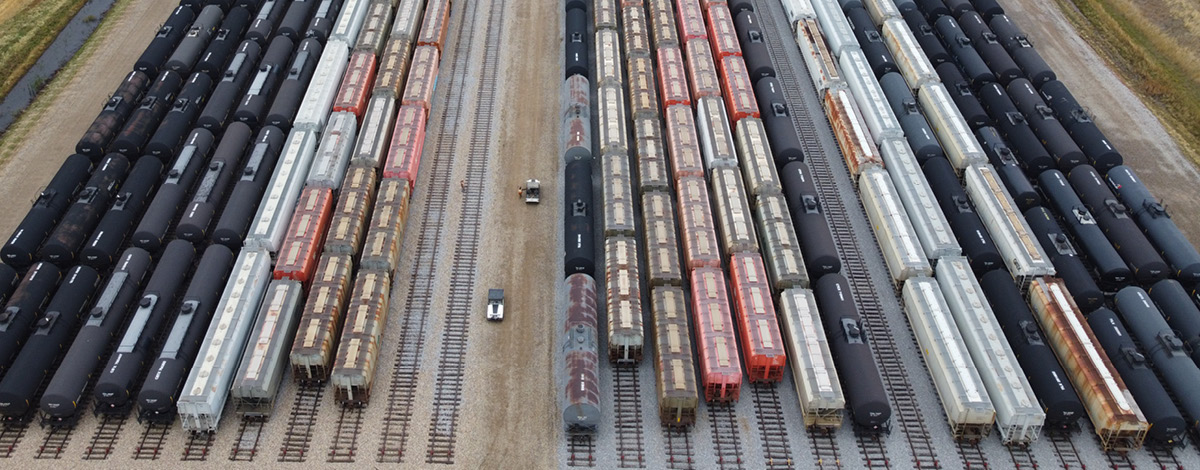
Le partenariat stratégique entre CC&L Infrastructure et Alpenglow a été établi en 2019 en vue de développer et exploiter un portefeuille diversifié d’entreprises ferroviaires en Amérique du Nord. Le portefeuille d’Alpenglow comprend six terminaux ferroviaires, soit trois terminaux au Canada sous la marque VIP Rail (Sarnia et Corunna en Ontario et Alberta Midland en Alberta) et trois terminaux aux États-Unis sous la marque USA Rail (Port Allen en Louisiane et Port Arthur et Orange au Texas). Alpenglow offre entre autres une gamme complète de solutions ferroviaires à ses clients, y compris l’entreposage des wagons, la commutation, le transbordement et le nettoyage des wagons.

Ryan Lapointe, directeur général de CC&L Infrastructure, a déclaré : « CC&L Infrastructure est ravie de mener à bien ce financement, qui souligne la force de notre partenariat avec Alpenglow et la qualité de la plateforme ferroviaire que nous avons construite ensemble. Dès le début de notre partenariat, notre vision commune était de créer une entreprise ferroviaire sécuritaire, évolutive et axée sur le client, et ce financement nous permet de continuer à réaliser cette vision. Notre approche d’investissement à long terme offre une proposition de valeur solide au sein du secteur ferroviaire. Nous sommes impatients de soutenir la prochaine phase de croissance et de création de valeur dans l’ensemble du portefeuille. »

Henning von Kalm, chef des finances d’Alpenglow, a ajouté: « Avec CC&L Infrastructure, nous restons déterminés à détenir et à exploiter des actifs ferroviaires de haute qualité sur le long terme. Ce placement privé témoigne de la résilience de notre modèle d’affaires et de la confiance que les investisseurs accordent à notre plateforme. Les terminaux ferroviaires d’Alpenglow sont stratégiquement situés dans les principaux centres de raffinage et de pétrochimie d’Amérique du Nord – le Centre de l’Alberta, la côte du golfe des États-Unis et le sud-ouest de l’Ontario. Grâce à cette présence établie dans de multiples marchés, nous sommes enthousiaste à l’idée de tirer parti de nos réussites et de continuer à produire de solides résultats. »

Marchés des capitaux CIBC (CIBC) a agi à titre de conseiller financier exclusif et d’agent de placement principal de CC&L Infrastructure et d’Alpenglow. Banque Nationale Marchés des capitaux et Desjardins Marché des capitaux ont agi à titre d’agents de placement supplémentaires, et Torys LLP a agi à titre de conseiller juridique de l’émetteur.

À propos de Connor, Clark & Lunn Infrastructure

CC&L Infrastructure investit dans des actifs d’infrastructure du marché intermédiaire présentant des caractéristiques de risque et de rendement attrayantes, une longue durée de vie et la possibilité de générer des flux de trésorerie stables. À ce jour, CC&L Infrastructure a accumulé plus de sept milliards de dollars d’actifs sous gestion, diversifiés dans une variété de régions géographiques, de secteurs et de types d’actifs, avec plus de 100 installations sous-jacentes dans approximativement 40 placements individuels. CC&L Infrastructure fait partie de Connor, Clark & Lunn Financial Group Ltd., une société indépendante de gestion d’actifs multiaffiliés qui offre une vaste gamme de solutions de gestion de placements traditionnelles et alternatives aux investisseurs institutionnels et individuels. Les sociétés affiliées de Connor, Clark & Lunn Financial Group gèrent plus de 167 milliards de dollars canadiens d’actifs. Pour de plus amples renseignements, veuillez consulter le site www.cclinfrastructure.com.

À propos d’Alpenglow Rail

Alpenglow Rail développe et gère des entreprises de transport ferroviaire de marchandises et des actifs de transport connexes partout en Amérique du Nord. Alpenglow Rail possède et exploite actuellement six terminaux ferroviaires stratégiquement situés dans les principaux marchés industriels du Canada et de la côte américaine du golfe du Mexique. Alpenglow Rail a été fondée par une équipe de dirigeants de compagnies de chemin de fer chevronnés possédant une vaste expérience de l’acquisition, de l’exploitation, du développement et de la croissance de chemins de fer d’intérêt local en Amérique du Nord. Pour de plus amples renseignements, veuillez consulter le site www.alpenglowrail.com.

Coordonnées

Kaitlin Blainey
Directeur général
Connor, Clark & Lunn Infrastructure
(416) 216-8047
[email protected]

Henning von Kalm
Dirigeant principal des finances
Alpenglow Rail
(917) 293-2351
[email protected]

A little boy playing on a tablet at night.

Of the five senses, vision is regarded as the most important as it allows us to navigate our environment, recognize the faces of our loved ones and read and watch to learn and entertain. But a good number of us do not have healthy eyes. According to the World Health Organization (WHO), at least 2.2 billion people globally suffer from near or distant vision impairment. The organization recognizes myopia as a significant public health concern given its rising prevalence around the world. A review of 276 studies (involving more than 5.4 million children from 50 countries across six continents) by the British Journal of Ophthalmology revealed that global prevalence of myopia among children and adolescents increased from 24% in 1990 to 36% in 2023 – one in three of all children and teens are nearsighted today. What is even more concerning is that myopia is starting earlier in children than before.

Prevalence of myopia by age group in 2000 vs. 2050, % of world population
Line graph comparing the projected prevalence of myopia by age group in 2000 vs. 2050, as a percentage of the world population.
Source: American Academy of Ophthalmology, BofA Global Research

The study predicted that approximately 740 million children and teens (more than half globally) will be myopic by 2050. American Academy of Ophthalmology in its 2016 article forecasted that by 2050, myopia would affect nearly half of global population. A more conservative projection this year puts the number at ~40% of global population – but it is clear that the world 25 years from now will have more than the 2.2 billion people in need of corrective lenses today.

Prevalence of myopia is not even across the world. Asia sees a higher prevalence (close to 40%) that is two to four times higher than that of other regions. East Asian countries – China, Taiwan, South Korea, Japan and Singapore – see much higher myopia rates, exceeding 80–90%, in their adolescent populations.

Bar graph comparing the projected prevalence of myopia by global regions as a percentage of regional population.
Source: ScienceDirect, Global perspectives on myopia and pathologic myopia: From environmental drivers to precision medicine

Primary drivers of myopia are genetics, near-work activities and lack of outdoor activities. A recent article in Progress in Retinal and Eye Research journal linked the high prevalences in the East Asian countries to educational systems characterized by intense academic competition, prolonged school hours and substantial homework assignments which significantly reduce opportunities for outdoor activities.

The WHO estimated that vision impairment cost the global economy an estimated USD411 billion in productivity loss, with only 36% of people with myopia having access to an appropriate intervention. Shanghai Conant Optical Co. Ltd. (2276 HK) in our Emerging Markets Small Cap Strategy seeks to address this global myopia pandemic. SCO, a sub-USD3 billion market cap company, is the second largest resin (plastic) optical lens maker in the world after EssilorLuxottica in terms of production volume. At its manufacturing locations across China and Japan, the company produced 209 million pieces to serve customers in over 90 countries around the world in 2024.

We believe SCO’s customer value proposition of value for money is especially effective in the product category of optical lenses. SCO’s high-index lenses (such as 1.74 and 1.67) are approximately half the price of comparable lenses from EssilorLuxottica, Hoya and Zeiss whilst providing the same level of vision correction. On product quality, SCO is an ODM (original design manufacturer) for all the previously mentioned global brands with various lens-coating options available. For the brand-conscious, it is “fortunately” very difficult to tell which brand of lens one is wearing. We are not surprised that the company is especially seeing strong demand in developing countries where its customer value proposition would be stronger. As a person who has been wearing glasses for the past three decades, I have found myself switching from the expensive Hoya and Nikon to much more affordable brands (including Asahi-Lite which is now owned by SCO), which have provided an identical visual experience – I have not looked back since.

China offers a significant room for growth, having entered the world’s largest short-sighted country in 2018, two decades after the company was established. Over 700 million people or roughly half the population in China are diagnosed with myopia. The prevalence of myopia is especially high in school-aged children – roughly 40%/70%/80% of students in elementary/middle/high school suffered from myopia according to a 2022 study published in Investigative Ophthalmology & Visual Science. Laser eye surgery is not an option for these youths, and they must rely on glasses for vision correction until they are older. SCO’s sales in China focus on higher-index lenses where competition is more limited and penetration is lower, and 80% of those sales are of its own brand. The company’s growth in China has been margin accretive given the higher mix of own brand and higher-index lenses.

The company is also involved in the development of AI/AR glasses with leading technology companies in North America and China. SCO as a partner to the technology companies makes sense, given SCO’s scale and cost competitiveness. We appreciate that SCO is trying to solve the problem of the global myopia pandemic, but do not doubt that AI/AR glasses offer the next leg of growth for the company.

The Fed’s economic forecasts continue to suggest that the window for easing will close in early 2026, according to a simple model of its historical behaviour.

Put differently, an extension of rate cuts requires either downside labour market and / or inflation surprises or a change in the Fed’s reaction function.

The model classifies the Fed as being in tightening or easing mode depending on whether a probability estimate is above or below 0.5. The estimate is based on currently reported and lagged values of core PCE inflation, the unemployment rate and the ISM manufacturing delivery delays index. Despite the small number of inputs, the model does a satisfactory job of “explaining” the Fed’s past actions.

The probability estimate fell below 0.5 in August ahead of the September rate cut and declined further last week, reflecting a sharp drop in the ISM component – see chart 1.

Chart 1

101225c1

The December FOMC median forecasts for the unemployment rate in Q4 2025 and Q4 2026 are unchanged from September, at 4.5% and 4.4% respectively. Forecasts for annual core PCE inflation have been lowered by 0.1 pp, to 3.0% and 2.5%. The analysis here assumes smooth trajectories between the two quarters.

The model also requires an assumption for the ISM deliveries index. The December drop contrasts with mixed readings of equivalent components of regional Fed surveys, suggesting at least a partial reversal – chart 2. The projections assume a return to the Q4 average in January, followed by stability.

Chart 2

101225c2i

On this basis, the probability estimate rises in January and moves above 0.5 in February, climbing further into the summer.

The suggestion of an imminent end to the easing cycle is unsurprising given a central Fed view of a continued core inflation overshoot and a reduction in labour market slack.

A new Fed chair is unlikely to shift the reaction function without larger changes in the committee’s composition. The administration’s hopes of much lower rates will hinge on data.

Global manufacturing PMI new orders fell back in November, consistent with the forecast here of an inflection weaker from late 2025, based on a slowdown in six-month real narrow money momentum from a March peak – see chart 1.

Chart 1

091225c1

The PMI decline was mirrored by an alternative global survey indicator derived from national polls. The alternative indicator has been undershooting the PMI recently, reflecting relative weakness in the US ISM and Chinese NBS surveys compared with their S&P Global counterparts – chart 2.

Chart 2

091225c2

The suggestion of a turning point is supported by the OECD’s G7 composite leading index. The one-month change in the index usually moves ahead of the PMI and peaked in July, easing further in November. The slowdown, however, has been minor and numbers can be revised – chart 3.

Chart 3

091225c3i

A recovery in real money momentum since July suggests a PMI low around end-Q1. Still, approaching downswings in the stockbuilding and housing cycles argue against a sustained rebound.

PMI swings are typically mirrored by the price relative of cyclical equity market sectors (excluding IT and communication services) versus defensive sectors (excluding energy). Relatives peaked in September, consistent with the October PMI high, but have rallied with rising Fed rate cut expectations – chart 4. A further PMI decline into late Q1 could be associated with renewed underperformance.

Chart 4

091225c4


Investor pointing at a chart showing data with a sharp increase.

After the “meme stock” frenzy of 2021 and a bruising surge of volatility in 2022, many investors assumed retail traders had finally stepped back. The story was neat: higher rates, tighter liquidity and fading stimulus would restore rationality to equity markets. We were not convinced and argued in February 2023 that speculative behaviour was more likely to adapt than disappear.

Fast forward to today, and the data suggest retail participation has not only persisted, it has become a defining force in short‑term market moves. Across the small‑ and mid‑cap universes, trading volumes in lower‑priced, lower‑quality names have surged, with roughly a quarter of daily volume now concentrated in stocks trading under $5, a share last seen at the peak of 2021’s speculation. This renewed activity has driven a striking rotation beneath the surface: low ROE and even unprofitable companies have periodically outpaced their higher‑quality, high‑ROE peers over short horizons.

In this weekly, we want to address two questions:

  1. Why does high ROE – the best proxy for quality – matter when investing? And,
  2. What does history tell us about the performance of companies with high ROE versus those with low or negative ROE?

What ROE really measures

Return on equity (ROE) is net income divided by shareholders’ equity; it tracks how efficiently a business converts owners’ capital into earnings. In practical terms, it tells you how many dollars of profit a company generates for every dollar of equity on its balance sheet. Conceptually, ROE links back to basic valuation logic: for a given starting multiple, a firm that can earn and reinvest at higher rates should grow intrinsic value and future dividends faster over time. A company that compounds book value at 15–20% per year for a decade ends up in a very different place than one compounding at 5%, even if both start at the same size and valuation.

High – and sustainably high – ROE typically reflects one or more durable advantages: strong pricing power, an advantaged cost position, valuable brands or networks, or business models that require relatively little capital to grow. This is why investors often group high-ROE companies under the broader “quality” or “profitability” factor. In other words, ROE is not just a ratio; it is often a shorthand for underlying business quality.

Why high ROE wins over time

History is clear: profitability and quality matter far more over multi-year horizons than they do over six month “junk” episodes. Portfolios tilted toward companies with high and persistent profitability have historically delivered higher average returns than portfolios concentrated in low profitability or unprofitable names, even after controlling for size and valuation.

There are three main reasons for this:

  1. Compounding of retained earnings: High-ROE companies can reinvest a larger portion of each dollar of earnings at attractive rates. Over time, this drives faster growth in earnings per share and intrinsic value without requiring fresh capital from shareholders.
  2. Resilience through cycles: Businesses that earn high returns on capital usually have competitive advantages that help them sustain margins and cash flows during downturns, which tend to show up as shallower drawdowns and faster recoveries.
  3. Better capital allocation options: Management teams leading high-ROE franchises often have more flexibility: reinvest in the core, expand into adjacencies, pay dividends or buy back shares. Lower-quality companies, in contrast, often need to issue equity or debt simply to survive, diluting existing shareholders.

Short periods of outperformance by low-quality stocks can be sharp and uncomfortable, but they have historically been transient, while compounding fundamentals tend to dominate over longer horizons.

When you think about it, the lesson for long-term investors couldn’t be clearer: real wealth comes from investing in companies that steadily compound capital at high rates, not from jumping on every fleeting speculative surge. The junk rallies fade and quality compounding lasts.

Line graph illustrating the difference between the compound rates of high ROE quintile vs. low ROE quintile with high-ROE stocks compounding at an annual rate 3.4% higher than low-ROE stocks.

Time to take out the trash – What really is a “junk rally”?

In a universe of over 12,000 companies within global small caps, not every balance sheet is one to admire. Our job as active managers is to find real quality – the companies that actually make money and know how to grow it – and to avoid the companies that are overleveraged, poorly managed or structurally unprofitable. Many of those “junk” businesses feel more like ticking time bombs than investments. So, what happens when these so‑called junk companies rally and drive index performance? Do we simply throw in the towel and chase them?

A junk rally is a period when the lowest‑quality stocks – often those with excessive leverage, negative earnings, high beta or heavy short interest – significantly outperform the broader market, particularly higher‑quality names. These episodes tend to be most intense and momentum‑driven in small caps, where smaller market caps and thinner liquidity allow collective enthusiasm and buying pressure to move prices disproportionately.

Junk rallies often arrive with a burst of excitement – usually from retail investors – as they rush into stocks chasing a story and paying little attention to fundamentals. To spread these stories, investors turn to platforms like Reddit, X or Instagram, using viral posts and online communities to build momentum. As more buyers join in, the rally feeds on itself, with price action attracting even more attention.

Common terms around these episodes include:

  • Diamond hands: Investors who refuse to sell, convinced that holding long enough will eventually make them rich.
  • Short squeeze: When heavily shorted stocks rise sharply, forcing short sellers to buy back shares to cover positions, which drives prices even higher.
  • FOMO (“fear of missing out”): The anxiety investors feel when they believe they might miss a big gain if they do not act immediately.
  • Pump and dump: When prices are hyped up – often by coordinated online promotion and early movers sell into the frenzy, leaving late buyers exposed when prices fall back.

These phrases rarely appear in institutional memos, but the behaviours behind them very much exist in our universe and often bring sharp, sudden volatility to stocks whose fundamentals have not changed.

How junk rallies behave in practice

Over the past five years, we have seen several junk rallies – wild bursts where low‑quality stocks suddenly take off. Each time, two features have stood out. First, these rallies are typically parabolic and short‑lived; trying to jump on the bandwagon after the move is underway is almost always a poor risk‑reward trade‑off. Second, they almost always mean‑revert back toward the market, making them more about timing and positioning than about sustainable value creation.

Normally, we would pay limited attention to these episodes. However, because these lower-quality stocks sit in our benchmark, big, synchronized rallies in some low-quality pockets can cause us to lag temporarily. That is exactly what happened in 2020, 2023, and again in 2025, when risk on sentiment sent the lowest quality corners of the market flying while our quality growth names took a back seat. As the excitement faded and fundamentals reasserted themselves, excess junk gains unwound and quality leadership reemerged.

Line graph illustrating the constant performance of the MSCI World Small Cap Index vs. the peaks of recent "junk rallies."

Proof that low quality doesn’t last

Even without decades of data, recent episodes make the point: high ROE remains a long‑run winner. In the 2022 low‑quality rally, high‑quality stocks temporarily lagged as low‑quality names spiked and then sold off, but by the end of that six‑month stretch, the high‑quality cohort had again moved ahead. You saw a similar pattern in the quality rally of summer 2024, which lost steam by early 2025, and more recently in the post‑Liberation Day rebound, where relief from macro fears and crowded positioning turbocharged the most speculative, lower‑ROE parts of the market.

Once low quality lost steam, high quality rebounded faster

Line graph illustrating that high-quality stocks rebounded faster than low-quality stocks after a market correction.

Low quality was ahead, but high quality protected during Liberation Day market correction

Line graph illustrating that although low-quality stocks were ahead of high-quality stocks, but high-quality stocks were more protected during the Liberation Day market correction. 

In the immediate aftermath of Liberation Day, low‑quality stocks rallied because the market shifted violently from fear to relief: investors moved quickly from pricing in severe recession and trade dislocation to betting on a softer outcome, and that swing in sentiment tends to benefit the most beaten‑up, highly levered and high‑beta parts of the market first. Positioning and mechanics amplified the move, as many lower‑quality names were heavily shorted and under‑owned going into the shock, so even a modest improvement in the macro narrative forced short covering and factor rebalancing, turbocharging returns in exactly the sort of speculative companies that typically lead junk rallies.

The current junk rally is showing signs of losing momentum, with lower-quality names starting to lag

Line graph illustrating that as the current junk rally is showing signs of losing momentum, lower-quality stocks are starting to lag their high-quality counterparts.

Don’t hate the player, hate the game

Now that we’ve defined what junk rallies look like, let’s examine how they affect active management. As noted above, the post-Liberation Day period – when the MSCI World Small Cap Index surged 34.3% (CAD) between April 8 and October 31, 2025 – marked one of the strongest low-quality rallies of the past decade. During this time, market leadership – particularly in the United States – was dominated by lower-quality companies across a range of sectors. The AI and data centre trade became the theme of the year, driving performance regardless of valuations or ROE.

What you’ll almost never hear an investor say is that they’re overweight “junk.” It’s rare for anyone to deliberately focus on low-quality companies. As a result, low-quality rallies usually lead to short-term periods where active managers struggle to generate alpha. Looking at year-to-date and one-year returns, we’re seeing exactly that type of environment. With the MSCI World Small Cap Index ranking in the middle-to-high second quartile, about 60% of active global small-cap managers haven’t added alpha over the past year. Additionally, these periods usually come with a wide dispersion in manager returns, as portfolios with even modest exposure to the most speculative names tend to outperform sharply, while quality-focused strategies are left behind.

As we can see below, over the 7- and 10-year periods, global small caps remains an inefficient asset class – with more than 50% of active managers outperforming the MSCI World Small Cap Index.

Bar graph illustrating the quartile breakdown of global small cap manager returns.

What we’re trying to argue is that when these short periods of low quality take over, don’t hate the player, hate the game. The small cap market can be dysfunctional for short stretches, but over the long run, high-ROE companies almost always outperform their low-ROE peers.

Eurozone monetary trends suggest that interest rates remain above a “neutral” level.

The ECB’s deposit rate has been stable at 2.0% since June, following a 200 bp reduction over the prior 12 months. Lower rates should be feeding through to money trends by now.

Six-month growth of non-financial M3, however, was 2.4% annualised in October, half its average in the five years before the pandemic and slightly below the level when rate cuts started.

Chart 1

031225c1

Non-financial M3 comprises broad money holdings of households and non-financial corporations (NFCs). Six-month growth of headline M3, including volatile financial sector money, was even weaker, at 1.8% annualised.

Narrow money growth – as measured by non-financial M1 – is stronger but also below its pre-pandemic average.

There is no sign of acceleration in the latest numbers, with three-month rates of change close to six-month levels.

Broad money probably needs to expand by at least 4% pa to accommodate potential growth of about 1.25% pa and 2% inflation, allowing for a long-run decline in velocity. (The ratio of nominal GDP to non-financial M3 fell by 1.9% pa on average over 2000-19.)

Money growth below this level implies downward pressure on output relative to trend and / or inflation – inconsistent with rates being at “neutral”.

Slow broad money growth is partly attributable to sluggish credit trends: lending to households and NFCs rose by 2.8% annualised in the six months to October, with momentum stable recently.

A drag from ECB QT, meanwhile, has been fully offset by solid buying of government bonds by banks. Purchases have been spread across countries but were largest in France over the past 12 months – chart 2.

Chart 2

031225c2

Money growth would have been weaker without support from external inflows, reflecting a basic balance of payments surplus and a corresponding rise in banks’ net external assets – chart 3.

Chart 3

031225c3

Image illustrant la notation par étoiles de CC&L Infrastructure pour les catégories des PRI des Nations Unies : note de 5 étoiles sur 5 pour la gouvernance des politiques et stratégies, note de 5 étoiles sur 5 pour les placement direct – Infrastructures et note de 4 étoiles sur 5 pour les mesures visant à rehausser la confiance.

En tant que signataire des Principes pour l’investissement responsable (PIR) des Nations Unies, nous sommes heureux de vous présenter les résultats de notre rapport d’évaluation pour 2025. Cette année, CC&L Infrastructure a mis de l’avant plusieurs initiatives de gestion des risques et de création de valeur qui ont contribué à l’obtention de ces résultats remarquables, témoignant du travail acharné de l’équipe, de son approche disciplinée et de son engagement à l’égard de la gestion dynamique des actifs.

Apprenez-en davantage sur la façon dont nous mettons en pratique les Principes pour l’investissement responsable en consultant le https://cclinfrastructure.cclgroup.com/what-we-do/responsible-investment/ (en anglais seulement).

Close-up image of an electronic circuit board.

Our Emerging Markets team attended a series of corporate meetings at a technology conference in Taipei last week. During these meetings, one topic kept emerging: as semiconductors become more advanced and complex, the importance of testing them is growing rapidly. This theme appeared consistently across our meetings, including with companies involved in probe cards, system-level testing and metrology. As the current AI-driven arms race accelerates investment in high-performance computing, testing has become a foundation for semiconductor reliability.

For many decades, progress in semiconductors came from shrinking transistor size and fitting more of them onto each chip. But as Moore’s Law approaches its physical limits, chip designers are increasingly turning to advanced packaging to continue pushing performance forward. This approach helps sustain technological momentum but also introduces new challenges and more potential points of failure. That is why semiconductor testing matters more than ever.

Modern semiconductors must now be tested at several points during a complex fabrication process. At the wafer level, testing examines individual dies (individual chips on a wafer) to determine which are viable before sending the wafer to subsequent steps. This is critical because the packaging stage adds significant dollar value, and if a defective die is mislabeled as good, the cost of assembling it into an advanced package can be substantial.

Once a chip enters packaging, it undergoes final electrical and functional testing, which confirms that the packaged device is assembled correctly and works as intended. A growing number of AI accelerators also require burn-in testing, where devices are stressed under elevated temperature and voltage to screen for early-life failures.

Finally, system-level testing validates each device under real-world operating conditions. As AI processors draw more power and generate more heat, system-level testing has become one of the most critical stages of the entire test flow.

In a sense, modern chips now go through the semiconductor equivalent of an endurance triathlon: wafer-level tests, post-packaging reliability tests (including burn-in) and finally system-level verification. Each stage is designed to catch a different type of failure and skipping even one dramatically increases the risk of defects later in the cycle.

Importantly, the most advanced AI accelerators require far more testing, nearly doubling test time and test content relative to previous generations. It is also why AI chips are now 100% tested, unlike many consumer electronics where sample testing remains common. As one management team noted in a meeting, “reliability can no longer be assumed; it must be verified.”

The economics of chip failure have also changed dramatically. Today’s AI accelerators are among the most expensive devices ever produced. A single AI server rack powered by NVIDIA chips can cost around USD3.5 million. One faulty component can compromise the entire system. Meanwhile, testing typically represents only about 2-3% of total chip cost, yet it protects assets worth millions. This asymmetry also explains why switching test solution providers mid-generation is rare: the potential savings are small, while the risks are substantial. Robust testing has therefore become a form of value protection.

Taiwanese testing companies are uniquely positioned because they operate in close proximity to TSMC, which today manufactures virtually all of the world’s most advanced chips, and within a rich ecosystem of its partners. Supported by deep engineering expertise, this environment enables tight co-development of testing solutions aligned with the industry’s most advanced semiconductor processes.

Among the firms we met at the conference were two companies we own in our Emerging Markets portfolio, both of which illustrate how we leverage this theme in practice.

MPI Corporation (6223 TT)

MPI provides tools used for wafer-level testing, particularly probe cards with fine needle-like contacts that touch each die on a wafer to verify it functions before packaging. The company is a key supplier of customized, high-performance probe cards for ASICs (application-specific integrated circuits) used by hyperscalers.

As AI and advanced packaging increase chip complexity, wafer-level testing now requires more precise and specialized probe card designs. This is contributing to rising unit sales and higher prices for MPI’s solutions. The company has also been enjoying sustained market share gains, supported by its ability to offer superior customization, short lead times and close integration with customers early in the chip design process. These strengths position MPI well for structurally rising test intensity across next-generation logic and AI devices.

Chroma ATE Inc. (2360 TT)

Chroma complements the theme at the opposite end of the test flow. The company is a global leader in system-level testing, power-testing equipment and metrology tools. As chips become more power-hungry and thermally constrained, ensuring reliable performance under real operating conditions becomes essential. Chroma’s solutions support both the growing energy demands of data centres and the precision requirements of advanced packaging.

As semiconductor complexity rises and Moore’s Law slows, innovation is increasingly shifting to packaging, integration and system design. Testing is what bridges that complexity with reliable performance. MPI and Chroma play important roles in this ecosystem. As fundamental investors focused on quality and growth durability, we view testing as a structurally growing and increasingly critical part of the semiconductor landscape.

In our view, testing matters.

Graphique du partenariat entre Gestion de placements CC&L et l'Office d'investissement du RPC.

Gestion de placements Connor, Clark & Lunn (Gestion de placements CC&L) est heureuse d’annoncer l’étude de cas sur l’Institut sur les données d’Investissements RPC, qui met en lumière son partenariat durable avec Gestion de placements CC&L. Au cœur de notre partenariat se trouve l’engagement à l’égard de la recherche et du développement continus sur les placements quantitatifs à l’échelle mondiale.

Depuis 2004, Gestion de placements CC&L est un partenaire de confiance d’Investissements RPC. L’étude de cas décrit l’évolution de cette collaboration, qui est passée d’un mandat novateur superposant des positions acheteur et vendeur d’actions à une stratégie quantitative sophistiquée d’actions mondiales.

Investissements RPC a effectué son placement initial en fonction des capacités, du personnel et des processus de Gestion de placements CC&L. Depuis, l’approche de Gestion de placements CC&L à l’égard de la science des données de pointe, du développement de l’expertise et des modèles de placement exclusifs a pris de l’expansion et évolué au même rythme que les besoins d’Investissements RPC.

La relation entre Investissements RPC et Gestion de placements CC&L va au-delà d’un mandat de gestion de placements : il s’agit d’un partenariat stratégique, d’un parcours commun axé sur l’innovation, la résolution de problèmes et la croissance mutuelle. En 2024, nous avons célébré 20 ans de partenariat, un témoignage remarquable de la force et de la résilience de notre collaboration.

« L’ampleur de notre partenariat nous permet de résister à des périodes à la fois fortes et faibles et d’apporter les changements nécessaires. » affirme Martin Gerber, président et chef des placements de Gestion de placements Connor, Clark & Lunn. « Ce que nous faisons pour Investissements RPC aujourd’hui est très différent de ce que nous faisions il y a 20 ans, et ce, grâce au partenariat et à la confiance. »

Pour lire l’étude de cas complète, consultez le site Web de l’Institut sur les données d’Investissements RPC.

Global money trends suggest that major economic weakness will be deferred until later in 2026.

Six-month real narrow money momentum in the G7 and seven large emerging economies recovered further in October, almost returning to its March high – see chart 1.

Chart 1

271125c1

The fall from March into the summer is expected here to be reflected in a slowdown in industrial momentum – as proxied by global manufacturing PMI new orders – into late Q1 2026. The recent money growth recovery suggests a partial PMI rebound in Q2 – chart 2.

Chart 2

271125c2

The cyclical framework used here implies rising recession risk, with the stockbuilding and housing cycles in time windows to begin downswings. Monetary weakness would signal that a negative scenario is crystallising. The latest numbers appear to signal a delay.

The composition of the money growth rebound gives pause. The return towards the March high has been driven by further strength in the E7 component, with G7 real money momentum lagging significantly – chart 3.

Chart 3

271125c3

Narrow money trends are respectable or strong across major EMs, with the exception of Brazil – chart 4.

Chart 4

271125c4

Soft G7 growth reflects a slowdown in the US and continued – though moderating – weakness in Japan and the UK. Eurozone momentum rose further last month, though remains unexceptional.

Chart 5

271125c5