Au cœur de notre organisation se trouvent l’engagement et le désir d’offrir un rendement et un service supérieurs à nos clients. Notre principal objectif est de répondre aux attentes de nos clients tout en nous assurant que notre équipe est très motivée et enthousiaste. Pour y arriver, nous nous concentrons sur ce que nous faisons de mieux tout en cherchant à demeurer à l’avant-garde de la recherche et du développement sur les marchés des capitaux.
Le statu quo n’est pas une option
Chaque année, nous profitons de l’occasion pour fournir à nos clients une revue annuelle de l’entreprise, décrivant comment nous orientons nos efforts au sein de Gestion de placements Connor, Clark & Lunn (CC&L) pour respecter notre engagement à offrir un bon rendement des placements et un service à la clientèle supérieur.
Nos activités ont toujours été caractérisées par un réinvestissement continu et l’innovation; le statu quo n’est pas une option. Alors que nous composons avec un contexte financier et politique volatil, nous avons concentré nos efforts sur trois domaines de base qui sont essentiels à la vigueur et à la durabilité à long terme de notre société : notre personnel, nos capacités technologiques et notre infrastructure physique.
Notre investissement le plus important est dans notre équipe. En 2025, nous avons accueilli 28 nouveaux collègues au sein de la société et nous prévoyons en ajouter environ le même nombre en 2026. Ces ajouts touchent les fonctions de placement et du service à la clientèle, ce qui renforce à la fois nos capacités actuelles et le développement de notre relève. Cette croissance reflète notre engagement à bâtir une entreprise durable d’une génération à l’autre. En investissant dans le perfectionnement des talents, la planification de la relève et l’accompagnement de notre prochaine génération, nous veillons à ce que nos clients continuent de profiter d’une organisation solide, stable et tournée vers l’avenir.
La technologie est le deuxième pilier de notre stratégie de réinvestissement. Nous procédons à la modernisation des systèmes dans l’ensemble de nos fonctions de soutien et des opérations intermédiaires afin de renforcer la résilience opérationnelle, d’améliorer l’intégration des données et d’élargir nos capacités de production de rapports. Ces améliorations renforcent l’infrastructure qui soutient nos processus de placement et la prestation du service à la clientèle. Parallèlement, nous élaborons une approche rigoureuse en matière d’intelligence artificielle (IA). Notre stratégie vise à permettre à chaque secteur de nos activités de tirer parti des outils et de la technologie d’IA pour améliorer les processus de placement et d’affaires. L’introduction d’outils d’IA exige une surveillance adéquate et délibérée. Peu importe la complexité et le niveau de sophistication de l’intégration de l’IA, nos employés restent chargés de garantir la qualité et la pertinence des résultats et assument la responsabilité finale de chaque fonction.
Enfin, nous effectuons des investissements importants dans nos bureaux à Vancouver et à Toronto. Ces améliorations visent à créer des environnements qui favorisent la collaboration, la créativité et la connexion. Nos espaces remaniés soutiennent le travail d’équipe, le dialogue interfonctionnel et un engagement plus fort au sein des équipes de placement, des solutions clients et des opérations. L’objectif est de créer des conditions qui permettront de remettre en question, de peaufiner et de mettre en œuvre les idées de façon efficace, ce qui profitera à nos clients. Nous avons hâte d’accueillir les clients dans nos nouveaux bureaux en 2026 et de partager ces espaces actualisés en personne.
En terminant, je tiens à remercier sincèrement nos clients de leur confiance et de leur partenariat soutenu.
Sincères salutations,

Martin Gerber
Président et chef des placements
Notre équipe
En 2025, notre société a continué de croître, accueillant 28 nouveaux employés et portant notre effectif à 150 personnes. Nos activités profitent également de l’ensemble du Groupe financier Connor, Clark & Lunn, qui emploie plus de 500 professionnels soutenant la gestion des affaires, l’exploitation, le marketing et la distribution.
La stabilité et les spécialisations de notre société demeurent les principaux moteurs de nos activités. La planification de la relève et le perfectionnement professionnel sont au cœur de notre approche, assurant la continuité et la réussite à long terme.
Nous sommes heureux d’annoncer que plusieurs employés ont été promus au poste de directeur principal depuis le 1er janvier 2026, en reconnaissance de leur contribution importante et croissante à notre société.

Le conseil d’administration de CC&L est également heureux d’annoncer la promotion de nouveaux actionnaires depuis le 1er janvier 2026, en reconnaissance de leur leadership et de leur influence dans leurs fonctions.


Titres à revenu fixe
Au cours de la dernière décennie, l’équipe des titres à revenu fixe a investi considérablement dans l’élaboration d’un cadre quantitatif visant à repérer et à récolter des primes intéressantes sur les marchés des titres à revenu fixe, d’abord dans le cadre de stratégies relatives à un indice de référence, puis dans des mandats à rendement absolu. Comme ces flux de rendement systématiques se sont révélés à la fois attrayants et diversifiés, la demande des clients pour des solutions spécialisées a commencé à croître. En réponse, l’équipe fait évoluer ces capacités vers des stratégies quantitatives spécialisées, pouvant être mises en œuvre soit comme solutions de rendement total, soit comme source d’alpha portable venant s’ajouter à une gamme complète de sources de rendement de marché. Nous continuons d’investir dans la recherche, les infrastructures et les talents pour approfondir ces capacités et soutenir l’intérêt croissant des clients pour des sources de rendement résilientes et diversifiées dans différentes conjonctures de marché.
Sandy McArthur s’est joint à l’équipe des titres à revenu fixe en mai 2025 et est rapidement devenu un moteur central des initiatives stratégiques à l’échelle de la plateforme. Il allie une solide expérience du marché à une grande maîtrise technique, ce qui permet à l’équipe d’agir plus rapidement et de mener ses activités avec davantage de rigueur. Sa ténacité, ses compétences interfonctionnelles et sa volonté de prendre en charge des dossiers complexes ont déjà eu une incidence importante sur l’entreprise. Nous sommes heureux de l’accueillir à titre d’actionnaire en 2026.
Stratégies fondamentales d’actions
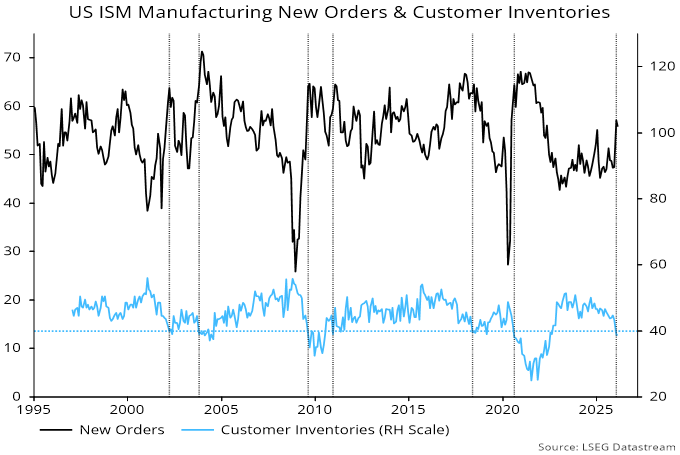
Après plus d’une décennie de surperformance des actions américaines, l’équipe estime que le marché boursier canadien est bien placé pour enregistrer des rendements supérieurs à moyen terme. Les valorisations intéressantes, la répartition sectorielle différenciée et une forte exposition à la hausse de la demande mondiale de produits de matières premières créent un contexte attrayant pour les actions canadiennes.
L’équipe des Stratégies fondamentales d’actions continue de soutenir les objectifs de placement des clients dans l’ensemble des mandats. Dans ce qui a été un contexte difficile pour les gestionnaires actifs en 2025, toutes les stratégies, y compris les actions canadiennes toutes capitalisations, les actions axées sur le revenu et les actions à petite capitalisation, ont produit un rendement dans le quartile supérieur par rapport à leurs pairs respectifs.
Pendant plusieurs années, l’équipe des Stratégies fondamentales d’actions met l’accent sur le développement de la prochaine génération de relève en placement. Au cours des 12 derniers mois, trois associés de recherche expérimentés se sont joints à l’équipe, renforçant davantage ses capacités de recherche. Ce réinvestissement délibéré souligne l’engagement de l’équipe à maintenir le rendement, à approfondir l’analyse et à maintenir un avantage concurrentiel par rapport à ses pairs à long terme. Parallèlement, l’équipe met activement en œuvre le plan de relève de Gary Baker. Le 1er janvier 2026, Michael McPhillips a été nommé co-chef des placements aux côtés de M. Baker. Ils se partagent ainsi la responsabilité de la stratégie d’actions, de la gestion des portefeuilles et de l’orientation globale des placements. En 2027, Michael occupera le poste de chef des placements, tandis que Gary passera à un rôle-conseil, assurant ainsi la continuité, le mentorat et une transition harmonieuse. Michael s’est joint au conseil d’administration de CC&L en 2026, succédant à Gary.
Stratégies quantitatives d’actions
L’année 2025 a été solide pour l’équipe des Stratégies quantitatives d’actions. L’équipe a atteint ou dépassé les objectifs de valeur ajoutée dans l’ensemble de ses stratégies clés, s’appuyant sur des antécédents de rendement à long terme éprouvés, avec une croissance soutenue de la clientèle et des actifs sous gestion. Pour soutenir cette croissance, l’équipe a continué d’accroître ses capacités, passant à 92 membres, avec 21 nouveaux employés en 2025. Des professionnels en placement ont été ajoutés à l’ensemble des sous-équipes au cours de l’année, et les investissements dans les ressources de leadership des sous-équipes se poursuivront à un rythme semblable cette année. La croissance soutenue de l’équipe témoigne de la nécessité d’élargir et de réinvestir continuellement dans nos capacités, puisque la taille et la portée des activités de gestion quantitative ont augmenté. Par ailleurs, l’accent est demeuré mis sur la mise en œuvre de points de vue différenciés, avec une mise à jour du modèle de placement qui a été déployée avec succès en novembre.
Afin de soutenir les clients sur les marchés internationaux, nous avons élargi la structure de nos fonds en gestion commune. Cela comprend notre plateforme de fonds OPCVM établie en Europe et destinée aux investisseurs non américains, une plateforme de fiducie de placement collectif (CIT) aux États-Unis destinée aux régimes de retraite réglementés par l’ERISA, une plateforme aux îles Caïmans pour les investisseurs américains et d’autres investisseurs mondiaux admissibles, et une plateforme de fonds de sociétés en commandite pour les investisseurs américains admissibles. Cet investissement nous permettra de servir une clientèle plus vaste.
Solutions clients
Conformément à la croissance de nos activités, l’équipe des Solutions clients a continué de croître. Tim Elliott s’est joint à l’équipe en juin. Il occupait auparavant le poste de président et chef de la direction de Fonds Connor, Clark & Lunn Inc., une filiale spécialisée dans la gestion de patrimoine pour les particuliers qu’il a fondée au sein du Groupe financier CC&L il y a 15 ans. Tim a immédiatement eu une incidence positive sur nos activités, en apportant ses analyses et son expertise des marchés des services aux particuliers et de la gestion de patrimoine, et en renforçant le leadership au sein de l’équipe. Il est devenu actionnaire en 2026.
Investissement responsable
L’année 2025 marquait le passage d’une décennie depuis la création du comité ESG de CC&L. Par conséquent, notre conseil d’administration a jugé approprié d’entreprendre un examen du mandat et de la structure de gouvernance du comité. Le résultat de cet engagement a permis de confirmer que nous conservons la structure et les ressources appropriées pour atteindre nos objectifs en matière d’investissement responsable et de conclure qu’aucun changement important n’était justifié.
Nouvelles de l’entreprise
Actif sous gestion
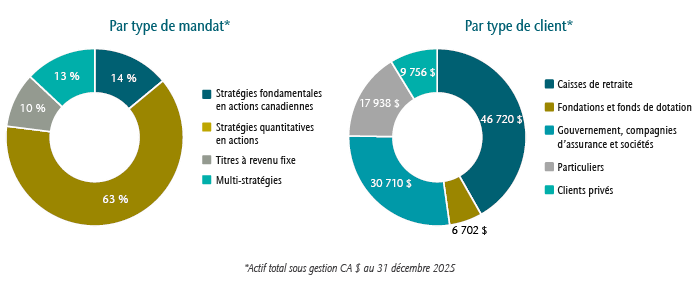
L’actif sous gestion de CC&L a augmenté de 35 milliards de dollars canadiens en 2025 pour s’établir à 112 milliards de dollars canadiens au 31 décembre 2025. Nous sommes heureux d’annoncer que notre activité s’est développée grâce aux mandats de nouveaux clients répartis dans toutes les équipes de placement. En 2025, CC&L a accueilli plus de 100 nouveaux clients et a obtenu 19 mandats supplémentaires de la part de clients existants. La plupart des nouveaux mandats visaient des stratégies quantitatives d’actions pour des investisseurs institutionnels mondiaux.
Nous sommes fiers de recevoir le prix Coalition Greenwich 2025 : Meilleur gestionnaire d’actifs pour les investisseurs institutionnels au Canada*. Ce prix reflète l’excellence pour ce qui est du rendement des placements et du service à la clientèle, selon l’indice de qualité Greenwich.
Mot de la fin
Nous sommes sincèrement reconnaissants de la confiance et du soutien de nos clients et partenaires d’affaires. Nous avons hâte de continuer à vous aider à atteindre vos objectifs de placement au cours des prochaines années.
* Tout au long de 2025, Crisil Coalition Greenwich a mené des entrevues auprès de 147 des plus grands régimes de retraite privés et publics, institutions financières, fonds de dotation et fondations au Canada et dans d’autres régions du monde. On a demandé aux principaux spécialistes de fonds de fournir des évaluations détaillées de leurs gestionnaires de placement, des évaluations des gestionnaires qui sollicitent leurs affaires et des renseignements sur les tendances importantes du marché. Gestion de placements Connor, Clark & Lunn n’a versé aucune rémunération à Crisil Coalition Greenwich pour ce sondage.