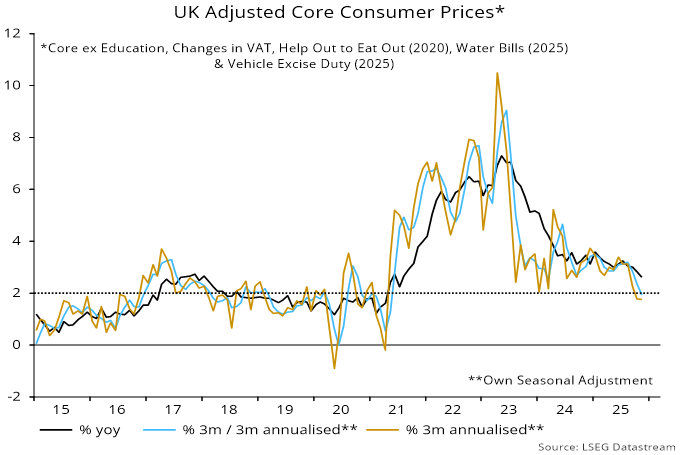
A measure of UK annual core CPI inflation excluding direct policy effects fell further to 2.6% in November, the lowest since July 2021 – see chart 1.
Chart 1

The measure adjusts for the imposition of VAT on school fees and bumper one-off rises in water bills and vehicle excise duty. It does not strip out the indirect impact of government actions, including national insurance and minimum wage rises.
Indirect policy effects continue to fade from shorter-term rates of change. The adjusted core measure rose at a 1.9% annualised pace in the three months to November from the previous three months, and by 1.8% between August and November – chart 2.
Chart 2
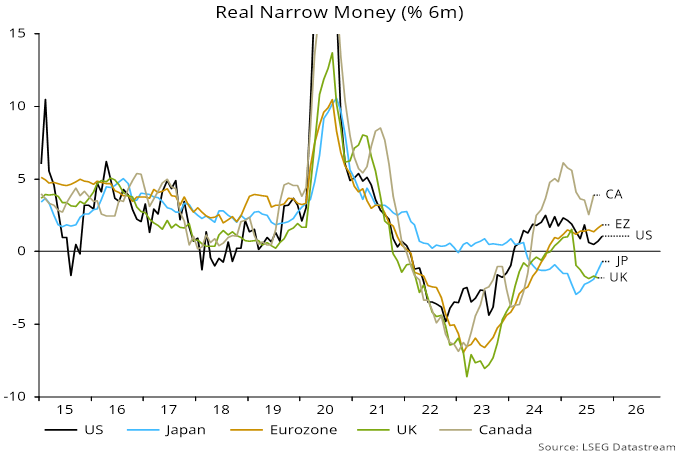
Favourable news, on the “monetarist” view, reflects the lagged impact of persistent monetary weakness.
Broad money – as measured by non-financial M4 – rose by an average 2.6% pa in the four years to October. Simple monetarism suggests that 4-5% growth is needed to support 2% inflation and trend economic expansion of about 1.5% pa, allowing for a trend velocity decline.
The rule of thumb is that money trends feed through to inflation with a roughly two-year lag. As previously documented, the median lead time with respect to core inflation in the UK has been longer, at about 2.5 years.
Transmission may have been further delayed on this occasion by 1) a monetary overhang from the 2020 money growth surge and 2) cost-push pressures from government policies.
A post last month suggested that annual CPI inflation would fall to c.2.25% in Q2 2026 (versus a November Bank forecast of 2.9%) and return to target during H2. Budget measures warrant a lowered profile. Inflation is now expected to reach 2.0% in Q2 and undershoot in H2.
Annual broad money growth remains weak (3.3%), so low inflation is likely to be sustained through 2027 barring an external shock or exchange rate collapse.
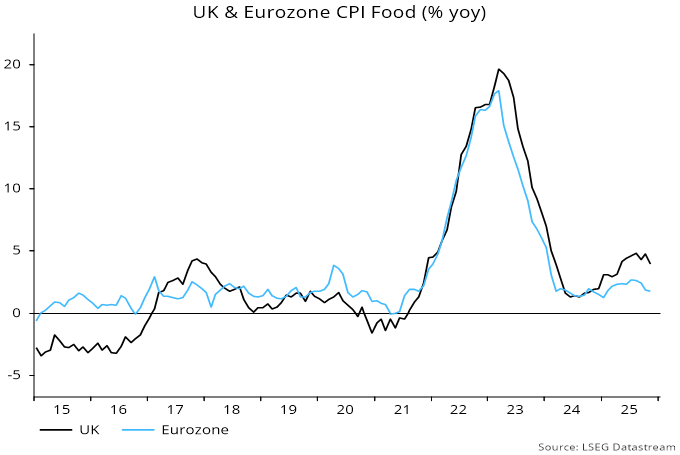
A slowdown in food, alcohol and tobacco accounted for half of the drop in annual CPI inflation between October and November. The previous post suggested that UK food inflation would break lower in 2026, based partly on an unusually wide UK / Eurozone gap. The differential remains at 2.2 pp (4.0% versus 1.8%), having been negative on average over 2015-19 – chart 3.
Chart 3