The stockbuilding cycle is on course to bottom soon and upturns have historically been associated with a procyclical shift in market behaviour. Several considerations, however, argue for caution about positioning for such a shift now. 

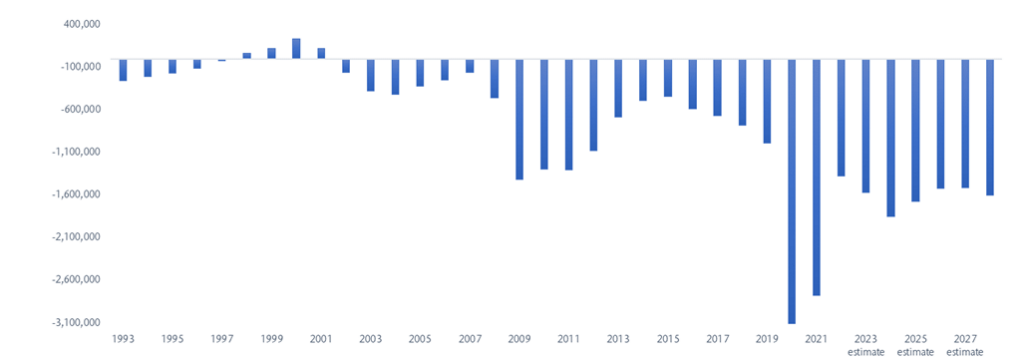
The key indicator used to monitor the cycle here is the annual change in G7 stockbuilding expressed as a percentage of GDP, shown in chart 1. Lows were reached every 3 1/3 years on average, which matches the 40-month periodicity reported by the “discoverer” of the cycle, Joseph Kitchin, in 1923. 

Chart 1

Chart 1 showing G7 Stockbuilding Cycle G7 Stockbuilding as % of GDP (yoy change)

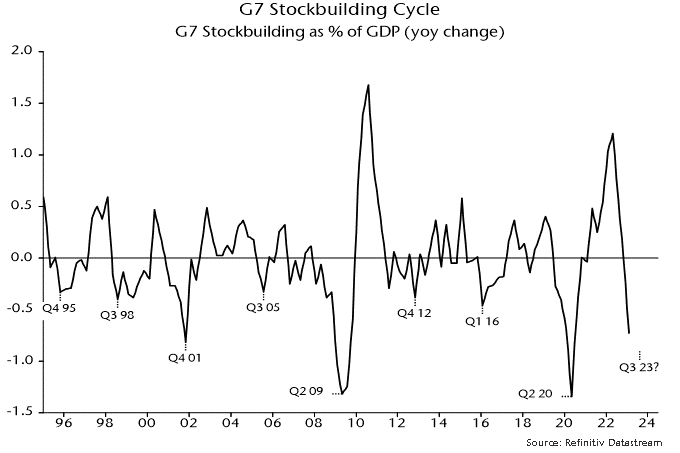
The stockbuilding cycle is a key driver of industrial fluctuations: the correlation coefficient of the above series and contemporaneous G7 annual industrial output growth over 1965-2019 was 0.75.

The last cycle low was in Q2 2020 so the next could occur in H2 2023, based on the average cycle length. Partial Q1 information – an estimate is included in chart 1 – indicates that the downswing is well advanced, consistent with the cycle entering a window for a low. 

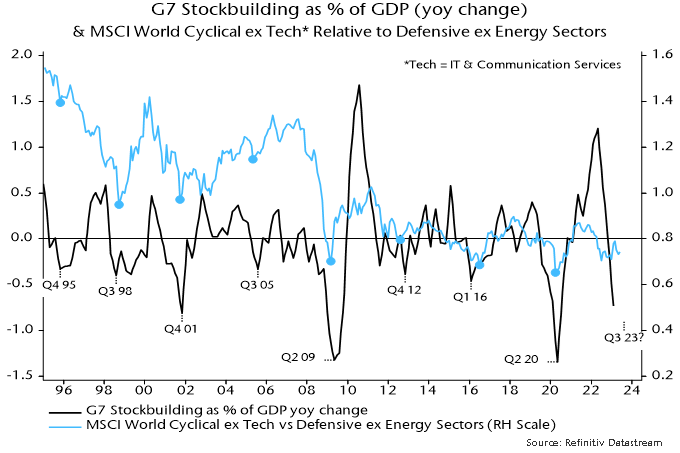
Cycle lows often mark a change in the market environment from risk-off / defensive to risk-on / cyclical, e.g. the price relative of cyclical equity market sectors versus defensive sectors has bottomed around the same time as the cycle historically – chart 2. 

Chart 2

Chart 2 showing G7 Stockbuilding as % of GDP (yoy change) & MSCI World Cyclical ex Tech* Relative to Defensive ex Energy Sectors *Tech = IT & Communication Services

So should investors start adding cyclical exposure? There are several reasons for caution. 

First, stockbuilding has fallen sharply but only to a “normal” level by historical standards. Further weakness seems likely given the extent of overaccumulation in 2021-23. 

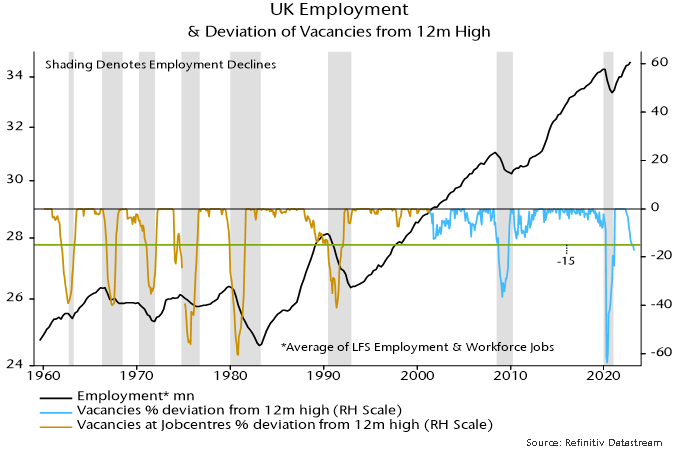
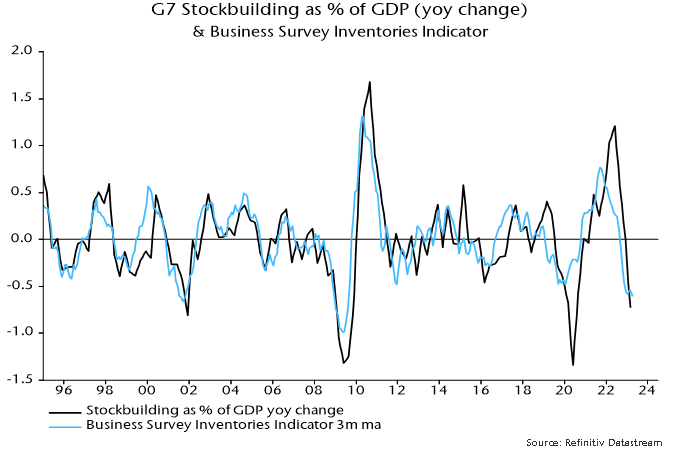
Second, a monthly inventories indicator derived from business surveys, which is more timely and usually leads by several months, has yet to signal a turning point – chart 3. 

Chart 3

Chart 3 showing G7 Stockbuilding as % of GDP (yoy change) & Business Survey Inventories Indicator

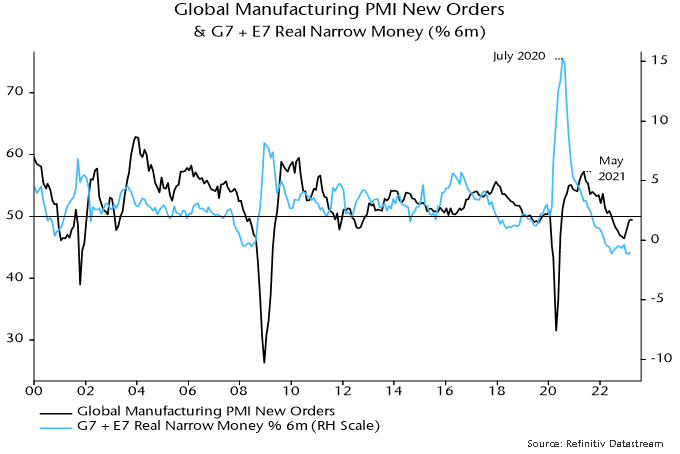
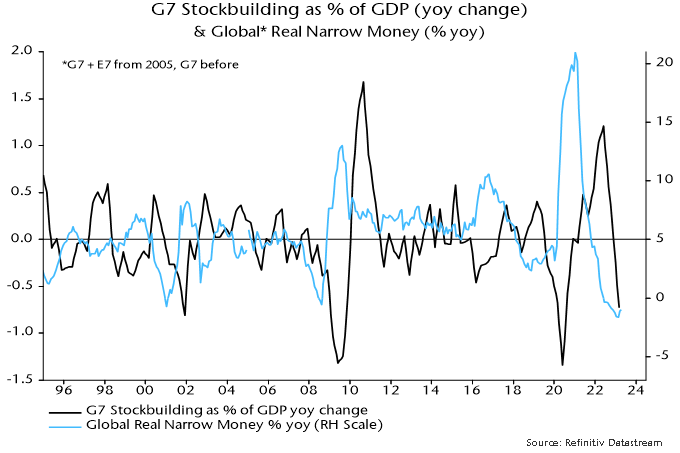
Third, and most importantly, stockbuilding cycle recoveries historically were preceded by a pick-up in real narrow money momentum, which remains very weak – chart 4. 

Chart 4

Chart 4 showing G7 Stockbuilding as % of GDP (yoy change) & Global* Real Narrow Money (% yoy) *G7 + E7 from 2005, G7 before

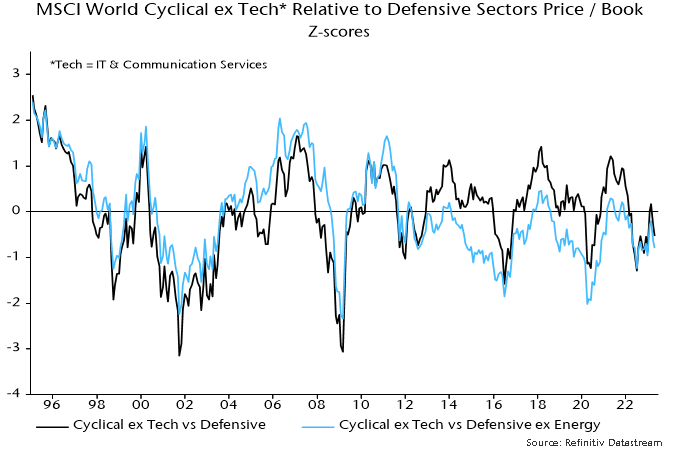
The price to book relative of non-tech cyclical sectors versus defensive sectors is below its long-run average but the divergence is smaller than at most recent stockbuilding cycle lows – chart 5. 

Chart 5

Chart 5 showing MSCI World Cyclical ex Tech* Relative to Defensive Sectors Price / Book Z-scores *Tech = IT & Communication Services

There is a risk of another bout of market weakness / cyclical underperformance as the stockbuilding cycle moves into a trough. The judgement here is that a revival in real money momentum is necessary to signal that a cycle low will be followed by a sufficiently solid recovery to boost cyclical assets.

It might be expected that G7 central bankers, in attempting to judge inflation prospects and the appropriate policy stance, would be paying close attention to indicators that signalled the recent inflationary upsurge.

Such indicators include:

  • Broad money growth, which led the inflation increase by about two years.
  • The global manufacturing PMI delivery speed index, a gauge of excess supply / demand in goods markets, which led by about a year.
  • Broad commodity price indices, such as the S&P GSCI, which displayed a sharp pick-up in momentum six to 12 months before the inflation upsurge.

Indicators that provided little or no warning of inflationary danger include measures of core price momentum, wage growth, labour market tightness and inflation expectations, i.e. indicators previously cited to argue that an inflation rise would be “transitory” and now being used to justify continued policy tightening.

Chart 1 shows G7 CPI inflation together with the three informative indicators listed above, with appropriate lags applied.

Chart 1

Chart 1 showing G7 Consumer Prices (% yoy) & Three Leading Indicators (Broad Money, PMI Delivery Speed & Commodity Prices)

The three indicators have fallen far below pre-pandemic levels, suggesting that CPI inflation rates will return to targets – or undershoot them – in 2024.

Core inflation and wage growth moved up more or less in tandem with headline inflation during the upswing. Hawkish central bankers need to explain why they expect an asymmetry on the way down.

A possible “monetarist” argument for inflation proving sticky is that the stock of money remains excessive relative to the price level. The judgement here is that any overhang is small and – with monetary aggregates stagnant / contracting – will soon be eliminated.

The G7 real broad money stock is 3% above its 2010-19 trend, down from a peak 16% deviation in May 2021 – chart 2.

Chart 2

Chart 2 showing G7 Real Broad Money (January 1964 = 100)

While agreeing on the destination, the indicators are giving different messages about the speed of decline of inflation.

The PMI delivery speed indicator and commodity prices are more relevant for goods prices, with recent readings consistent with the expectation here of goods deflation later in 2023.

Broad money trends, by contrast, suggest a temporary slowdown in the rate of decline of CPI inflation during H2, reflecting a stabilisation of money growth during H2 2001. This resulted from a reacceleration of US broad money following disbursement of a third round of stimulus payments.

A possible reconciliation is that the bulk of a fall in services inflation will be delayed until 2024. Such a scenario would suggest a slower reversal of policy rates and an extension of real money weakness, with negative economic implications.

Financial district in London at dusk with buses driving through.

The UK has historically been a region that attracts significant takeover interest. In this week’s commentary we look at the increase in activity this year, the reasons why and the potential long-term implications for the UK equity market. 

Several factors have contributed to foreign interest in the UK, including its strong presence in the financial and legal sectors, its industrial heritage, a sizeable consumer market and the widespread use of the English language.

Compared to other G7 economies, the UK government has historically been less inclined to intervene on national security grounds when faced with foreign bids for domestic assets. Between 1997 and 2017, despite accounting for only 3% of global GDP, the UK was involved in 25% of global cross-border merger activity. It is estimated that around 50 UK-based firms eligible for the FTSE 100 Index are now under foreign ownership.

For many years, UK equities have been trading at a larger discount compared to their US counterparts. This can be partly attributed to the differing composition of the respective stock markets. The UK has a larger allocation to lower price-to-earnings (PE) valuation sectors, such as energy and materials, which make up around 23% of the FTSE 100 compared to 7% of the S&P 500 Index. Conversely, information technology represents less than 1% of the FSTE 100 but accounts for 26% of the S&P 500. Even considering these factors, the discount had reached approximately 5% leading up to the Brexit referendum in 2016.

Following the momentous decision to leave the European Union, a “Brexit discount” was applied to UK companies to reflect the structural challenges they would face. Furthermore, recent political turmoil, including three prime ministers within a span of fewer than two months towards the end of 2022, has led to an increased risk premium. Consequently, the discount between UK and US stocks has surpassed 40%.

PE discount between UK and US stocks

Source: Bloomberg. S&P 500 Index was used as a proxy for US stocks; FTSE 100 Index was used for UK stocks.

It is evident that as the discount has grown, the frequency of foreign takeovers of UK companies has also increased significantly. According to the Office of National Statistics, the number of takeovers valued at £1 million or more was consistently between 100 and 300 annually for the 30-year period preceding the Brexit referendum. Since then, the number has exploded. 

This was evident in the first quarter of the year when the deal closed for one of our former UK holdings, Biffa plc (BIFF.LN). Another of our UK holdings, global flexible workspace provider IWG (IWG.LN), has previously attracted takeover interest, while Coats Co. (COA.LN), a global leader in threads, was acquired in the past and later delisted before being relisted a decade later.

A thriving stock exchange can benefit the economy and society as a whole. The capital provided by exchanges enables companies to grow which, in turn, means they employ more people and contribute more taxes for wider public services. However, the number of companies listed in London has almost halved from 2,101 in 2003 to 1,097 today. While this still leaves ample attractive opportunities for investment, the increase in takeovers is just one piece of the puzzle. Another factor has been the decline in new listings. Recognizing the need to adapt and attract more listings, the UK’s financial watchdog, the Financial Conduct Authority, has proposed measures aimed at enhancing the country’s appeal for domestic companies. This follows cases such as UK-based microchip giant Arm, owned by Softbank, opting to list in the US. While streamlining the listing process may remove certain barriers and improve competitiveness, it should not compromise shareholder rights.

The persistently low trading multiples of UK equities leave them susceptible to foreign takeovers. While Global Alpha does not base its investment theses solely on potential takeovers, we acknowledge that it has always been a potential tailwind for the small-cap asset class, and we anticipate heightened takeover activity in 2023. 

Cityscape of Guiyang at night, Jiaxiu Pavilion on the Nanming River. Located in Guiyang City, Guizhou Province, China.

Summary

  • EM equities were weak through April as the global economic backdrop continues to deteriorate.
  • Negative global excess money continues to feed a slowdown globally, along with falling inflation.
  • The global liquidity backdrop should become less negative as yields peak and industrial output begins to bottom. This should increasingly favour quality growth, tech and defensive (excluding energy) names.
  • China’s economy continues to buck the trend, enjoying a modest reopening bounce. However, this recovery may not be enough to offset weakness elsewhere in the world.
  • Chinese equities were down through the month and are flat for the year. Leading names in China this year have typically been SOEs boosted by government reform initiatives, banks and some energy names. Our favoured quality growth names have underperformed despite benefiting from the reopening and continue to trade at compelling valuations.
  • General elections in Thailand approach, with pro-democratic opposition parties poised to oust the military-linked conservative coalition.
  • Turkey is also set to hold presidential and parliamentary elections in May. President Erdogan is likely to face a stiff test from opposition coalition leader Kemal Kilicdaroglu, who has pledged to restore economic orthodoxy to address a deepening economic crisis. Political risk is high, with a return to Erdogan likely to court a currency crisis and add further pressure to the country’s strained banking system. 

Mixed signals from China’s reopening

The modest recovery in consumer spending and industrial activity this year has fallen short of investor expectations, with Chinese equities flat for the year. We agree recovery signals have been mixed, which aligns with our previous commentary flagging that authorities in China have been content with a gradual pick up as opposed to the V-shape boom that we saw in the West. Beijing is clearly wary of pouring excessive fiscal and monetary stimulus on the recovery lest it spark an outbreak of inflation.

The government has done little other than offer rhetorical support for business. The Politburo met in late April, with President Xi noting weak economic momentum and subdued demand. Policymakers kept their options open with respect to fiscal and monetary support, pledging a “forceful and effective” approach while reiterating that curbing speculation in property and taming local government debt remained high priorities. Following on from the two sessions last month where new Premier Li Qiang touted the party’s support of business, the Politburo provided another forum to pledge to restore business confidence through the “[elimination of] any legal, regulatory or hidden barriers preventing the fair competition and common development of enterprises of all ownership forms.” 

While the policy restraint may frustrate some China bulls, data from China’s Labour Day holiday at the end of April into early May suggests that Chinese consumers are back travelling and dining with a vengeance.

  • China Daily reported that on Friday, April 28, the day before the holiday started, train tickets departing Shanghai Hongqiao station to destinations nationwide were sold out.
  • Over the first three days of the holiday, approximately 160 million people travelled by air, road or waterway, an increase of over 162% versus the same period in 2022 (China Daily).
  • More than 240 million people were estimated to have travelled over the full five-day break, double the pre-COVID level in 2019 (Jefferies).
  • Domestic flights during the period are over 4x above 2022 levels (Jefferies).
  • Sales growth over the holiday period across catering, apparel, jewellery and tobacco were up 21.4%, 20.9%, 17.4% and 16.8%, respectively, versus 2022 (Jefferies).

NS Partners analyst Michael Zhang is currently travelling in China and sent us some photos of what he calls “revenge travel” over the holiday break.

The trend is positive but fragile – consumers are getting out but overall spending is still relatively weak – and monetary data remains supportive with additional scope for further easing should deflation risk emerge and external headwinds build.

Chile’s president looks to cash in on battery boom through lithium nationalisation

Chile’s government announced that it would seek to capitalise on the global battery boom by nationalising its lithium industry. The stocks of the two main Chilean lithium players, SQM and Albemarle, were hit by the news, with some investors fearing a repeat of the nationalisation of Chilean copper mines in 1971 by the socialist Allende government, where assets were seized from foreign miners without negotiation. The move was a disaster, as foreign engineers and investors left Chile, and just as a global recession in 1973 was about to precipitate a collapse in copper prices. Allende was ultimately ousted in a CIA-backed coup, and replaced by right-wing despot Augusto Pinochet.

This proposal illustrates the importance of factoring political risk and institutional quality into our process. While Boric risks kicking an own goal here, our analysis makes us relatively sanguine about prospects for the Chilean miners SQM and Albemarle, as the president must ultimately pass the law through a centre-right leaning Congress. The legislature is a key check on the ambitions of the president, illustrated by the rejection of a tax reform proposal in March and failure to implement a progressive constitutional reform in a plebiscite last year, with opposition led by right-wing congressional figures.

If the nationalisation plans were to pass through Congress, the government has committed to honouring existing contracts (SQM’s runs to 2030 and Albemarle’s to 2043), while encouraging the miners to negotiate state participation before expiry. It is likely that the miners will engage in and drag out negotiations on state participation as much as possible, while they generate supernormal profits at these elevated lithium prices.

While the market reaction on the news was an overshoot, we were not tempted to add to our exposure. Lithium price strength will ultimately incentivise significant new supply to come online across South America and Australia in the coming years. Additionally, we are happy to maintain an underweight to commodities broadly, based on our outlook that weak global liquidity will feed an economic hard landing that drags on commodities.

Commentators have expressed scepticism about a large monthly fall in the “experimental” PAYE employees measure in April (136,000 or 0.45%, equivalent to a 700,000 drop in US non-farm payrolls).

It is true that initial estimates are often revised significantly but the largest upward adjustment to the month-on-month change historically was 121,000, relating to a pandemic-distorted month (March 2021*). The mean absolute revision over the last year was 34,000.

The recent trend, moreover, has been for downgrades – the initially estimated month-on-month change has been revised lower for five of the last six months.

The reported fall is consistent with the latest KPMG / REC Report on Jobs: the permanent placements index in April was the lowest since the start of 2021 and the PAYE measure last declined in February 2021 (based on current vintage data).

The regional breakdown of the PAYE measure shows falls in all 12 regions, with the largest (1.0%) in London – also consistent with the Report on Jobs, which reported that permanent placements weakness was led by London.

As the chart shows, the PAYE employees measure correlates with the quarterly employee jobs series, which has “official” status but is less timely – an end-Q1 number will be released next month. (This series, like US payrolls, counts positions rather than people.)

Chart 1 showing UK Employee Jobs, Payrolled Employees & Vacancies *Single Month, Own Seasonal Adjustment

The Labour Force Survey employment measure rose by 182,000 in the three months to March from the previous three months but self-employment and part-time employees accounted for the increase – the number of full-time employees fell.

post last week suggested that employment would begin a sustained decline in Q2, based on recent weakness in vacancies. The official vacancies series – a three-month moving average – fell again in April. The single-month number calculated here is now down 20% from peak (April 2022), with the month-on-month decline accelerating last month. (The FT incorrectly reported that vacancies stabilised in April.)

Another labour market report is due before the MPC’s next meeting on 22 June. Confirmation that employment is on a falling trend would transform the policy debate.

*The revision to the month-on-month change reflected a downgrade to the level of employment in February, not an upgrade to March.

The capital dome illuminated after dark in Washington DC.

In recent years, the U.S. federal government’s debt and deficit have been hot topics in the news. The term “debt ceiling” has once again made headlines after Treasury Secretary Janet Yellen warned that the U.S. government could run out of money by June 1. It’s important to understand what the debt ceiling is, why it needs to be raised and how it can impact financial markets.

What is the debt ceiling?

The debt ceiling is the maximum amount the U.S. Treasury can borrow from the public and governmental accounts. Governments, like individuals, must borrow money when they spend more than they earn and they do so by issuing bonds.

The U.S. has had a debt ceiling for over 100 years, first established in 1917 at $11.5 billion. Prior to this, Congress authorized the government to borrow a fixed sum of money for a specified term. After the loans were repaid, the government could not borrow again without asking Congress for approval.

The debt ceiling was created in 1917 under the Second Liberty Bond Act to make it easier to finance WWI. It allowed for a continual rollover of debt without congressional approval. However, increasing government obligations have led to rising government debts to make up the shortfall between tax revenue and government spending.

What are the issues with raising the limit?

To issue more bonds, the U.S. Treasury must increase the debt ceiling. This has been done without incident for decades, with policymakers raising the limit 89 times since 1959. Most recently, in December 2021, the debt ceiling was raised by $2.5 trillion to $31.4 trillion, projected to fund obligations through mid-2023.

US debt ceiling raises keep pace with the growing national debt (in billions of US$)

Sources: U.S. Department of the Treasury, U.S. Office of Management and Budget.

Debates surrounding the debt ceiling have become more contentious in recent years. Disagreement has led to two federal government shutdowns in the late 1990s and a 2011 fight that resulted in volatile financial markets and Standard & Poor’s downgrading of the U.S. government’s credit rating for the first time in history. In addition to political reasons, resistance against raising the debt limit has often come from concerns about the sustainability of the massive government debt balance.

The current public debt outstanding is $31.457 trillion, with each U.S. citizen’s share being around $95,000. Economists and government officials often cite the debt-to-GDP ratio, which measures how much of the annual production would be required to pay off the public debt. The U.S. government’s debt-to-GDP ratio of 148% ranks the fourth highest globally, after Japan, Greece and Italy.

What is the likelihood of the U.S. repaying its debt?

In recent decades, the U.S. government has been in deficit almost every year, except for a surplus between 1998 and 2001. It is projected that the government will continue to run deficits until at least 2028, making it unlikely that the government will be able to repay any debt in the foreseeable future. Instead, more debt will likely be added.

US government surplus of deficit, 1993 – 2028 (dollar amounts in billions)

Source: Congressional Budget Office website.

Until recently, the cost of issuing debt to finance federal operations was minimal. However, with rising interest rates, the average interest rate on federal debt has risen to 2.07% in 2022 from 1.6% in 2021. The Congressional Budget Office estimates that interest costs will triple to $1.3 trillion in 2032, becoming the largest federal budget item and surpassing Social Security and Medicare by the middle of the century.

These developments raise concerns that the world’s largest economy may not be able to meet its financial obligations. As a result, the credit default swap (CDS) against a U.S. government default has risen sharply since the beginning of 2023. On May 4, one-year U.S. government CDS reached 152 basis points (bps), up from 10 bps a year earlier and the highest since the 2008 financial crisis. Although the U.S. has never defaulted on its debt, investors are becoming increasingly anxious about the possibility.

What could happen if the U.S. debt ceiling is not raised?

The U.S. government would be unable to borrow money to finance critical obligations, such as Social Security, tax refunds and federal workers and military salaries. This would result in a severe stock market decline and could damage the reputation of the U.S. as a reliable business partner. Interest rates would skyrocket, potentially causing a U.S. or global recession. The dollar may lose its status as the global reserve currency and drop significantly in value.

While the government could resort to temporary financial measures, such as minting a $1 trillion platinum coin, a more sustainable solution is required to address the gap between revenue and spending. This could involve increasing tax rates, reducing expenditures or both.

The debt issue, combined with the tightening credit cycle following the banking crisis, means that borrowing to fuel growth will become increasingly challenging and expensive. Companies with high leverage may face higher interest burdens.

Evaluating financial health to deliver long-term value

We believe investing in companies with strong financial positions, diversified revenue streams, good profitability and no reliance on government subsidies for growth is essential. We take a disciplined approach to investing and carefully evaluate the financial health of the businesses we invest in. Half of the companies in our International Small Cap strategy and a third in our Global Small Cap strategy are in a net cash position. Our portfolios are well positioned to weather economic uncertainties, with a focus on delivering long-term value to our clients.

UK vacancies – like US job openings – are signalling an employment recession. 

A previous post noted that a fall in US job openings of more than 15% from a rolling 12-month high was always (since the 1950s) associated with a multi-month fall in payrolls. The 15% threshold was crossed in February data released last month, with the shortfall increasing to 18% in March.

It turns out that the 15% rule also works in the UK, correctly signalling all eight employment recessions since the 1960s with no false warnings. Recent developments mirror the US: the decline in vacancies from peak crossed 15% in January, rising to 17% in March.

The official vacancies series, based on a survey of employers, starts in 2001. Earlier numbers are available (back to 1960) for vacancies notified to Jobcentres. When the latter series was replaced in 2001, Jobcentre vacancies accounted for about 60% of the total. The analysis here combines the two series, effectively assuming that Jobcentre vacancies were a constant proportion of the total before 2001.

Employment recessions were defined as multi-quarter declines in an average of two series – total employment (from the Labour Force Survey of households) and workforce jobs (based mainly on a survey of employers). The latter series – like US non-farm payrolls – counts positions rather than workers and is about 10% larger, reflecting multiple job holding. 

As in the US, the 15% threshold was usually reached around the time that employment started to decline, although this may not have been immediately apparent because of reporting lags and revisions.

A Q1 reading of the total employment series is not yet available but LFS data through February and PAYE employee numbers suggest another rise. Based on the vacancies signal, a sustained decline may begin in Q2.

Chart 1 showing UK Employment & Deviation of Vacancies from 12m High

The global manufacturing PMI new orders index – a timely indicator of global goods demand – was little changed below 50 (49.4) in April, a weaker result than had been suggested by DM flash results. 

Inventories indices for finished goods and production inputs, meanwhile, rose further to their highest levels since November. Accordingly, new orders / inventories differentials – which often lead at turning points – fell for a second month. 

These results are consistent with the forecast here that a recovery in PMI new orders since December 2022 would fizzle out in H1 and reverse into H2, with a possibility of a break below the December low. The basis for the forecast was a relapse in global (i.e. G7 plus E7) six-month real narrow money momentum around end-2022. Real money momentum moved sideways in March at around its June 2022 low – see chart 1.

Chart 1

Chart 1 showing Global Manufacturing PMI New Orders & G7 + E7 Real Narrow Money (% 6m)

A downswing in the stockbuilding cycle was a key driver of earlier PMI weakness. A further drag is in prospect but the down phase of the cycle is well advanced, with incoming data and average cycle length suggesting a low during H2. 

Business capex is emerging as a new source of global goods demand weakness. The capital goods component of PMI new orders reached a new low in April – chart 2. 

Chart 2

Chart 2 showing Global Manufacturing PMI New Orders

A contraction in business investment is consistent with a squeeze on real profits in late 2022 – chart 3 – and weak corporate money trends: business broad money holdings have fallen in nominal terms recently in the US, Eurozone and UK – chart 4. 

Chart 3

Chart 3 showing G7 Business Investment (% yoy) & Real Gross Domestic Operating Profits (% yoy)

Chart 4

Chart 4 showing Broad Money Holdings of Business / Corporations (% 6m)

Other evidence of a capex downturn includes: 

  • Weak capex intentions in regional Fed manufacturing surveys (and the NFIB small firm survey) – chart 5.  
  • Weak enterprise loan demand for fixed investment in the ECB bank lending survey – chart 6.  
  • Falling capital goods / machinery orders in the US, Japan and Germany – chart 7.

Chart 5

Chart 5 showing US Non-Residential Fixed Investment (% yoy) & Regional Fed Expected Capex Average* *Average of Dallas, Kansas, New York, Philadelphia & Richmond

Chart 6

Chart 6 showing Eurozone Non-Residential Fixed Investment (% yoy) & ECB Bank Lending Survey, Loan Demand from Enterprises for Fixed Investment

Chart 7

Chart 7 showing Capital Goods Orders January 2015 = 100

Capex retrenchment is usually accompanied by a fall in labour demand. Adjusted for negative revisions to the prior two months, the addition to US non-farm payrolls in April was 104,000, the smallest since January 2021 – chart 8. Revisions in the last three reports cumulate to -200,000, a level rarely reached outside recessions – chart 9.

Chart 8

Chart 8 showing US Non-Farm Payrolls Change (000s) First Estimate Actual & Adjusted for Revisions to Prior 2 Months

Chart 9

Chart 9 showing US Non-Farm Payrolls Change Revisions to Prior 2 Months (000s)
Biofuel storage tanks at a power plant.

Earlier this month, we attended a conference in San Francisco that focused on various carbon removal technologies, including direct air capture, land-based carbon removal and enhanced mineralization. The conference had over 650 participants, with 130 of them being corporates from both private and public companies that are working toward reducing carbon emissions. The number of start ups in this space has grown exponentially in the last couple of years and the United States is becoming a leading global carbon capture centre.

The Inflation Reduction Act (IRA), passed in August 2022, has created favourable conditions for carbon capture technology deployment in the U.S. The most notable provision is the 45Q tax credit for CO2 storage, which aims to promote carbon capture utilization and storage (CCUS).Companies providing direct air capture technologies have grown from only three start ups a couple of years ago to over 60 today. One of the reasons for this is the attractive credit of US$130 per tonne of CO2 captured and stored.

We also learned more about the Department of Energy’s Loan Programs Office (LPO), which grants debt capital to companies providing clean energy services and infrastructure. Over the last decade, this office has already issued over US$38 billion, with billions more available for future funding. The LPO is focused on providing capital in three main areas:

  1. Title 17 Clean Energy Loan Program to accelerate the commercial deployment of innovative energy technologies.
  2. Advanced Technology Vehicles Manufacturing Direct Loan Program to promote local manufacturing of more fuel-efficient and clean vehicles.
  3. Tribal Energy Loan Guarantee Program to support the investments into energy projects for federally recognized tribes.

Many companies that will benefit from the IRA are also eligible to receive additional debt financing if they meet any of the LPO’s three programs, unlocking capital to deploy into clean technologies. With the amount of capital pouring into clean energy sectors, it is definitely an exciting time to follow the sector.

Although carbon capture is a difficult area to gain exposure to in public markets, there are a few public companies that have internally incubated such technologies. One such company is Advantage Energy Ltd. (AAV CN), which we currently own and had the opportunity to meet at the conference. Advantage is an Alberta-based natural gas and light oil producer that has started a subsidiary clean-tech company, Entropy, providing modular carbon capture and storage technology. Advantage owns 85% of Entropy, with Brookfield Renewable being the other strategic owner.

Entropy’s carbon capture technology is already in operation at Advantage’s Glacier Gas Plant and has a capture rate of 90% to 95% of post-combustion flue gas. With the addition of the technology, Advantage’s carbon emissions at that specific plant have fallen by about 15%, resulting in a CO2 savings of about 47,000 tonnes annually. This helps make the company one of the lowest emission intense producers compared to its peers.

The carbon capture process involves capturing the CO2 from the flue gas stream emitted by the plant, processing it by scrubbing it with a chemical solvent and then storing the captured CO2 permanently deep underground. The process is illustrated in the figure below.

The post-combustion carbon capture technology is a strategic advantage for Entropy and the company is a key asset for Advantage Energy. Currently, there are only two operating post-combustion carbon capture projects in the world. The post-combustion technology can be retrofitted to existing energy-generating assets, which is the market the company aims to serve through its capital-light licence and support model, in addition to developing, owning and operating carbon capture units. Moreover, Entropy uses its proprietary solvent called Entropy23 that allows for lower input and operating costs due to its superior chemistry developed in-house. 

Currently, Entropy is benefiting from Canada’s investment tax credit of 50% for carbon capture equipment, but it is also expanding its team to focus its commercial efforts in the U.S. to benefit from the IRA. Recently, the company announced a first memorandum of understanding with California Resources Corporation, in which Entropy will provide technology, engineering and development services to decarbonize gas-fired boilers, avoiding about 400,000 tonnes of carbon annually. 

Aurubis AG (NDA GY), Europe’s largest copper producer and the world’s largest copper recycler is worth mentioning for its commitment to reducing its carbon footprint. Copper smelting is a heavy emitting activity but critical for the energy transition as we have highlighted in a previous note. The company has set Science-Based Targets with a goal of 1.5-degree alignment by 2030 and is piloting the use of blue ammonia in its production process for copper rods at its Hamburg facility. The carbon dioxide by-product from blue ammonia production is captured and stored underground. If successful, Aurubis will permanently switch to blue ammonia, potentially saving 4,000 tonnes of CO2 annually.  

The opportunities in the carbon capture space are extremely attractive, with both policy and capital driving growth. We are confident that Advantage and Aurubis will benefit from them in the future while providing critical technology in helping it and other companies achieve net-zero goals. 

PETRONAS Twin Towers in Kuala Lumpur, Malaysia.

The strategy saw strong contributions from holdings in ASEAN (Indonesia, Malaysia, and the Philippines) and the Middle East in the quarter. However, this was offset by losses in the Africa portfolio. As we have written about in previous letters, we have been actively reducing the strategy’s exposure to Africa (specifically Egypt and Kenya) and increasing it in ASEAN and the Middle East (Saudi Arabia and the United Arab Emirates). African economies are undergoing severe macroeconomic headwinds that have overwhelmed equity returns and exerted pressure on earnings. Conversely, ASEAN and Middle Eastern economies have been performing reasonably well, allowing us to harvest healthy USD equity returns through earnings growth and multiples expansion.  

Continuing with the above theme, we decided to fully tender out the strategy’s shares in East African Breweries Ltd. (EABL) to Diageo PLC at a price of Ksh192/share (compared to the Ksh170/share price as of the date of this letter). While Diageo paid a premium of 35% versus the one-year average (at the time of the “intention to acquire” announcement in October 2022), the deal multiples were highly favourable to Diageo at ~14x 2023 earnings, a substantial discount to emerging and frontier market brewers. We tendered out at these low multiples due to two factors: first, there are limited incremental buyers for EABL given the macroeconomic environment and stock market illiquidity in Kenya; second, the Diageo bid presented a relatively lucrative way for us to reduce exposure to Africa, in line with our strategy. Following the deal, EABL will remain listed on the Nairobi Stock Exchange with Diageo’s ownership now up to 65%, from just over 50% pre-tender. We will continue to monitor EABL and potentially re-enter the stock once the economic environment in Kenya settles.  

The strategy was very active during the quarter in both ASEAN and the Middle East. In ASEAN, we invested in CTOS, Malaysia’s leading private credit reporting agency, which holds over 70% of the country’s credit reporting market. Due to the high barriers to entry in this industry, market leaders like CTOS are likely to sustain their position as they continue to compound their data sets and create new use cases for their customers. Malaysia is a particularly underpenetrated market for credit reporting, as financial institutions still rely heavily on their internal data to underwrite credit. Malaysia is interesting because financial inclusion is high at around 95%, yet 65% of the population still does not have a regulated credit account. As financial sophistication grows and credit compliance requirements tighten, demand for CTOS’s services should increase significantly. With scale and technology that enables it to generate operating income margins of ~40%, we expect CTOS to achieve ~20% growth for the next few years. We have followed CTOS since it listed on the Bursa Malaysia in July 2021, but had reservations on its valuation and the previous management team, who we thought were brought on just to list the company rather than the focus on generating long-term value. When the previous CEO left the company, we went to Kuala Lumpur to meet with the new CEO, Erik Hamburger, a former executive at Experian, who articulated a growth strategy around product development, digital strategy, and sales initiatives that we thought, if well executed, would unlock tremendous value for shareholders. With a positive view on the company and management, it was a case of waiting for a valuation opportunity to open, which finally happened in this quarter.  

The strategy also invested in Al Ansari Financial Services (AFS), a UAE-based remittance and currency exchange house that is a leader in the second-largest market remittance market globally (after the U.S.). AFS focuses primarily on small-ticket money flows from the UAE to countries in Asia (example: Philippines), Sub-continent (India and Pakistan), and the Middle East and North Africa (Jordan and Egypt). AFS focuses primarily on small ticket remittance flows, a market that banks are strategically not interested in, and that fintechs have found difficult to penetrate. For context, the company reports that 67% of the remittances it facilitates are less than $400 per transaction. AFS has a robust offline network in 226 carefully selected locations across the UAE, which captures monthly remittance flows from blue-collar and underbanked white-collar workers. This offline network is supported by a strong online presence, where it has a top ranked app that processes 41% of personal digital outward remittances among exchange houses. AFS’ management have executed well, deepening the company’s competitive advantage, and translating that to operating margins of ~50%, on healthy mid-teens top line growth.

Despite the softer performance during the first quarter, we remain constructive on the strategy’s outlook. We believe the current environment is conducive to stock pickers, with valuations as attractive as they’ve been since we launched the strategy in 2018. Moreover, the economic environment is expected to deepen the competitive edge of portfolio companies in their respective markets. 

As we have done in previous letters, we sign off by reminding our investors that our objective is to deliver differentiated returns that are attributed to investing skill (alpha) rather than market directionality (beta). We believe there are abundant alpha opportunities in frontier and emerging markets, which we choose to express through a concentrated but geographically diverse portfolio of companies with idiosyncratic earnings drivers and share-price catalysts. While there may be significant deviations from global and emerging market indices in certain periods, the hope is that our approach will provide a superior risk-adjusted return profile to investors over the long term. 

Vergent Asset Management LLP