Whisper it softly but Eurozone economic prospects are improving.

Six-month momentum of real non-financial M1 turned positive in October, reaching a three-year high in November. The recovery has been broadly-based across countries, with German momentum slightly above the Eurozone average – see chart 1.

Chart 1

Chart 1 showing Germany Ifo Manufacturing Business Expectations & Eurozone / Germany Real Narrow Money (% 6m)

The sectoral breakdown shows that real M1 deposits of both households and non-financial corporations have returned to growth – in contrast to the UK, where corporate narrow money is still contracting, in nominal as well as real terms.

Economic news supports further policy easing. Six-month headline / core CPI momentum is close to target (2.1% / 2.2% annualised respectively in December) and there are signs of labour market softening, including a pick-up in consumer unemployment expectations – chart 2.

Chart 2

Chart 2 showing Eurozone Unemployment Rate & Consumer Survey Unemployment Expectations

The Swiss National Bank started cutting rates in March, three months before the ECB, with the cumulative reduction now 125 bp versus 100 bp in the Eurozone. Swiss six-month real narrow money momentum is stronger and likely to be matched by the Eurozone soon – chart 3.

Chart 3

Chart 3 showing Real Narrow Money (% 6m)

The UK is lagging because the backward-looking MPC started later with cuts of only 50 bp. A stall in six-month real narrow money momentum from last spring signalled that the economy was heading for renewed stagnation well before the end-October Budget.

Improving Eurozone economic prospects may partly explain a spate of upgrades to corporate earnings forecasts by equity analysts. A positive January revisions ratio contrasts with negative readings in the US / UK and supports the monetary suggestion of a recovery in manufacturing surveys – chart 4.

Chart 4

Chart 4 showing Germany Ifo Manufacturing Business Expectations & MSCI EMU Earnings Revisions Ratio (IBES, sa)

Gambling hand holding two playing cards.

This month, NS Partners fund manager Luis Alves de Lima writes on navigating a volatile backdrop in Brazilian equities, and the huge potential this market offers if political risks ease.

Imagine a game of blackjack. Not your typical duel in the bowels of a dark casino, but a game of chance steeped in the vibrant hues of Brazil’s economic landscape. This is a game where the potential rewards are tantalizingly high, but the risks, like the Amazon rainforest, are dense and unpredictable. Like a card counter, we watch carefully as each card is dealt – investigating companies and assessing the macro backdrop – to formulate a running count of the deck and calculate our odds of hitting 21.

The ace in this deck represents the transformative power of political change. A conservative victory in the 2026 federal elections could usher in an era of fiscal responsibility, market-friendly policies and renewed investor confidence. Drawing this ace could yield a multi-bagger return as Brazil sheds its “risk premium” and the investment narrative flips from basket case to market darling. That doesn’t mean you won’t be wiped out before the ace arrives.

As we count, the deck is stacked with low number cards (2-6) – embodiments of lurking macro uncertainties – with the ability to wipe out your hand. Brazil’s fiscal deficit, stubbornly high cost of capital and the ever-present spectre of political volatility loom large. Playing aggressively to a deck loaded with low number cards favours the dealer’s odds, much like the potential downside risks that could erode investment value when macro is deteriorating, but valuations are yet to catch down.

The high cards (10, Jack, Queen and King), represent the underlying strengths of the Brazilian economy (all high cards are worth 10 points, with the ace either 11 or 1 depending on what’s best for the player’s hand). These cards increase your chances of winning if low number cards are dealt out of the deck and the proportion of high cards increases. The low cards in Brazil are coming out as the clock ticks on socialist president Lula’s term, with elections in 2026. While an increasing proportion of high cards does not offer an immediate payout in our game, it does suggest an investment environment where the player/investor can soon lift their bets in line with improved conditions and chances of upside surprise increasing.

Investing in Brazil today is a calculated gamble with ever-shifting odds. While the macro and political backdrop seems daunting, low cards are exiting the deck as pessimism runs to an extreme and fails to reflect the true potential of the market. While future outcomes remain uncertain, we see a disconnect between strong company fundamentals and depressed valuations. The “true count,” the extent to which a deck favours the dealer or player (investor), will swing in the latter’s favour as political risks ease. The probability of making it to that elusive ace rises.

My recent virtual roadshow with 20 Brazilian companies painted a picture of resilience and growth. Companies like Grupo GPS, Rede D’Or and Lojas Quero-Quero are demonstrating robust financials, exceeding growth expectations and trading at inexplicably low valuations. I have also planned a trip to Brazil next month to continue the mission of finding when the ace might appear in this high-stakes game. It’s an opportunity to delve deeper into the dynamics of the Brazilian market, gather firsthand information and assess the true probabilities beyond the abstract numbers.

Investing in Brazil today requires a contrarian mindset; an ability to understand the macro risks and direction of travel and weigh this against what we are seeing on the ground as we engage with companies. It’s a game for those who understand risk and can calibrate their bets as the odds shift for or against them. As any seasoned player knows, ignoring the headlines and acting with conviction when the true count tilts in your favour is when the most lucrative bets can be made.

A person jumping from one steep cliff to another over a sunset sky.

Coming off a good year for markets, we entered 2024 with geopolitical risks and high inflation at the forefront of investors’ minds and a myriad of concerns about what could go wrong. Despite some turbulence along the way, markets defied the concerns with US and global equity markets delivering particularly strong returns for 2024. This review delves into how the various key asset classes performed, as well as considerations for 2025 and longer term.

Equities – the technology titans charge on

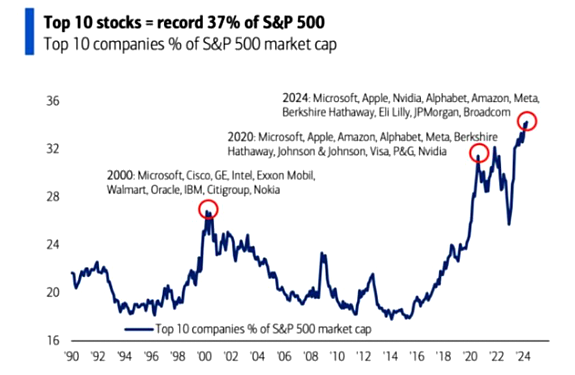
Once again, equity return headlines were dominated by US technology stocks with the Magnificent 7 stocks – Alphabet (Google), Amazon, Apple, Meta Platforms, Microsoft, Nvidia, and Tesla – continuing to drive US and global equity markets higher with investor exuberance around the merits of artificial intelligence. Over the last decade, the market capitalization of these seven stocks has significantly grown, with their representation in the S&P 500 Index more than tripling from a decade ago (Figure 1).

Figure 1 – Growth of the Magnificent 7 as a percentage share of the S&P 500 Index

Bar chart showing growth of the Magnificent 7 as a percentage share of the S&P 500 Index.
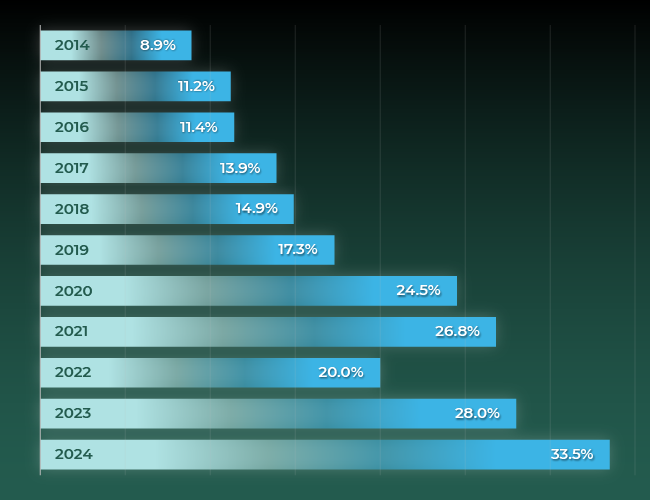
Source: Bloomberg & S&P

US equities represent the largest individual component of most investors’ portfolios, so with the increased level of concentration, portfolio risk management should remain a key focus for investors heading into 2025. This is not to say the US technology sector will not continue to perform well, but 2022 was a reminder of how technology stocks can materially underperform in less favourable environments. The Magnificent 7 dropped from almost 27% of the share of the S&P 500 Index at the end of 2021 to 20% at the end of 2022.

Equities overall deliver good returns

Figure 2 summarizes 2024 calendar year CAD returns for several major equity indices.

Figure 2 – 2024 equity returns (%)
Canadian Equity S&P / TSX Capped Composite Index 21.7
US Equity S&P 500 Index 36.4
International Equity MSCI EAFE Index (net) 13.2
Emerging Markets Equity MSCI Emerging Markets Index (net) 17.3
Global Developed Equity MSCI World Index (net) 29.4
Global Equity MSCI ACWI Index (net) 28.1
Global Equity Small Cap MSCI World Small Cap (net) 18.0

Source: Bloomberg, S&P & MSCI

The US equity market was well ahead of the rest of the major developed markets and followed a 22.5% return in 2023. For context, 1997 – 1998 was the last time the US stock market closed out a second straight calendar year with a leap of at least 20%. The strength of the US equity market has also resulted in its increased representation in global equity benchmarks, such as the MSCI World Index. The international equity market trailed other major markets in 2024, impacted by weaker returns from the UK and Europe offsetting the strong returns from Japan equities. While emerging markets delivered 17.3% for the year, China equities was a standout performer within the region, up over 30%.

Fixed income – duration drag

In 2024, the headlines for fixed income markets were focused on how global central banks would react to reducing interest rates in tackling higher inflation. The economic conditions led to several rate cuts throughout the year. However, at various times during the year, fixed income yields rebounded amid concerns about the level of inflation. Figure 3 summarizes 2024 calendar year returns for several fixed income indices.

Figure 3 – 2024 fixed income returns (%)
Cash FTSE Canada 91 T-bill Index 4.9
Universe Bonds FTSE Canada Universe Bond Index 4.2
Long Term Bonds FTSE Canada Long Term Overall Bond Index 1.3
High Yield Bonds Merrill Lynch US High Yield Cash Pay BB Index 10.5

Source: Bloomberg, S&P, Merrill Lynch & FTSE

High yield strategies led public fixed income calendar-year returns. Despite the decline in short-term rates over the year, cash markets delivered healthy returns with the FTSE Canada 91 Day T-bill Index up 4.9%. Within the fixed income component, investors such as Indigenous Trusts, endowments and foundations are typically invested across the maturity spectrum in a combination of short-, medium- and longer-term fixed income investments, such as strategies benchmarked to the FTSE Canada Universe Bond Index. The Universe Bond index returned 4.2% for the calendar year.

Lower longer-term return on the horizon

The current yield of the Universe Bond Index provides a reasonable indicator of expected long-term returns. Figure 4 shows the universe bond yield over time (light blue line), as well as the actual subsequent absolute 10-year returns, represented by the dark blue line. There is a strong correlation between the two lines, suggesting the end of 2024 yield of 3.6% is a reasonable indicator of the expected return of universe bonds over the next 10 years.

Figure 4 – Universe Bond yields versus subsequent 10-year returns
Line graph showing Universe Bond yields versus subsequent 10-year returns.
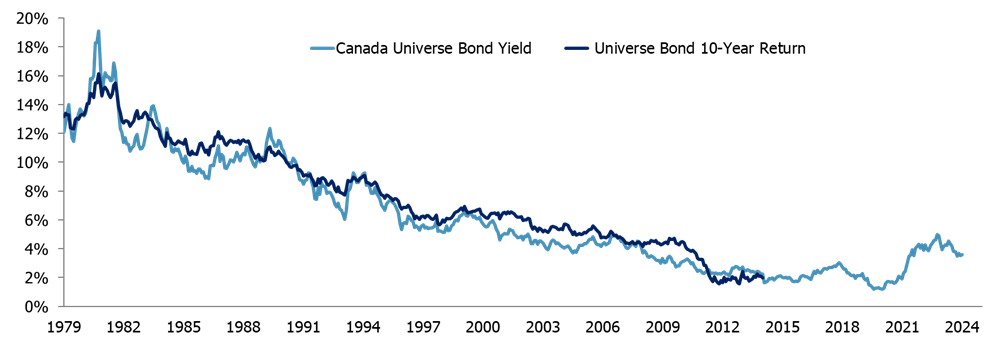
Source: Bloomberg & FTSE

From a return perspective, given the potential for a lower longer-term Universe Bond Index return, higher yielding strategies, such as high yield debt, emerging market credit, commercial mortgages, and private credit may see increased interest from investors who are looking to enhance fixed income returns.

From a risk management perspective, we expect to see continued interest in absolute return fixed income solutions. These are designed to deliver returns above cash without being subject to the volatility that universe bond strategies experienced in 2024 (as well as in the prior two calendar years); they are not beholden to a benchmark level of duration and associated fluctuations with changes in yields.

Defined benefit plan dynamics

It is a different story for defined benefit (DB) pension plans whose fixed income consideration is inclined to be more on risk management than return generation. DB plans will typically have a significant allocation to long-term fixed income assets to hedge interest rate risk associated with changes in the value of their liabilities. Factors driving longer-term yields are less influenced by central bank policy and in 2024 experienced much lower returns than cash and Universe Bonds due to longer-term yields slightly increasing over the year.

The significant improvement in the funded position of DB plans over the last several years has seen many increase the level of interest rate risk hedging to reduce funding level fluctuations. The specific actions have depended on the type of DB plan (e.g., corporate, university or public), actuarial liability measures that drive risk assessments, factors such as whether the DB plan is open or closed to new members and plan maturity (e.g., percentage of active members versus retiree and deferred members).

Another risk management trend that continued at a strong pace in 2024 with corporate plans was de-risking through annuity purchases from insurance companies. Increasingly referred to as “pension risk transfer” (PRT), the purchase of annuities allows a company to reduce the dollar liability on its balance sheet by transferring assets and liabilities to the insurance company. Estimates for the Canadian PRT market in 2024 are that it will be greater than the 2023 record, which was just shy of CAD 8 billion. The PRT market has evolved significantly since being personally involved with the first modern annuity buy-in by a Canadian pension plan in 2009. Back then, the yearly value of the group annuities market was about CAD 1 billion with most transactions being for pension plans that were winding up and using annuities to settle their retirement benefit liabilities rather than as a risk transfer solution popular today.

Mixed experience from private markets

Over the past 10 years or so, private markets have experienced significant inflows from institutional investors. According to PwC, global assets under management (AUM) is expected to top USD 145 trillion in 2025, nearly double the almost USD 84.9 trillion in 2016.1 The same research predicts that alternative investments will reach above USD 21 trillion by 2025, representing 15% of all AUM.

For private markets, it is difficult to generalize since the returns and outlook are heavily influenced by the specific strategy in which you are invested. However, 2024 saw another mixed experience for returns across the various private markets. Private credit and infrastructure strategies delivered decent returns. Infrastructure continues to gain interest from investors due to its critical role in global efforts to address climate risk through clean energy projects, as witnessed by an increased number of strategies focused on energy transition. Private credit is also expected to play a growing role in the financing of energy transition projects.

Commercial real estate and private equity were the laggards within private markets, although sentiment is improving. In times of market stress and lower valuations also comes opportunities, which was the case within commercial real estate and the launch of various opportunistic strategies.

Hedge funds are the often-overlooked alternative investment option. There are many different strategies, so again it is difficult to generalize. Few hedge funds would have been able to keep up with the S&P 500 Index return in 2024. The combination of higher public equity returns, the greater complexity and higher investment management fees associated with hedge funds can make it challenging for many investors to consider them for their portfolio. However, equity markets will not always be so strong and hedge funds can provide important portfolio diversification in certain challenging environments.

Canadian investors benefited from currency and commodities

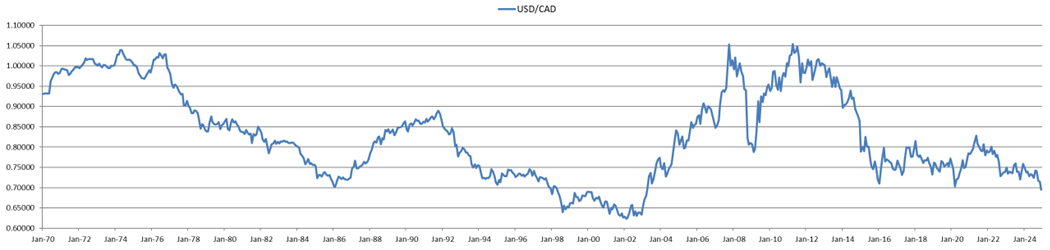
The Canadian dollar declined more than 8% over the year relative to the US dollar, which helped to boost US equity returns for unhedged Canadian investors. Figure 5 shows the history of exchange rates from 1970, capturing the modern-day experience with respect to the Canadian dollar versus the US dollar relationship. Over the period there have been three major declines in the value of the Canadian dollar, which from peak to trough were each down a little over 30%. The first two declines took around 10 years, while the most recent experienced the fastest decline, which was in part due to the swift collapse in oil prices.

Since the last trough in 2016, the Canadian dollar has moved in a relatively narrow range, even accounting for the uncertainty associated with the COVID-19 pandemic and the elevated levels of inflation. The Canadian dollar was valued at 69.53 cents (US) at the end of 2024, creeping closer to testing the 68.68 cents (US) level that was previously thought to be the low point for the most recent peak-to-trough.

Figure 5 – History of USD / CAD Exchange Rates
Line graph showing the History of USD to CAD exchange rates.
Source: Bloomberg

While currently not a popular investment with institutional investors, bitcoin saw a dramatic rise in value. Helped by rates coming down, it had a particularly big boost following Donald Trump’s US election victory. Bitcoin ended the year at over USD 90,000, which compares with being below USD 16,000 just two years ago following the collapse of crypto exchange FTX.

Wars around the world have helped drive demand for investments seen as a safe haven, like gold. Also benefitting from the Fed cuts in interest rates, gold returned 27% for the year. With a higher allocation to the gold sector compared to other major equity markets, the Canadian equity market was a beneficiary of the strong gold return.

Déjà vu for 2025?

As we enter 2025, several of the concerns and uncertainties that were present at the start of last year are still looming. There are also potential distractions of a second Trump term as US president and Canada with no formal leadership at the helm of the country. Despite the uncertainties entering 2024, the outcome was a positive experience. As we roll into 2025, it is important to remember that markets are difficult to predict over the short term, so investors should not overlook the importance of portfolio risk management, including disciplined rebalancing and consideration of additional sources of portfolio diversification to optimize portfolio performance.

1. PwC report ‘Asset & Wealth Management Revolution: Embracing Exponential Change’

Aerial view of a curved and winding road in the middle of a lush green forest.

As we turn the page on another year, the investment landscape is poised for transformative shifts. Despite the narratives suggesting a retreat, Environmental, Social and Governance (ESG) considerations remain at the forefront of corporate and investor agendas. These factors are not just influencing how businesses operate, but are also reshaping how capital flows, decisions are made and risks are assessed globally.

In this commentary, we highlight five ESG trends set to shape the year ahead, revealing both challenges and opportunities for investors and businesses alike.

1. Enhanced regulatory frameworks and mandatory reporting

The era of voluntary ESG reporting is coming to an end. Governments and regulatory bodies worldwide are tightening disclosure requirements, aiming for greater transparency and accountability. For instance, over 50,000 companies globally will start publishing reports in line with the EU’s Corporate Sustainability Reporting Directive (CSRD), effective as of the 2024 financial year. In the United States, despite the polarization of ESG, the California climate disclosure laws will impose strict climate-related reporting obligations for businesses to report climate-related information, while Canada’s Sustainability Standards Board (CSSB) has just published the first sustainability disclosure standards, signaling a move towards harmonized ESG standards.

These regulatory shifts demand readiness from companies to avoid fines and maintain competitiveness, offering investors richer datasets to assess ESG risks and opportunities.

2. The energy security and decarbonization nexus

Geopolitical instability and growing energy demands have elevated energy security to a strategic priority. At the same time, the global race to decarbonize continues to accelerate. Renewable energy investments, energy storage solutions and the deployment of innovative carbon capture technologies are central themes driving this dual agenda.

Many of our holdings are benefiting from this trend. One such example is Landis+Gyr Group AG (LAND SE), a leader in smart metering, grid edge intelligence and smart infrastructure technology, who is helping companies decarbonize their operations. In 2023 alone, Landis+Gyr’s smart metering technology helped to enable a reduction of 8.9 million tons of direct CO2 emissions among customers, while contributing to the company’s growth.

3. Climate adaptation finance continues gaining momentum

While decarbonization remains critical, the rising frequency of climate-induced disasters has underscored the need for climate adaptation strategies. 2024 saw insurance companies suffer $10.6 billion of climate-attributed losses, according to Insure our Future. Investments in climate-resilient infrastructure, disaster recovery, ecosystem restoration and sustainable agriculture are gaining prominence as businesses recognize the economic benefits of adaptation alongside mitigation.

Companies that proactively address physical risks and implement strategies to safeguard operations are becoming more attractive to investors, as they represent opportunities for long-term sustainable growth and stability. Such an example is our holding Installed Building Products Inc. (IBP US), an insulation and building products company whose portfolio includes sustainable insultation, waterproofing, fire-stopping and fireproofing products. In addition to helping companies adapt to physical risks, IBP is aiming to reduce its carbon producing electricity usage by 50% from 2020 by 2030.

4. ESG integration into core business strategies

ESG as a standalone acronym may be fading, but its principles are permeating every aspect of corporate strategy. Businesses are embedding ESG considerations into supply chains, workforce management and product innovation, aligning with stakeholder expectations while mitigating risks.

For example, procurement strategies now emphasize circularity and resource efficiency, while governance practices are evolving to enhance transparency and build investor trust. This shift from a compliance-driven approach to a strategic imperative positions companies with robust ESG frameworks as long-term winners in the eyes of investors.

5. Digital infrastructure and resilience

In an increasingly interconnected world, digital infrastructure has become the backbone of economic and societal resilience. The rapid shift towards digitalization, coupled with the rising frequency of cyberattacks and natural disasters, underscores the need for robust and adaptive digital systems. Investments in secure data centers, resilient cloud services, and advanced cybersecurity measures are gaining momentum as businesses and governments prioritize safeguarding critical digital assets.

Furthermore, integrating digital infrastructure with renewable energy sources and smart grids enhances both energy efficiency and reliability. Companies advancing in digital resilience – those equipped to withstand and recover from disruptions – are increasingly attractive to investors seeking stability and innovation in the face of growing uncertainties.

Conclusion

The ESG trends shaping the new year highlight the dynamic intersection of sustainability and business resilience. For investors and companies alike, staying ahead of these trends is not just about compliance but about seizing opportunities for growth, innovation and competitive advantage in a rapidly transforming world.

Chinese money and credit numbers for December suggest that policy stimulus is becoming effective, warranting an upgraded assessment of economic prospects.

Six-month rates of change of broad / narrow money and broad credit (total social financing) bottomed in June / July but the recovery through November was modest. All three jumped higher in December – see chart 1.

Chart 1

160125c1

Money measures – particularly narrow money – were negatively distorted last spring by regulatory enforcement of deposit rate ceilings*. The revival in six-month momentum partly reflects the dropping out of this effect. Still, December readings should be undistorted and broad money momentum is close to its 2015-19 average, when nominal GDP grew solidly.

Monetary financing of fiscal easing has been a key driver of the money growth pick-up. Banking system net lending to government (including by the PBoC) contributed 2.0 pp (not annualised) to M2 growth in the six months to December, the most since the 2015-16 stimulus episode.

An apparent weak spot in the December release was a further fall in annual bank loan growth (i.e. excluding lending to government). The numbers, however, are being distorted by debt swap operations, involving repayment of bank loans by government-related organisations. Six-month loan momentum has edged up despite this drag, with household lending weakness abating – chart 2.

Chart 2

160125c2

Will the money growth recovery continue? Recent renewed pressure on the currency has been associated with a resumption of f/x sales and a firming of money market rates. The increase in term rates has so far been modest and may be offset by ongoing support from money-financed fiscal easing.

*Lower interest rates on demand deposits resulted in enterprises moving money into time deposits and non-monetary instruments while repaying bank loans.

The Northside Plus building at the University of Texas at Dallas.

Richardson, TX, January 13, 2025 – Connor, Clark & Lunn Infrastructure (CC&L Infrastructure) and Bestinver Infra (Bestinver) announced the acquisition of a majority interest in the Northside student housing project (Northside or the Project), a community of student housing facilities situated at the University of Texas at Dallas (UTD). The facilities were built in four phases between 2016 and 2021 and comprise approximately 1,200 units with the capacity to house over 2,500 students. Balfour Beatty, the international infrastructure group, is the current property manager and is retaining a minority equity ownership stake in the Project. CC&L Infrastructure and Bestinver acquired the entirety of the interest owned by funds managed by Tikehau Capital North America LLC d/b/a Tikehau Star Infra.

UTD is one of the highest ranked public universities in Texas, offering over 140 academic programs and hosting more than 50 research centres and institutes, with current enrolment totaling approximately 30,000 students. Northside operates under long-term land leases with the university, with an average of over 50 years remaining across each of the facilities.

“We are excited to further diversify our portfolio of infrastructure assets with the acquisition of this interest in Northside, which marks our first investment in the student housing sector,” said Matt O’Brien, President of CC&L Infrastructure. “Northside provides an essential service to UTD’s student community and supports a sizeable and growing enrolment base. We look forward to working with our partners and UTD in the successful operation of Northside for years to come.”

“Our investment in Northside underscores our continued focus on high-quality, stable and resilient assets in North America, and is the first of several investments we will make in the region through our Fund II,” said Francisco del Pozo, Head of Infrastructure Funds at Bestinver.

Agentis Capital served as financial advisor, White & Case LLP as legal counsel, Deloitte as accounting and tax advisor, and Infrata as technical advisor to CC&L Infrastructure and Bestinver.

About Connor, Clark & Lunn Infrastructure

CC&L Infrastructure invests in middle-market infrastructure assets with attractive risk-return characteristics, long lives and the potential to generate stable cash flows. To date, CC&L Infrastructure has accumulated over $6 billion in assets under management diversified across a variety of geographies, sectors and asset types, with nearly 100 underlying facilities across 35 individual investments. CC&L Infrastructure is a part of Connor, Clark & Lunn Financial Group Ltd., a multi-boutique asset management firm whose affiliates collectively manage over CAD132 billion in assets.

About Connor, Clark & Lunn Financial Group Ltd.

Connor, Clark & Lunn Financial Group Ltd. (CC&L Financial Group) is an independently owned, multi-affiliate asset management firm that provides a broad range of traditional and alternative investment management solutions to institutional and individual investors. CC&L Financial Group brings significant scale and expertise to the delivery of non-investment management functions through the centralization of all operational and distribution functions, allowing talented investment managers to focus on what they do best. CC&L Financial Group’s affiliates manage over $132 billion in assets. For more information, please visit cclgroup.com.

Contact
Sonja Weiss
Vice President
Connor, Clark & Lunn Infrastructure
(437) 561-6184
[email protected]

About Bestinver

As part of Acciona Group, Bestinver has been managing investment funds for more than thirty-five years, and is the leading independent asset manager in Spain with more than 50,000 investors and over 6.8 billion euros under management.

Bestinver created the division of Infrastructure funds with the objective of managing 1,500 million euros in alternative investments in the next five years. As part of this area of alternative investments, Bestinver incorporated Bestinver Infra FCR (“Bestinver Infra”), which was the first private equity fund from Bestinver to invest in infrastructure.

After the success of Bestinver Infra, Bestinver launched its second fund targeted at 350-400 million Euros to invest in global infrastructure assets (“Bestinver Infra II”).

The funds invest in brownfield, greenfield, and yellowfield assets in the transportation, renewable energy, social, telecom and water sectors located in Europe, North America and selected Latin American countries. Additionally, Bestinver is focused on creating long-term value by integrating ESG criteria into the Bestinver’s investment processes.

Contact
Jose Herrero Peña
Bestinver Gestión
[email protected]

Decorative image.

We’re honoured to have to be recognized as a 2024 Greenwich Leader in Institutional Investment Management Service Quality. This is our fourth time earning this award in a decade, a testament to our Client Solutions Team embodying our mission statement with “the commitment and desire to provide superior performance and service to our clients.” This would not have been possible without the commitment of the entire firm – investment teams, operations teams and all our support colleagues – we thank you all!

Read more

*From February through September 2024, Coalition Greenwich conducted interviews with 115 of the largest tax-exempt funds in Canada. Senior fund professionals were asked to provide quantitative and qualitative evaluations of their investment managers, assessments of those managers soliciting their business, and detailed information on important market trends. CC&L did not provide Coalition Greenwich with any compensation for this survey. For further information on performance, please contact us at [email protected].

Wind turbines in a large field and blue sky.

Toronto, January 7, 2025 – Connor, Clark & Lunn Infrastructure (CC&L Infrastructure) is pleased to announce the acquisition of a significant interest in two Ontario-based wind projects (the Projects) representing approximately 330 megawatts (MW) of gross capacity from Pattern Energy Group LP (Pattern Energy), a leading North American developer and operator of renewable energy assets. The acquisition increases the size of CC&L Infrastructure’s renewable energy portfolio to over 2 gigawatts (GW) of gross capacity, diversified across a variety of energy markets, contract counterparties, regulatory jurisdictions and technologies (i.e. wind, solar and hydro). Pattern Energy will maintain a minority equity stake in the Projects and will continue to manage and operate the assets.

The Projects, Armow Wind and Grand Renewable Wind, are both located in southern Ontario and have gross capacities of 180 MW and 149 MW, respectively, together generating energy equivalent to the annual consumption of almost 290,000 Ontarians. All of the energy generated by the Projects is sold under 20-year Power Purchase Agreements (PPAs) to the Independent Electricity System Operator (IESO) (rated Aa3 by Moody’s). Both assets use proven wind technology and each has been in operation for approximately a decade, performing largely in line with forecasts for power generation and availability over that period.

“This investment in Armow Wind and Grand Renewable Wind will expand our renewable energy portfolio to over 2 GWs, building on our long history of constructing and operating clean energy assets across North America,” said Matt O’Brien, President of CC&L Infrastructure. “We are excited to partner with Pattern Energy and look forward to leveraging our collective decades of experience safely and successfully operating renewable energy projects.”

The Projects contribute meaningfully to the communities in which they operate, generating millions of dollars in property taxes and ancillary revenues for the local communities over their asset lives. The Projects have committed to contribute a total of over $25 million to community benefit funds over the first 20 years of operations, and have supported local initiatives such as recreational facilities, public infrastructure and improvements to local infrastructure.

“Establishing this partnership with CC&L Infrastructure, an experienced and active Canadian infrastructure investor, will allow Pattern to grow our positive impact in Canada and to expand our portfolio in the country,” said Hunter Armistead, CEO at Pattern Energy. “Pattern has become Canada’s largest operators of wind power with projects generating enough clean energy to power nearly 1.5 million Canadians. We are proud to have created thousands of jobs and distributed millions in direct financial benefits to communities across the country over the last 15 years.”

CC&L Infrastructure and Pattern Energy will own the assets alongside Samsung Renewable Energy (Samsung) and Six Nations of the Grand River (in the case of Grand Renewable Wind). CC&L Infrastructure and Samsung have previously worked together to build and operate approximately 300 MW of solar projects across four sites in Ontario.

CIBC Capital Markets served as CC&L Infrastructure’s financial advisor on the transaction and Torys LLP served as its legal counsel. BMO Capital Markets acted as exclusive financial advisor for Pattern Energy and Osler, Hoskin & Harcourt LLP served as its legal counsel.

About Connor, Clark & Lunn Infrastructure

CC&L Infrastructure invests in middle-market infrastructure assets with attractive risk-return characteristics, long lives and the potential to generate stable cash flows. To date, CC&L Infrastructure has accumulated over $6 billion in assets under management diversified across a variety of geographies, sectors and asset types, with approximately 100 underlying facilities across over 35 individual investments. CC&L Infrastructure is a part of Connor, Clark & Lunn Financial Group Ltd., a multi-boutique asset management firm whose affiliates collectively manage approximately CAD132 billion in assets.

Contact
Sonja Weiss
Vice President
Connor, Clark & Lunn Infrastructure
(437) 561-6184
[email protected]

About Pattern Energy

Pattern Energy is one of the world’s largest privately-owned developers and operators of wind, solar, transmission, and energy storage projects. Its operational portfolio includes more than 30 renewable energy facilities that use proven, best-in-class technology with an operating capacity of nearly 6,000 MW across North America. Pattern Energy is guided by a long-term commitment to serve customers, protect the environment, and strengthen communities. For more information, visit www.patternenergy.com.

Contact
Matt Dallas
Pattern Energy
(917) 363-1333
[email protected]

Monetary trends suggest that the global economy will remain soft in H1 2025, while inflation rates will fall further, undershooting targets. Cycle analysis holds out a prospect of economic reacceleration later in the year but risk assets might have limited further upside even in this scenario, although international / EM equities might regain relative performance.

Global six-month real narrow money momentum recovered from a low in September 2023 into Q2 2024 but has since moved sideways at a weak level by historical standards – see chart 1. Based on a normal six to 12 month lead, this suggests below-trend economic growth through Q2 2025, at least.

Chart 1

Chart 1 showing G7 plus E7 Industrial Output and Real Narrow Money (% 6 months)

Economies exhibiting monetary weakness are at greater risk from negative policy or other shocks. As an example, a fizzling-out of a recovery in UK six-month real narrow money momentum in H1 2024 signalled an approaching growth stall but the Budget tax shock appears to have tipped the economy into contraction.

With job openings / vacancy rates back in pre-pandemic ranges, below-trend global growth is likely to be associated with greater deterioration in labour markets than in 2024. In economics parlance, a movement down the Beveridge curve may be approaching a gradient shift such that a further fall in vacancies will be associated with a significant unemployment rise.

A further issue for monetary economists is the “false” US recession signal of 2022-23. Most annual contractions in US real narrow money historically were associated with recessions, and all on the scale of the 2023 decline – see chart 2. On three occasions (highlighted), however, the interval between the start of the contraction and the onset of recession was unusually long, i.e. up to 32 months.

Chart 2

Chart 2 showing US Real Narrow Money (% year over year)

On inflation, the monetarist rule of thumb that price momentum follows the direction of broad money growth roughly two years earlier suggests a further slowdown into undershoot territory in H1 2025. Chart 3 shows the relationship for the Eurozone but the message of headline / core deceleration is the same for the US, Japan and the UK.

Chart 3

Chart 3 showing Eurozone Consumer Prices and Broad Money (% 6 month annualised)

Global PMI output price indices in manufacturing and services are close to 2015-19 averages, when headline / core inflation averages were below target.

Financial market prospects, on the “monetarist” view, depend on whether there is “excess” or “deficient” money relative to the economy’s needs. Two flow measures of global excess money were used here historically – the gap between six-month rates of change of real narrow money and industrial output, and the deviation of the annual change in real money from a slow moving average. A “safety first” approach of holding global equities only when both measures were positive would have outperformed buy-and-hold significantly over the long run.

The flow measures, however, remained mixed / negative in 2023-24, understating the availability of money to boost markets because they failed to capture a stock overhang from the 2020-21 monetary surge. To assess whether this stock influence remains positive, the approach here has been to use a modified version of the quantity theory in which the money stock is compared with an average of nominal GDP and gross wealth.

Chart 4 shows that an average of US nominal GDP and gross wealth remained below the level implied by the money stock through mid-2024, consistent with a positive stock influence on asset prices / the economy. Equivalent analysis for Japan and the Eurozone shows the same. In all three cases, however, the nominal GDP / wealth average moved ahead of the money stock during H2 2024, implying that stock and flow indicators are now aligned in suggesting a neutral / negative backdrop.

Chart 4

Chart 4 showing US Borad Money, Nominal GDP and Gross Wealth

While monetary indicators suggest near-term softness, cycle analysis holds out a prospect of stronger economic performance later in 2025 and in 2026. A key consideration is that the stockbuilding and business investment cycles appear some way from reaching peaks, with the next lows unlikely before H2 2026 and 2027 respectively.

The last trough in the stockbuilding cycle is judged to have occurred in Q1 2023, with national accounts inventories data and business surveys suggesting that the upswing is around its mid-point – chart 5. The previous cycle was shorter than the 3.5 year average, so the current one could be longer, with a low as late as H1 2027. An associated downswing might not start until H1 2026.

Chart 5

Chart 5 showing G7 Stockbuilding as % of GDP (year over year change)

The 7-11 year business investment cycle appears to have bottomed in 2020, although a case could be made that this was a false low due to the pandemic, with the last genuine trough reached following a mild downswing in 2015-16. On the more plausible former view, the next low is scheduled for 2027 or later, implying potential for a 2026 boom.

The longer-term housing cycle, which bottomed in 2009 and has averaged 18 years, is in the time window for a peak but significant weakness could be delayed until H2 2026 or later.

Monetary and cycle signals could be reconciled if near-term economic weakness / favourable inflation news triggers faster monetary policy easing and a strong pick-up in money growth into mid-year.

Would such a scenario be associated with further significant gains in risk assets? The history of the stockbuilding cycle suggests not.

Risk assets typically rally strongly in the first half of a stockbuilding cycle, partially retracing gains in the run-up to the next trough. Table 1 compares movements so far in the current cycle with averages at the same stage of the previous eight cycles, along with changes over the remainder of those cycles. US equities, cyclical sectors and precious metals have outperformed relative to history, suggesting a stronger likelihood that they will lose ground between now and the next trough.

Table 1

Table 1 showing Stockbuilding Cycle and Markets

Areas that have lagged relative to history include EAFE / EM equities, small caps and industrial commodities, hinting at catch-up potential in the event of a delayed stockbuilding cycle peak and late (H1 2027) trough. This prospect would be enhanced by a reversal of unusual US dollar strength so far in the current cycle.

Still, any such catch-up might be a relative rather than absolute move against a backdrop of a maturing cycle upswing, a possible US market correction and neutral / negative excess money conditions.

A person flipping a wooden block cube to change 2024 to 2025 in preparation of the new year.

As we look back on 2024, we saw the equity market prove itself to be a testament to resilience, and a return to speculative activity last seen since before the pandemic.

Below is a selection of charts that our team found to be particularly impactful, highlighting the environment we witnessed in 2024 and, more importantly, why we’re excited for 2025.

Speculation

This year has been the year of the US equity markets, particularly the mega cap Magnificent Seven, up over 60% in 2024. The speculative fervour that gripped the United States has reached fever pitch. The best way to measure it may actually not be Bitcoin – even though it has more than tripled this year to trade above $100,000.

Have you heard of Fartcoin? Yes, you read that correctly. Just so you know, the coin is up over 1,000% since the US elections on November 5.

Snapshot of Fartcoin's value.
Source: CoinGecko

Not bad for a cryptocurrency that allows users to submit fart jokes or memes to claim initial tokens. Over USD60 million is traded every day; with a market cap of $830 million, it is the 189th largest cryptocurrency. We are in uncharted territories.

Regional market concentration

Line chart illustrating the 75-year high in US stocks versus the rest-of-world stocks over time since 1950.
Source: BofA Global Investment Strategy, Global Financial Data, Bloomberg

The concentration of the gap in valuation between US stocks and the rest of the world is driving up the valuation of US stocks to extreme levels. Global markets have been tumultuous since the pandemic, but with the rush for AI and technology, the US market has shown to be the most resilient, therefore drawing investors from abroad in droves.

Top ten concentration

Line chart illustrating the top 10 stocks as a percentage of the S&P 500 over time since 1990.
Source: BofA Global Investment Strategy

Regarding the gap between the top-10 stocks in the S&P 500 and the remaining 490, a similar divergence is taking place when we examine equity market flows. In fact, the best way to measure the fervour is in the investor concentration towards US equities, specifically the S&P 500. With the Magnificent Seven making up nearly 50% of the S&P 500’s gain, this high is volatile. Any earnings slowdown or unfavourable news within this seven could result in outsized impacts on the overall performance.

We will let you judge if this a risky environment or not. To quote Mark Twain, “History doesn’t repeat itself, but it often rhymes.”

Instead of trying to find reasons why this market might correct, allow us to concentrate on what we see as opportunities.

Global opportunities outside of the United States

We’ve written numerous pieces on opportunities within small caps in JapanEurope and emerging markets this year, so it’s no surprise when we say that we believe that the Japanese economy will be the fastest growing developed market economy in 2025.

The country has turned the corner on deflation. The virtuous wage/price spiral has taken hold. Pay rose 3.6% for base pay and 5.17% in total pay in 2024. We expect a similar increase in 2025. Interest rates will probably rise another 0.5%. Japan is a beneficiary of mega trends, from friendshoring to AI, semi-conductor investments to green transition. A newly announced ¥39 trillion fiscal package will help even further. As a result, a stronger economy with a large discount in Japanese companies’ valuations and investor-friendly measures such as M&A and buybacks mean Japan should be the top performing developed equity market in 2025.

In Europe, how a few years make a huge difference. Countries like Spain and Italy should be outperformers, as well as the UK and Sweden as these countries and their economies begin to turn.

For emerging markets, China will deploy fiscal stimulus that is similar to 2008, putting a floor on deflation risks, stimulating consumption and buoying the stock market. Given the underweight of most asset managers, it may mean healthy returns for the Chinese markets.

MSCI EAFE Small Cap minus Russell 2000
Bar graph showing the performance of the MSCI EAFE small cap minus the Russell 2000 from 1993 to present.
Source: Global Alpha Capital Management Ltd.

Since fall 2024, there has been a rotation into US small caps, fueled even more by the Trump Trade: Could we see international small caps catch up? One can observe the relative outperformance of EAFE small cap between 2002 and 2010. Seven years of underperformance is unprecedented. And we need to know that Japan is around 33% of the EAFE small cap index. According to the fundamentals and history, if there is a slowdown in the United States, international markets including international small caps could stand to be big beneficiaries.

Mergers and acquisitions

A bar graph showing the global mergers and acquisitions transaction values from 2009 to present.
Source: Global Alpha Capital Management Ltd.

We have also recently seen a pick-up in M&A activity. A consensus is emerging from advisors like Goldman Sachs, Evercore and others that 2025 will be a record year. M&A activity is projected to be 15% greater 2024, which was already up 15% over 2023.

A line graph showing the price to sale of small cap relative to large cap over time since 1999.
Source: Global Alpha Capital Management Ltd.

Finally, the relative valuations of global and EAFE small caps versus large cap indicate a once-in-a-few-decades opportunity.

Investments are currently overloaded into the US market, with an oversaturation in the Magnificent Seven stocks. But it is clear there is opportunity in small caps – particularly international small caps – therefore, this is an opportunity that excites our team going into 2025.

In closing, the entire team at Global Alpha would like to thank you for your trust, and we want to wish you a beautiful holiday season and a wonderful 2025 ahead.