Rack Attack, a Banyan Capital Partners portfolio company, today announced its partnership with RealTruck, bringing RealTruck products and expertise to all 45 Rack Attack retail locations. The partnership is designed to expand customer access to premium truck accessories, supported by in-store expertise and installation services.
“The launch of official RealTruck store-in-store retail shops within our Rack Attack locations will elevate our partnership and create the ultimate customer experience. Together, we are offering truck owners and outdoor enthusiasts the greatest choice of products, combined with the best service across all our markets in North America,” says Alexander Welbers, CEO, Rack Attack.
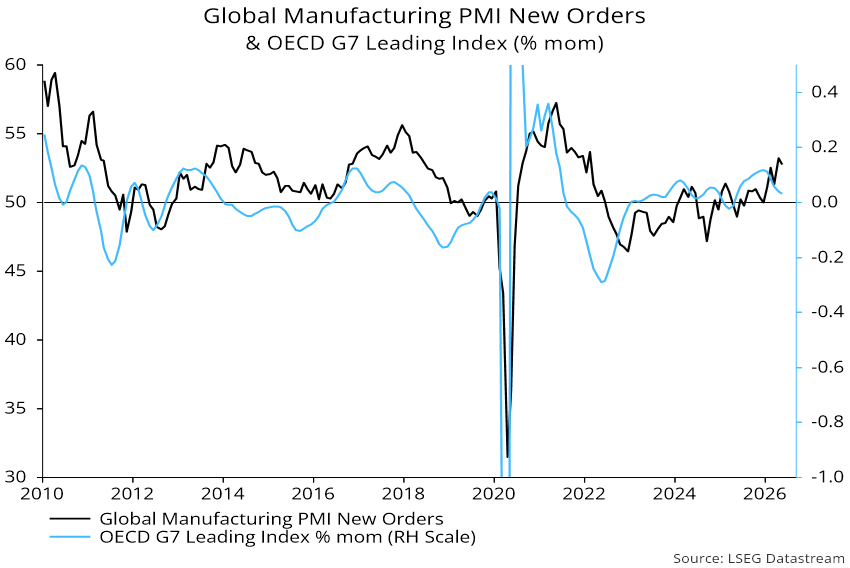
OECD leading indicator data and survey evidence on stocks support the forecast of a H2 loss of industrial momentum.
Global manufacturing PMI new orders edged down in May from April’s four-year-plus high. The expectation here has been for a further decline in H2, reflecting a slowdown in global six-month real narrow money momentum from a February peak – see previous post.
Two recent releases support this forecast. First, one-month growth of the OECD’s G7 leading indicator fell again in May. Growth peaked in December and has led PMI new orders by three months on average historically, suggesting that April’s orders high will prove lasting – see chart 1.
Chart 1
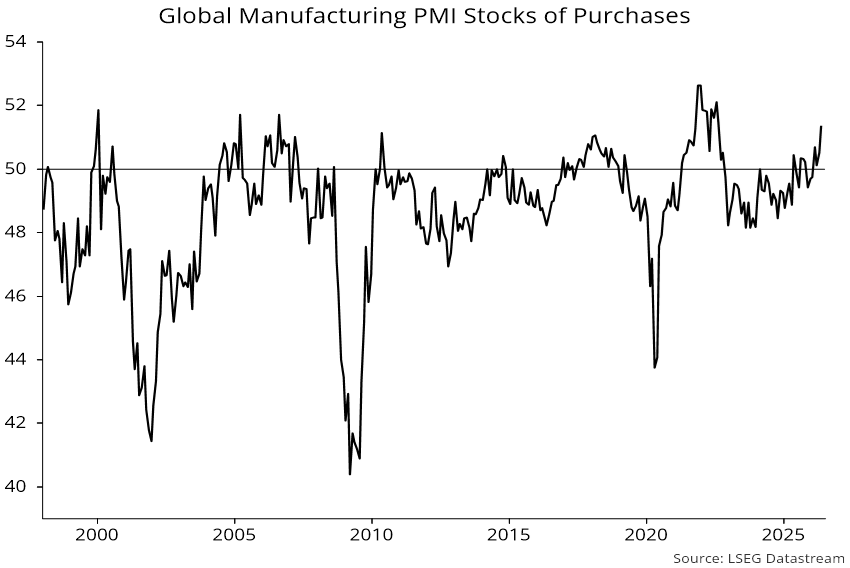
Secondly, the PMI stocks of purchases index indicates that stockpiling of inputs accelerated further last month, likely marking a cycle peak – chart 2.
Chart 2
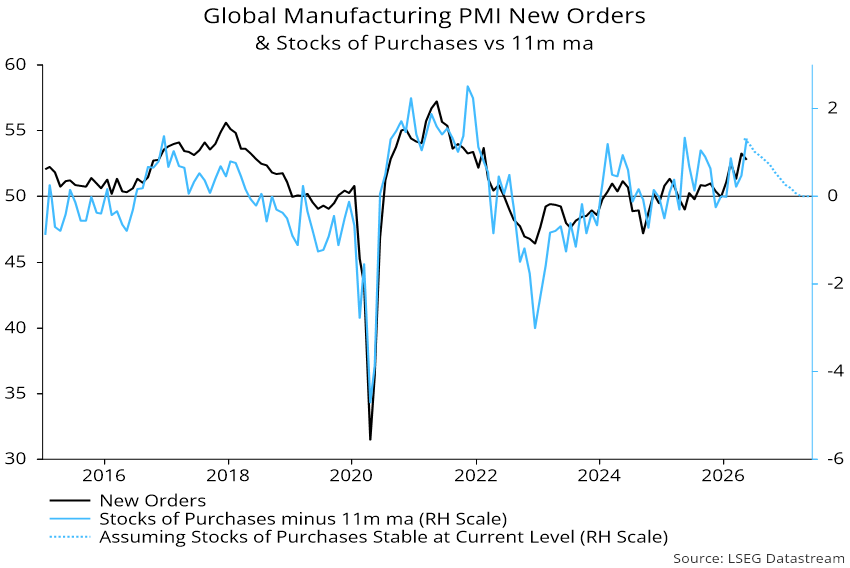
Growth in new orders is related to the rate of change of stockbuilding, implying a slowdown even in the unlikely event that the stocks of purchases index remains at its current extended level – chart 3.
Chart 3

Crestpoint Real Estate Investments is pleased to continue its partnership with Vestcor and Anthem Properties on King + Park, a landmark mixed-use masterplan at the gateway to Burnaby. Joined by the Mayor of Burnaby and other guests, Crestpoint, Vestcor and Anthem celebrated the project’s ceremonial groundbreaking on June 1, 2026.
Situated in a transit-oriented setting, the full King + Park masterplan includes:
- 724 rental homes in two towers over a shared podium (Phase 1 now under construction)
- Restoration of the iconic Boot Office Tower
- 512,350 sq ft of retained and restored office space (the Boot)
- 43,402 sq ft of commercial space delivered across all phases
- 1,559 strata homes (future phase)
As Max Rosenfeld, Executive Vice President and Head of Asset Management at Crestpoint, noted, King + Park is “a distinct opportunity to honour heritage and reimagine a site simultaneously,” and Crestpoint is thrilled to be partnering on a vision that will have a positive, lasting impact.
Eurozone and UK April money numbers signal rising recession risk and suggest that policy-makers should be considering easing not tightening.
Three-month annualised growth of Eurozone narrow money – as measured by non-financial M1 – slumped from 5.3% to 1.5% between January and April. UK growth fell from 3.8% to 0.7% over the same period, with a large contraction in April alone.
The nominal slowdowns compound a squeeze on real money from consumer price acceleration due to the Gulf War III supply shock. Six-month momentum of real narrow money fell to zero in the UK in April while turning negative in the Eurozone – see chart 1.
Chart 1
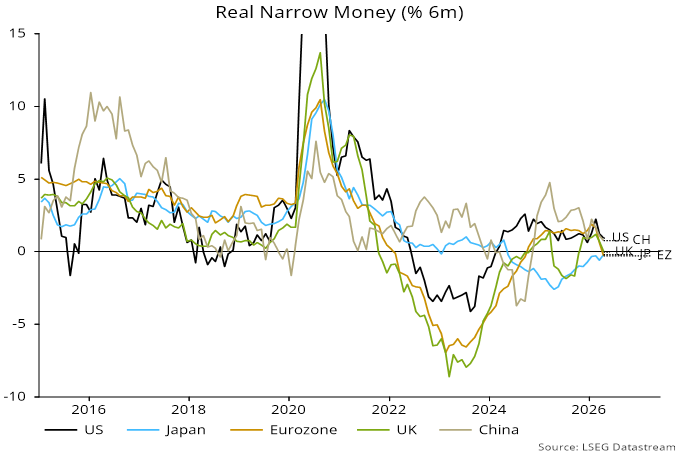
Real money contractions have been a recession warning signal historically. An obvious push-back is that much greater weakness in 2022-23 was not reflected in a subsequent economic slump. Negative momentum was a misleading indicator of monetary conditions then because of a large overhang from the 2020-21 money growth surge. There is no such overhang now, so dismissing current weakness on the basis of that experience is dangerous.
Broad money trends are also worrying, with nominal growth of only 3.5% and 3.6% annualised respectively in Eurozone non-financial M3 and UK non-financial M4 in the three months to April. US broad money, by contrast, expanded at a 7.6% pace over the same period (M2+ measure).
Globally, six-month real narrow money momentum fell for a second month in April, supporting the forecast of a fall in manufacturing PMI new orders during H2 – chart 2.
Chart 2
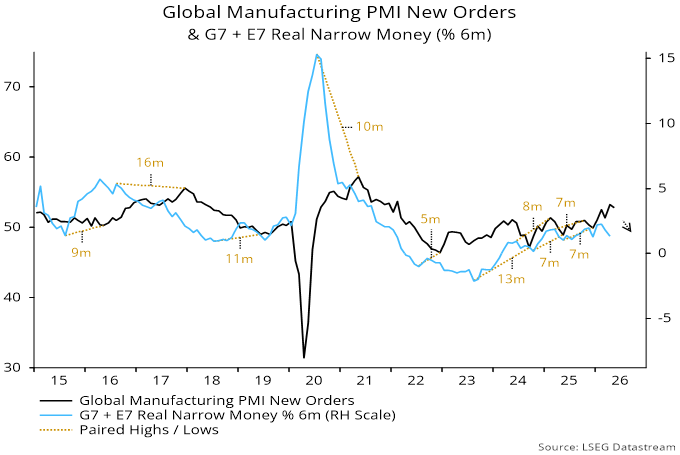
An expected fall in global manufacturing PMI new orders suggests a moderation, at least, in current earnings strength.
New orders reached a four-plus-year high in April but DM flash results imply a pull-back in May. The forecast here is for a further decline in H2, reflecting an inflation-driven slowdown in global six-month real narrow money momentum from a February peak – see chart 1.
Chart 1

A further consideration is that orders have been boosted recently by demand front-loading and stockbuilding motivated by supply concerns, implying future payback.
PMI new orders are contemporaneously correlated with MSCI World earnings revisions, whether expressed in terms of the revisions ratio (net proportion of analyst estimates upgraded each month) or the one-month percentage change in aggregate forecast earnings per share – chart 2.
Chart 2
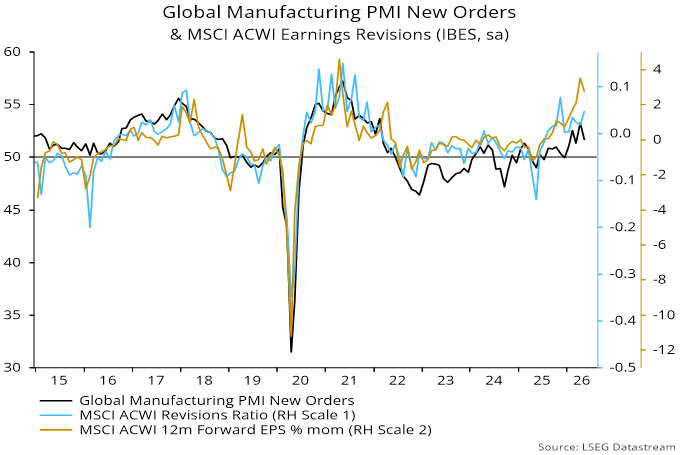
Both revisions measures remained strong in May but the expected new orders decline suggests a moderation, at least, ahead.
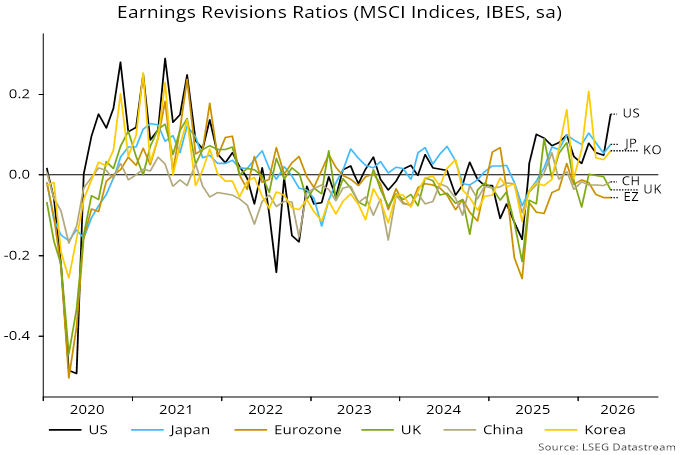
Current earnings strength is focused on the US and AI-spend beneficiaries, with downgrades in Europe, China and EM ex. Korea / Taiwan – chart 3. The suggestion of European relative weakness was echoed in the flash PMIs.
Chart 3
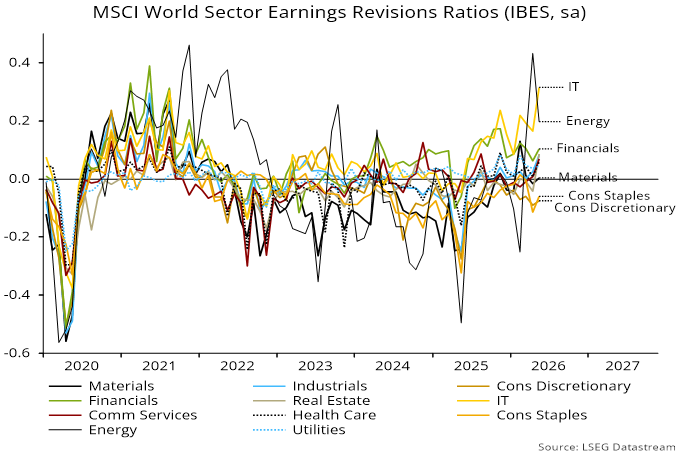
Sector wise, IT extended its lead, with consumer sectors continuing to suffer earnings downgrades – chart 4. The revisions ratio gaps between IT and consumer discretionary / staples reached new records in data extending back to 1995 – another manifestation of economic disparities.
Chart 4


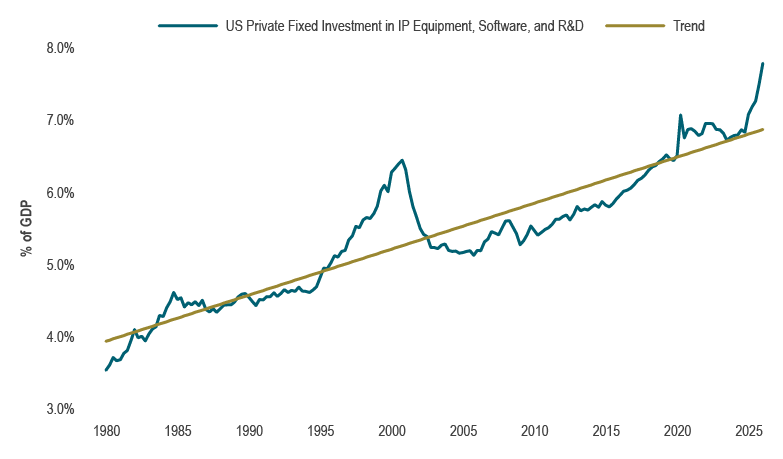 Source: US Bureau of Economic Analysis, Macrobond
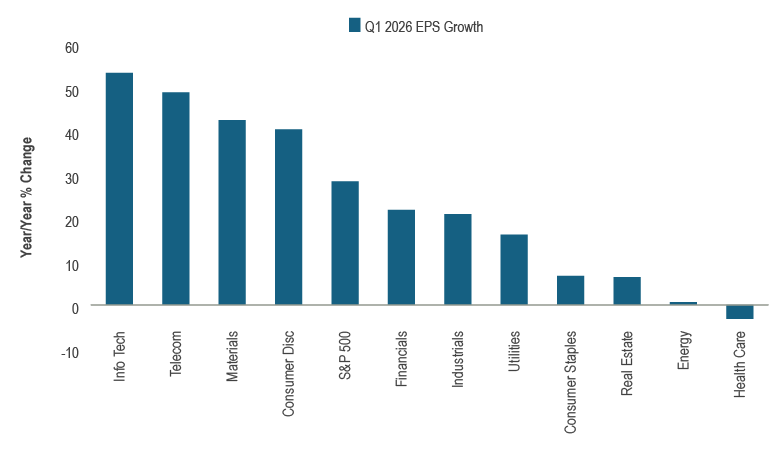 Source: FactSet. Note: As of May 21, 2026
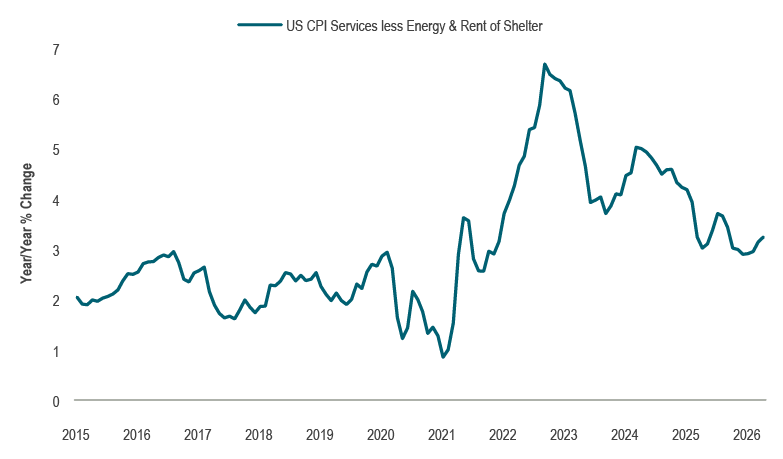 Source: US Bureau of Labor Statistics, Macrobond
 Source: US Bureau of Labor Statistics, Macrobond