UK money momentum has weakened alarmingly. The broad non-financial M4 measure – comprising holdings of households and private non-financial corporations (PNFCs) – grew by just 1.9% annualised in the three months to May. Non-financial M1 contracted at a 2.7% pace – see chart 1.

Chart 1

Chart 1 showing UK Narrow / Broad Money & Bank Lending (% 3m annualised)

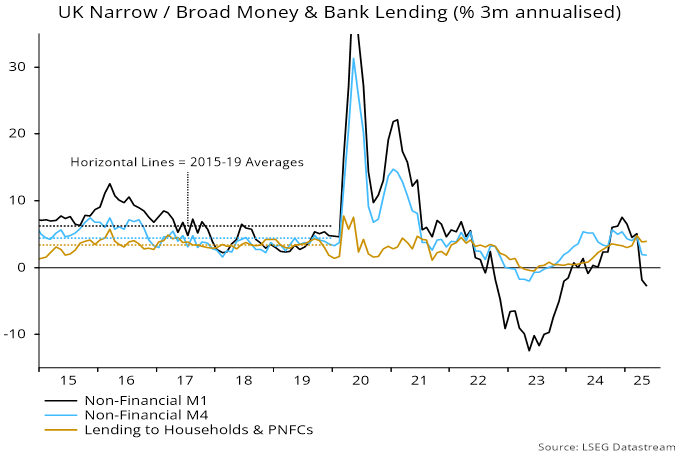
Three-month bank lending growth held up but is likely to fall sharply as a large monthly rise in March – related to the end of the stamp duty holiday – drops out of the calculation. Lending typically follows money trends.

It is unusual for narrow money to lag broader measures when interest rates are falling – lower rates reduce the opportunity cost of holding more liquid forms of money, encouraging a shift out of time deposits and savings accounts. 21% of non-financial M1 is non-interest-bearing. The average interest rate on the stock of household time deposits fell by 31 bp between August and May, according to BoE data.

The demand to hold narrow money is driven mainly by the need to finance future spending, so weakness despite rate cuts is ominous for economic prospects. Put differently, money trends support the view here that MPC policy easing has been too slow, providing insufficient support for activity and increasing the risk of an inflation undershoot.

The monetary relapse could partly reflect payback for temporary factors that boosted growth in late 2024 / early 2025.

A jump in money numbers in October appears to have been related to asset sales in anticipation of changes to capital taxes in the Budget at the end of that month. An asset disposal can boost broad money if financing by the purchaser involves – directly or indirectly – an expansion of banks’ balance sheets*. The effect, however, would be expected to reverse as the seller of the asset deployed the proceeds.

Mortgage lending and broad money were boosted in Q1 by front-loading of housing transactions ahead of the end of the stamp duty holiday. Increased activity may also have resulted in a temporarily higher demand for narrow money.

A reversal of these effects may explain broad money stagnation and a narrow money decline in April / May. Still, annual rates of change should be free of such influences and have slowed to 2.5% for non-financial M1 and 3.6% for M4, from recent peaks of 3.4% and 4.8% respectively. Eurozone annual non-financial M1 growth, by contrast, has risen further to 4.3%.

The sectoral breakdown shows that the recent fall in narrow money reflects a switch by households into time deposits / cash ISAs – their aggregate money holdings have continued to expand, though at a slower pace. By contrast, corporate broad money contracted in April / May, consistent with a negative financial impact from NI and minimum wage hikes – chart 2.

Chart 2

Chart 2 showing UK Household & PNFC* Money (% 3m annualised) *PNFCs = Private Non-Financial Corporations

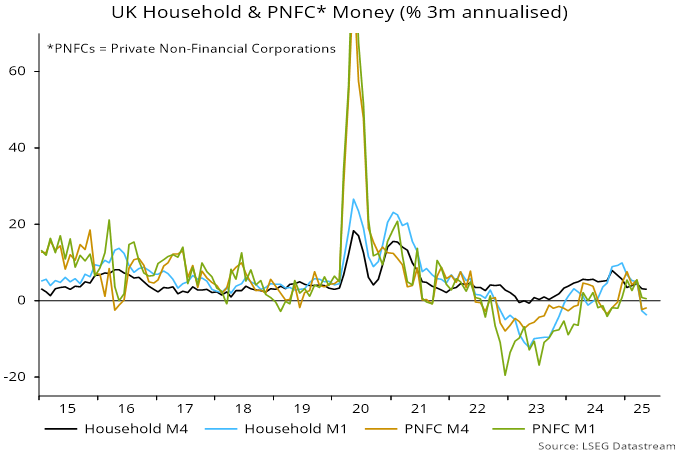
The annual rate of change of corporate broad money is back in negative territory, following small positive readings over December-April, suggesting further weakness in employment and fading capex prospects.

*More precisely, an expansion of banks’ domestic lending or net foreign assets, or a fall in their net non-deposit liabilities.

What’s new

We are pleased to announce the recent expansion of our UCITS Fund platform with the addition of a global small cap equity strategy and a global equity strategy. Both strategies, available to certain global investors, are managed by our Quantitative Equity team.

Financial Markets Returns (%) (C$) Q2 1 Year
S&P/TSX Composite Index 8.5 26.4
S&P500 Index 5.2 14.8
MSCI Emerging Markets Net 6.2 15.0
FTSE Canada Universe Bond Index -0.6 6.1

Global Equities

International Equity Strategies (%) Q2 1 Year
CC&L Q Global Equity 8.1 20.7
MSCI ACWI Index (CAD) (net) 5.7 15.8
CC&L Q Global Small Cap 7.2 18.2
MSCI ACWI Small Cap Index (CAD) (net) 6.5 13.3
CC&L Q ACWI Equity Extension1 6.6 23.4
MSCI ACWI Index (net) 5.7 15.8
CC&L Q US Equity Extension1 5.9 19.7
S&P 500 Index (Net 15%) 5.1 14.4
CC&L Q International Equity 8.3 24.1
MSCI ACWI ex USA Index (CAD) (net) 6.2 17.4
CC&L Q International Small Cap Equity 12.0 21.2
MSCI ACWI ex USA Small Cap Index (CAD) (net) 10.9 18.0
CC&L Q Emerging Markets Equity 7.6 19.0
MSCI Emerging Markets Index (CAD) (net) 6.2 15.0

MSCI ACWI Sector Q2 Total Returns (Local)
TOP 3

21.6%

Information Technology

16.9%

CommunicationCommuni-cation Services

12.4%

Industrials

BOTTOM 3

1.2%

Consumer Staples

-5.5%

Energy

-5.6%

Health Care

MSCI ACWI Country Q2 Total Returns (Local)
TOP 3

21.7%

Korea

19.4%

Greece

18.8%

Peru

BOTTOM 3

-2.7%

Switzerland

-3.7%

Thailand

-5.0%

Saudi Arabia

Canadian Equities

Canadian Equity Strategies (%) Q2 1 Year
CC&L Fundamental Canadian Equity 9.5 24.7
S&P/TSX Composite Index 8.5 26.4
CC&L Equity Income & Growth 8.2 23.9
S&P/TSX Composite Index 8.5 26.4
CC&L Fundamental Canadian Small Cap/Mid Cap 14.3 26.4
60% S&P/TSX Small Cap Index & 40% S&P/TSX Completion Index 12.1 24.5
CC&L  Canadian Equity Combined (Q Core/Fundamental) 9.6 26.6
98% S&P/TSX Composite Index & 2% FTSE Canada 91 Day T-Bill Index 8.4 25.9
CC&L Q Canadian Equity Core 9.6 28.5
S&P/TSX Composite Index 8.5 26.4
CC&L Q Canadian Equity Growth 10.2 29.1
S&P/TSX Composite Index 8.5 26.4
CC&L Q Canadian Equity Extension1 8.7 32.2
S&P/TSX Composite Index 8.5 26.4

TSX Sector Q2 Total Returns
TOP 3

14.2%

Information Technology

14.1%

Consumer Discretionary

12.1%

Financials

BOTTOM 3

3.1%

Health Care

2.6%

CommunicationCommuni-cation Services

1.3%

Energy

Canadian Fixed Income

Fixed Income Strategies (%) Q2 1 Year
CC&L Core Bond -0.6 6.6
FTSE Canada Universe Bond Index -0.6 6.1
CC&L Universe Bond Alpha Plus1 -0.3 9.2
FTSE Canada Universe Bond Index -0.6 6.1
CC&L Long Bond -2.4 4.8
FTSE Canada Long Term Overall Bond Index -2.3 4.3
CC&L Long Bond Alpha Plus1 -2.1 7.3
FTSE Canada Long Term Overall Bond Index -2.3 4.3
CC&L High Yield Bond 0.8 9.2
30% Merrill Lynch US High Yield Cash Pay BB Index (Non CAD Hedged) (CAD$) & 30% Merrill Lynch
US High Yield Cash Pay BB Index (CAD Hedged) & 30% FTSE Canada Corporate BBB Bond Index &
10% Merrill Lynch Canada BB-B High Yield Index
0.7 8.4
CC&L Short Term Bond 0.5 6.4
FTSE Canada Short Term Overall Bond Index 0.5 6.3
CC&L Money Market 0.6 3.6
FTSE Canada 91 Day T-Bill Index 0.6 3.8
CC&L Core Plus Fixed Income -0.6
FTSE Canada Universe Bond Index -0.6
Bond Market Quarterly Changes (Bps)
Canada: 2-year yield: 15. 10-year yield: 30. US: 2-year yield: -18. 10-year yield: 2.
Credit Spread. Corporate: -17. Provincial: -10.

Balanced & Alternative Strategies

Balanced Strategies (%) Q2 1 Year
CC&L Balanced 5.0 15.9
25% S&P/TSX Capped Composite Index & 35% MSCI ACWI Net (CAD$) &
40% FTSE Canada Universe Bond Index
4.0 14.7
CC&L Enhanced Balanced Fund 5.1 16.1
20% S&P/TSX Capped Composite Index & 40% MSCI ACWI Net (CAD$) &
40% FTSE Canada Universe Bond Index
3.9 14.2
CC&L Core Income & Growth 6.8 18.6
50% S&P/TSX Composite Index & 25% S&P/TSX Capped REIT Index &
25% FTSE Canada All Corporate Bond Index
6.1 18.9
Alternative Strategies (%) Q2 1 Year
CC&L Multi-Strategy 1 1.5 12.5
FTSE Canada 91 Day T-Bill Index 0.6 3.8
CC&L All Strategies Fund1 1.6 14.0
FTSE Canada 91 Day T-Bill Index 0.6 3.8
CC&L Market Neutral1 3.7 -0.1
FTSE Canada 91 Day T-Bill Index 0.6 3.8
CC&L Q Global Market Neutral (Cdn)1 1.2 14.6
FTSE Canada 91 Day T-Bill Index 0.6 3.8
CC&L Alternative Income1 0.6 6.6
FTSE Canada 91 Day T-Bill Index 0.6 3.8
CC&L Fixed Income Absolute Return Strategy1 0.6 6.0
FTSE Canada 91 Day T-Bill Index 0.6 3.8

About Connor, Clark & Lunn Investment Management Ltd.

Founded in 1982, Connor, Clark & Lunn is a privately owned investment management organization dedicated to delivering outstanding client service and a wide range of attractive investment solutions to our diverse client base. We understand the investment challenges faced by individuals, pension plans, corporations, foundations, mutual funds, First Nations and other organizations, and focus our efforts on meeting their investment needs by offering a comprehensive array of investment strategies, spanning traditional and alternative asset classes in a variety of quantitative and fundamental styles.


Vancouver

2300 – 1111 West Georgia Street

Vancouver, BC V6E 4M3

604-685-2020

.

Toronto

1400 – 130 King Street West

P.O. Box 240

Toronto, ON M5X 1C8

416-862-2020

.

Montreal

1800 McGill College, Suite 1300

Montreal, QC H3A 3J6

514-287-0110


All data except MSCI Indices are as of June 30, 2025 and stated in Canadian dollars (CDN$). Source: Connor, Clark & Lunn Financial Group Ltd., FTSE Global Debt Capital Markets Inc., MSCI Inc., Thomson Reuters Datastream and S&P. Portfolio performance is preliminary, based on a representative account for the applicable strategy and may be subject to change. All performance data is gross of fees unless otherwise stated. Gross performance figures are stated after trading expenses and operating expenses but before management fees and performance fees, if applicable. Operating expenses include items such as custodial fees for segregated accounts and for pooled vehicles would also include charges for valuation, audit, tax and legal expenses. Management fees and additional operating expenses would reduce the actual returns experienced by investors. 1. These strategies are subject to performance fees, which will further reduce actual returns experienced by investors.

For further information on performance, please contact us at [email protected].

Source: MSCI Inc. The MSCI information may only be used for your internal use, may not be reproduced or redisseminated in any form and may not be used as a basis for or a component of any financial instruments or products or indices. MSCI makes no express or implied warranties or implied warranties or representations and shall have no liability whatsoever with respect to any MSCI data contained herein. This report is not approved, reviewed or produced by MSCI.

Arial view of bank towers in Frankfurt, Germany.

Germany has embarked on a historic transformation of its fiscal and economic landscape with the passage of its latest infrastructure bill in March 2025. This legislation, resulting from a rare constitutional amendment, is poised to have profound and far-reaching effects on the German economy, public services and the broader European region over the next decade.

The new law creates a €500 billion infrastructure fund, to be deployed over twelve years, aimed at modernizing Germany’s aging infrastructure and stimulating economic growth. This fund operates outside the traditional constraints of Germany’s “debt brake,” a constitutional rule that previously limited new government borrowing to 0.35% of GDP. The reform also allows for increased borrowing by the federal states and exempts defence spending above 1% of GDP from debt restrictions, thereby freeing up additional fiscal resources for investment.

Last week, the government coalition agreed to borrow almost €500 billion to raise the defence budget to the new NATO target of 3.5% of GDP by 2029, and to borrow almost €300 billion for infrastructure over the same period.

This fiscal expansion should boost domestic demand for many years and more than compensate for weaker external demand. Fixed investment in machinery and equipment, as well as in construction, are likely to benefit from this fiscal impulse.

The infrastructure bill is expected to have positive spillover effects across the European Union. Improved transport links, increased demand for goods and services and a more competitive German economy could strengthen the EU’s overall economic resilience. Furthermore, the focus on energy transition and digitalization aligns with broader European climate and innovation goals.

Konecranes PLC (KCRA HE), one of our holdings in our international strategy, is well positioned to benefit from this massive infrastructure spend.

Konecranes is a global leader in material handling solutions, serving a broad range of customers across several industries. Its product portfolio lifts, handles and moves goods in a safer, more productive and sustainable way. The company reports under three business segments:

  • Industrial services: It provides maintenance services and spare parts for any kind of cranes and hoists. With presence in more than 23 countries, Konecranes has one of the most extensive maintenance coverages globally. This segment represents 36% of revenue but more than 56% of income.
  • Industrial equipment: It provides industrial cranes and hoists for a wide range of customers, including general manufacturing, logistics, distributors, construction and engineering, metals and transportation equipment. This segment represents 29% of revenue and 20% of income.
  • Port solutions: It provides heavy cranes, mobile equipment, software and services for the container handling industry. Konecranes remains the only western player with a broad end-to-end offering for port terminals. Most of the world’s automated container terminals run on Konecranes product. This segment represents 35% of revenue and 24% of income.

Konecranes is exposed to structural growth through increasing automation and digitalization in industry, where its smart lifting and IoT solutions are in high demand. The global rise in e-commerce and logistics boosts demand for its port and warehouse equipment. Sustainability trends drive customers to modernize with Konecranes’ energy-efficient and low-emission solutions. Additionally, infrastructure investment and industrial growth in emerging markets continue to expand its long-term customer base. We believe it is well-positioned to benefit from higher defence and infrastructure spending globally.

International equities made further gains in Q2 despite volatility and weakness in early April due to the threat of significant US tariffs. The EAFE index rose 4.8% in local currency terms and 11.78% in US dollar terms. Communication services was the best performing sector (up 14.24%) reflecting growth in data consumption and video streaming along with a boost to media from ad budgets rebounding. Energy was the worst group (down 6.74%) despite the attack on Iran’s nuclear and military infrastructure by Israel – the oil price nevertheless ended the quarter down 9.5% as measured by Brent.

US inflation data came in softer than expected, with welcome slowdowns in core services and shelter components, reinforcing hopes for Federal Reserve rate cuts later this year. The Fed held its policy rate steady at its June meeting while maintaining a cautious tone, highlighting tariff uncertainty as an ongoing risk. In the labour market, the ADP report showed unexpected private-sector job losses, but the official nonfarm payrolls print surprised on the upside, highlighting mixed signals about underlying economic momentum. Equities ground higher despite these crosscurrents as market participants attempted to balance geopolitical news, tariff announcements, moderating inflation, resilient employment data and uncertainty about the Fed’s next move.

Germany’s constitutional amendment to relax its debt brake to allow an expansion of fiscal policy, notably defence spending, is significant and, for some investors, supports the shift away from US stocks towards non-US markets. The policy has given another boost to European cyclical stocks with quality continuing to underperform. In the UK, employment numbers were shockingly weak but inflation has been pushed temporarily higher by policy decisions, causing the MPC to maintain its “gradualist” approach to rate cuts.

In Asia, Japanese stocks swung between protectionist anxieties and relief driven rallies as ‘Independence Day’ tariffs were paused. High headline inflation reflects food supply issues, with core inflation below 2%, arguing against further BoJ tightening. In China exports have shown limited weakness to date despite a fall in shipments to the US, reflecting a combination of re-routing and diversion to other markets. Meanwhile, US dollar weakness has taken pressure off the RMB, allowing money market rates to fall further.

Sector selection was the main positive over the period with the overweights in IT and industrials and an underweight in energy all adding value. Stock selection was strong in materials and IT. Heidelberg Cement (+33%) benefits from a lack of exposure to tariffs and German fiscal expansion while ASM International (+36%), a manufacturer of equipment used in semiconductor fabrication, reported at the top end of guidance with improved margins and strong demand in China. On the downside in IT, not owning Advantest (+61%) hurt as demand for AI semiconductor testers rose. Performance was negative in industrials where machine power tool makers Makita (-11%) and Techtronic (-12%) were hit by ‘Liberation Day’ tariff announcements, while not owning Siemens Energy (+88%) was a negative – investors view the company as an energy transition play and pushed the share price higher in response to better than expected numbers accompanied by broker upgrades.
In consumer staples, Japanese food manufacturer Ajinomoto (+30%) has exposure to AI through its build-up film product used for semiconductors. Management is successfully focusing on improving return on invested capital (ROIC). Another AI play is holding company Softbank (+38%), which rebounded on the back of the share price of its largest asset, chip designer Arm. In healthcare, Swiss biotech services company Lonza (+11%) rose in a weak sector. The group is seen as a beneficiary of pharma tariffs driving companies to re-shore production.

Activity over the quarter has raised exposure to defence-related names including the introduction of Rolls Royce and Babcock in the UK and Singapore Tech. Aerospace engine maker Rolls Royce is benefitting from improved operational performance and an easing of supply chain issues, while Babcock is now predominantly defence orientated after disposals, having strong positions in nuclear and maritime as well as good revenue visibility. We added Singapore Technologies Engineering after a positive meeting with the CEO. The company supplies munitions and military equipment and has a strong position in cybersecurity.
In consumer staples we have introduced French company Danone which is benefiting from structural growth in health food nutrition with strong positions in probiotics and protein products. Also in France we have added Publicis which specialises in data, media, consulting, technology, and artificial intelligence. It scompetition is in disarray and the company is taking market share and attracting new clients. In the UK we have bought Rightmove, the leading online property portal, which was subject to a recent unsolicited bid, sharpening management’s focus on growth opportunities. In communications we have added Dutch incumbent KPN, which is active only in Netherlands where it has a dominant market share in a three player market, allowing for more attractive pricing dynamics.
We have funded these purchases with a range of sales across sectors. We have reduced financials by exiting Hong Kong Exchanges, thereby lowering exposure to US/China trade war risk, while trimming Macquarie Group in Australia, which is struggling to raise its return on equity. We have exited building materials group James Hardie and reduced online property group Xero after acquisitions that appear to dilute ROIC at best and may be value destructive. In staples we have exited Nestle and Remy Cointreau as well as LVMH in consumer discretionary.

Money trends suggest weakening economic prospects for late 2025, with tariff effects – including payback for a front-loading of activity – set to act as a drag nearer term. We expect the inflation boost from tariffs to be small and temporary with the monetary backdrop still disinflationary. The excess money backdrop has weakened since end-Q1. Investors have begun to question ‘US exceptionalism’, which has helped EAFE markets outperform so far in 2025, and there is growing debate about whether a slowdown in capital flows to the US will accompany a fall in imports due to tariffs – the weak dollar partly reflects this. A significant risk to equities, in our view, is that large fiscal deficits in some countries cause a buyers’ strike by the bond vigilantes, pushing up longer-term yields.
We favour Europe encouraged by the policy shift in Germany, but are underweight Japan where very weak money growth suggests a BoJ policy error and poor economic prospects. Emerging markets appear attractive relative to developed but the risk of further tensions between the US and China means we would rather delay adding until we have clarity on the future trading relationship. Subdued core inflation should allow policy makers to ease policy further which could help quality/growth stocks recover some lost relative performance. We believe the AI theme has further to run with increased spending benefiting a range of stocks across the IT sector. The portfolio is zero weighted autos and miners and underweight retailers and banks. The emphasis is on companies with pricing power and structural growth leading to overweights in software, media, insurance, capital goods and professional services.

The Composite rose by 12.42% (12.25% Net) versus a 11.78% rise for the benchmark.

South Korean holdings outperformed a surging market as Democratic Party leader Lee Jae-Myung won the snap presidential election to replace impeached former president Yoon. An underweight to Taiwan was a detractor as renewed investor enthusiasm boosted the market’s tech stocks. The falling US dollar supported liquidity sensitive Hong Kong names, while shares in mainland China detracted. Stock picking in India was positive led by defence company Bharat Electronics and Max Healthcare. Negative tariff headlines hit Southeast Asia, with stocks and overweight positioning in Indonesia, the Philippines, Malaysia, and stocks in Thailand all detractors. Stock picking in Brazil, Mexico and Peru outperformed strong markets. Stocks in Greece and Poland underperformed, partially offset by overweight positioning as these markets rallied. An underweight to Saudi Arabia was positive, with the market weaker as conflict between Israel and Iran intensified. During the quarter we added to Argentina, Hong Kong, India and Malaysia, and reduced Mexico, Greece, and China.

South Korean financials and technology positions outperformed, rallying on hopes for president Lee Jae-Myung’s election platform of corporate governance reforms. Lee’s Democratic Party are also supporters of the Value-up Program introduced under president Yoon. Market authorities aim to use the initiative to pressure companies into improving governance, returns, and drive higher valuations. Our position in Samsung Life rose 67.7% on expectations reforms will force disposal of company holdings in affiliated companies. Samsung Life selling its position in Samsung Electronics would trigger a huge one-off gain freeing up cash to be re-deployed productively. We trimmed Samsung Life to rotate into laggard DB Insurance, which is cheaper and in our view has greater upside catalysts, being yet to announce Value-up plans. Leading bank KB Financial was another contributor, reporting robust profit growth with a surprise share buyback and cancellation as well as a higher dividend. KB also looks set to benefit from planned fiscal loosening by the Lee government and falling central bank rates boosting loan growth.

Underweight positioning in Taiwan was a detractor as the market rose 26.3% on a revival in sentiment for companies in the AI supply chain. Wireless communications chip designer Mediatek (2.2%) underperformed, partly on the lack of a clear AI catalyst. While it is successfully challenging Qualcomm for market share in high end smartphones, we expect demand for its chips in China to soften in the second half as the sugar hit from consumer electronics subsidies fades. We decided to exit Mediatek to recycle the capital into higher conviction ideas. Aspeed (82.4%) and Accton Technology (44.1%) fared much better. Aspeed is a producer of server management chips and reported rapid sales growth underpinned by AI server demand. Accton specialises in the design and manufacture of high performance data centre switches. We expect demand for AI infrastructure to remain robust as AI applications evolve from reactive, limited chat functions requiring clear inputs and producing limited outputs, to autonomous assistants able to complete tasks. Despite the bright story we are not throwing caution to the wind. DeepSeek’s R1 AI model raises questions over whether software innovation will dent infrastructure demand, while a falling USD will pressure exporters. Our approach is to focus exposure on companies dominating leading edge hardware while avoiding commoditised segments lacking moats and pricing power to mitigate against currency volatility.

Strong performance from Hong Kong financials offset drag from stock picking in mainland China. Chifeng Gold Mining led domestic holdings, along with contributions from China Merchants Bank and ICBC. Alibaba stumbled on regulators delaying deployment of BABA AI services on iPhones in China. We reduced mainland exposure in favour of Hong Kong. While modest fiscal stimulus on the mainland fades, liquidity surged in Hong Kong as its Monetary Authority intervened against a falling USD to maintain the HKD-USD peg, causing rates to plunge. The monetary boost supported a rally in Hong Kong Exchanges and Clearing (HKEX), AIA Group and Prudential. The current environment looks encouraging for HKEX, which reported that a record 208 companies applied for a listing in the year to end-June. A-to-H share listings have been a demand driver, and our investment in Chifeng is an example. Earlier this year we were fortunate to have met their entrepreneurial and ambitious management team before being invited to participate in the Chifeng H-share IPO at a discount, with proceeds to be used as funding for deals outside China. We ultimately made a large trim to the position as it doubled within a few months of purchase.

Greek and Polish equities surged over 50% through the year on the back of rising sentiment for European equities driven by fiscal expansion in Germany. While overweight positioning was a positive as both markets rallied during the quarter, this was offset by underperformance in Polish consumer names and not owning the Greek banks. Polish fashion retailer LPP was the main laggard with margins under pressure from an aggressive store rollout plan, as operating expenditures climb on hiring costs. However, in our talks with LPP, management confirmed that they will scale back the rollout, especially among smaller stores, which will benefit margins. LPP should benefit from healthy consumer demand supported by the Polish government’s loose fiscal footing. The strong economy and relatively high rates are also a boost for holding Bank Pekao’s profitability, trading on 1.25x book with a 23% ROE.

Contributions from stock picking across rallying markets in Latin America were strong. In Brazil, high end jewellery chain Vivara, water utility SABESP and property developer Cyrela outperformed. Agribusiness lender Banco do Brasil was the largest detractor, reporting poor results including rising loan delinquencies. We exited the stock on a view that weak agricultural prices have taken a bigger toll on the sector than first thought. Strength in Brazilian equities belies a volatile macro backdrop souring on president Lula’s fiscal profligacy. Our contrarian take is that Brazil’s economic malaise presents an opportunity in that it makes Lula’s re-election unlikely. A conservative victory in the 2026 federal elections could usher in an era of fiscal responsibility which would be a huge upside catalyst for stocks trading at cheap valuations. In Mexico we moved to zero weight by exiting high ROE bank Banorte. While the bank’s performance has been robust, we expect slowing loan growth moving forward. However, what is more concerning is Mexico’s deteriorating institutional quality following president Sheinbaum’s pursuit of judicial reform culminating in popular election of judges across the country in June. The regressive vote strengthens the ruling Morena party’s grip over what was a relatively independent judiciary.

President Trump’s desire to reduce the US trade deficit has important implications for financial markets. If the US trade deficit shrinks then the need for foreign capital to finance imports falls. Less foreign demand for USD assets should boost weak EM currencies and under-owned equities which have faced the headwind of a strong dollar. Things start to break when the dollar reaches such extremes, and whether it be through the market mechanism or politics, reversion eventually occurs. President Nixon ended dollar-gold convertibility in 1971, and slapped tariffs on the rest of the world in response to rising balance of payments pressures. The Plaza Accord under President Reagan in the 1980s was an attempt to rebalance trade through currency intervention. The dollar fell hard in both cases. There are echoes of these interventions in today’s “Trump shock”, and if this includes a shift to a weak dollar regime we could see a cycle of EM reflation. An EM currency tailwind will bring about easing credit conditions feeding into economic and corporate earnings growth, attracting capital flows. If this virtuous circle takes shape, we believe that understanding the reflexive linkages that currencies, money and credit have with company fundamentals will be crucial in navigating a new market regime.

The Composite rose 11.84% (11.61% Net) versus an 11.99% rise for the benchmark.

The latest signal from monetary data is that global economic momentum will inflect weaker from around late 2025. Cyclical considerations suggest that this will mark the beginning of a sustained downswing into 2027.

Lagged money trends argue that underlying inflation will fall further and remain low through 2026. Nevertheless, central banks may be slow to offset economic weakness with additional policy stimulus because of concerns about tariff effects and fiscal indiscipline, as well as scarring from the 2021-22 inflation surge.

The suggestion is that equity markets face rising headwinds, with another sustained bull phase unlikely before 2027, when key cycles are scheduled to bottom. An appropriate strategy may be to underweight markets where monetary trends are relatively weak – Japan and the UK currently – while overweighting sectors with lower earnings sensitivity to expected cyclical weakness.

Elaborating on the above, global six-month real narrow money momentum – a key leading indicator in the approach followed here – reached a local high in March, falling sharply in April / May – see chart 1.

Chart 1

Chart 1 showing G7 + E7 Real Narrow Money (% 6m)

The rise from October 2024 into March suggested that the global economy would regain some momentum from around mid-2025, based on the recent average lag. A June rise in manufacturing PMI new orders could mark the start of such a shift, although results from national (as opposed to S&P Global) surveys were mixed. Still, April / May monetary weakness argues that any near-term recovery will be short-lived, with economic indicators likely to deteriorate again from around late 2025 – chart 2.

Chart 2

Chart 2 showing Global Manufacturing PMI New Orders & G7 + E7 Real Narrow Money (% 6m)

The latest fall in real money growth has been broadly based across countries, reinforcing the negative signal. Momentum is notably weak in Japan and the UK, arguing for economic underperformance. Eurozone growth has held up but hasn’t yet crossed above the US, cautioning against “europhoria” – chart 3.

Chart 3

Chart 3 showing Real Narrow Money (% 6m)

From a cyclical perspective, the stockbuilding cycle is in the window for a peak in terms of both time since the last low (Q1 2023) and the contribution of inventory accumulation to annual G7 GDP growth – chart 4. The latter has been boosted by front-loading to avoid tariffs, which appears to have continued in Q2.

Chart 4

Chart 4 showing G7 Stockbuilding Cycle G7 Stockbuilding as % of GDP (yoy change)

The cycle should turn down by early 2026 at the latest and the baseline assumption here remains for a low in H1 2027, implying that the current cycle will be slightly longer than the 3.5 year historical average, balancing a shorter-than-average prior cycle. Stockbuilding cycle downswings are usually associated with significant slowdowns (or worse) in global economic growth and underperformance of risk assets.

A key question is whether the coming downswing will be accompanied by weakness in the housing and / or business investment cycles, in which case a 2026-27 recession becomes the baseline. A housing downturn is more likely, given the maturity of the current cycle (16 years versus an 18-year average) and downward pressure from elevated longer-term interest rates. The business investment cycle is less advanced (year five versus a nine-year average), with corporate financial balances still healthy and AI deployment providing a tailwind.

Close attention, therefore, should be paid to housing indicators. The six-month rate of change of G7 housing permits / starts recently turned negative, suggesting a darkening outlook – chart 5.

Chart 5

Chart 5 showing G7 Industrial Output & Housing Permits / Starts* (% 6m) *Permits for US, Germany, France, Italy; Starts for Japan, UK, Canada

Inflation follows money growth with a roughly two-year lag, according to the simplistic monetary rule, which outperformed every other forecasting approach in 2021-22. Annual broad money growth bottomed in mid-2023 in the G7 and a year later globally, with limited subsequent recoveries. The suggestion is that underlying inflation will fall further and remain low through 2026.

On the analysis here, therefore, central banks could limit economic weakness by delivering timely additional policy stimulus while still meeting, or even undershooting, their inflation objectives. The US Fed, however, may continue to drag its feet amid uncertainty about near-term tariff effects and counterproductive political pressure, with a knock-on effect on the pace of easing elsewhere.

Both global “excess” money flow indicators used here to assess equity market prospects are currently negative, having been mixed three months ago. Specifically, global six-month real narrow money momentum has crossed back below industrial output momentum, while 12-month real money momentum remains beneath its long-run average – chart 6.

Chart 6

Chart 6 showing MSCI World Cumulative Return vs USD Cash & Global “Excess” Money Measures

The indicators were misleadingly negative in 2023-24 because of a stock overhang resulting from the 2020-21 money growth surge. The assessment here is that there is no longer any excess relative to current levels of nominal GDP and asset prices.

A further rise in China’s trade surplus over the past year has been accompanied by bumper growth of US dollar deposits in Hong Kong, suggesting that Chinese entities have been building a hedge against RMB depreciation – see chart 1.

Chart 1

Chart 1 showing China Trade Balance in Goods (12m sum, $ bn) & Hong Kong Customer Deposits in US$ (yoy change, $ bn)

US dollar deposits grew by $139 bn or 15.6% in the year to April to stand at $975 bn, equivalent to 4.5% of US M2. They have risen much more strongly than Hong Kong dollar deposits, now representing 92% of the value of the latter, up from 79% at end-2022.

Low inflation has allowed China to gain competitiveness without nominal depreciation, with the BIS real effective rate at a 13-year low – chart 2.

Chart 2

Chart 2 showing China Broad Effective Exchange Rate (BIS, 2020 = 100)

Is demand for US dollar balances starting to wane? The recent fall in Hong Kong rates is consistent with a switch into local dollars. The one-year Hong Kong / US rate differential is the most negative since 2005, before a sustained appreciation of the RMB – chart 3.

Chart 3

Chart 3 showing Hong Kong / US 1y Deposit Rates & USD/CNY

Chinese f/x settlement numbers, meanwhile, indicate that the authorities intervened to hold down the RMB for a second month in May. Upward pressure had been signalled by a forward premium on the offshore RMB, which has persisted in June – chart 4.

Chart 4

Chart 4 showing China Net F/x Settlement by Banks Adjusted for Forwards ($ bn) & Forward Premium / Discount on Offshore RMB (%)

The onshore spot rate has moved from the weak end to the middle of the PBoC’s trading band, with the central parity rate edging higher – chart 5.

Chart 5

Chart 5 showing USD/CNY & PBoC Central Parity Rate

Any signal from the Chinese authorities of acquiescence to an appreciating trend could quickly become self-fulfilling by encouraging a further unwind of hedges, including via a reduced US dollar share of Hong Kong deposits.

Chinese monetary trends suggest a continuation of lacklustre economic growth with negligible inflation.

Six-month momentum of narrow and broad money picked up strongly during H2 2024, raising hopes of a reflationary scenario. Growth rates, however, have fallen back since Q1, to around the middle of ranges in recent years – see chart 1.

Chart 1

Chart 1 showing China Nominal GDP* (% 2q) & Money / Social Financing* (% 6m) *Own Seasonal Adjustment

May activity numbers confirm an economic slowdown, with six-month growth of industrial output and fixed asset investment falling again, and home sales contracting at a faster pace. Retail sales were boosted by subsidy programmes and promotions, with payback likely – chart 2.

Chart 2

Chart 2 showing Chinese Activity Indicators* (% 6m) *Own Seasonal Adjustment

House prices haven’t stabilised. The three-month change in new house prices has stalled below zero, with that for existing homes becoming more negative – chart 3.

Chart 3

Chart 3 showing China House Prices

Monetary developments don’t yet warrant pessimism. Six-month broad money momentum remains respectable, at 4.0% – 8.2% annualised – in May. This could be consistent with nominal GDP growth of c.6.5% pa, based on a long-run trend rise of 1.75% pa in the money to GDP ratio.

Narrow money momentum has weakened more sharply but the sectoral breakdown is reassuring, showing stable growth of household and enterprise money, with the aggregate slowdown due to a fall in demand deposits of government-related bodies – chart 4.

Chart 4

Chart 4 showing China New M1 Components (% 6m)

This fall is unlikely to be a leading indicator of reduced spending by these bodies, particularly as their overall deposit growth – i.e. including time as well demand deposits – has remained stable.

The money numbers, moreover, exclude fiscal (i.e. central government) deposits, six-month growth of which has picked up since Q1. Demand deposits of government-related bodies could recover as funds are transferred to finance spending projects.

Colorful alleys and streets in Guanajuato city, Mexico.

We have written extensively in recent months on how monetary and currency signals may be hinting that we are on the cusp of a “virtuous circle” for performance in EM equities. For any who missed it, a few recent pieces below:

Implications of Asian currency tremors

‘Beautiful’ tariffs and the end of exceptionalism

Are emerging markets on the cusp of a ‘virtuous circle’?

This is the most bullish we have been on the outlook for emerging market equities in over a decade.

Recent momentum has been positive, with MSCI EM up 9% to the end of May, part of a broader upswing in markets outside of the United States.

MSCI Price Indices
USD Terms, 31 December 2024 = 100
Line graph showing MSCI price indices from December 31, 2024.
Source: LSEG Datastream

Macquarie Capital investment strategist Viktor Shvets wrote earlier this month that, in May, EM excluding China recorded the largest net inflow since December 2023. India ($2.3 billion), Taiwan ($7.6 billion) and Brazil ($2 billion) received the largest flows, helping to buck a trend of selling through 2024 and early 2025.

EM ex-China Net Foreign Flows (US$ bn) – strong flow reversal
Line graph showing the net flows of emerging markets excluding China.
Source: Bloomberg; Macquarie Global Strategy (May 2025)

Persistent negative outflows over the past decade from EM into the United States have driven what by many measures is an unprecedented valuation gap.

US relative to the rest of the world forward PE and dividend yield
Line graph showing the US relative to the rest of the words forward PE and dividend yield.
Source: CLSA (April 2025)

Some premium is no doubt deserved given stronger US growth versus the rest of the world post-GFC, along with a better environment for capital and innovation. However, such extreme valuations imply lofty relative future growth expectations and leave US equities vulnerable to negative catalysts.

As John Authers wrote in his Points of Return column for Bloomberg:

Ultimately, EMs benefit most from the decline of US exceptionalism, giving central banks room to cut rates, as noted by Points of Return, and letting fiscal authorities spend without worrying about tanking the currency.

In a world where no one is exceptional, as Macquarie’s Shvets puts it, EMs are no longer penalized. At best, he calls the fall of American exceptionalism a process, not a collapse — creating conditions for a gradual rise in US risk premia while avoiding disorderly asset repricing. Investors will continue narrowing spreads between US and non-US assets, supporting EMU and Japan. Ditto for EMs, especially those with stronger secular drivers, with India, Korea, and Taiwan standouts.

Currency tailwind for EM

Line graph showing East Asia currency values versus the US dollar from December 31, 2024 to present.
Source: NS Partners & LSEG

Winners and losers

Despite being caught up in Liberation Day tariff chaos, MSCI China has returned 13.1% over the same period. Since 2023, China has been one of the strongest equity markets in the world. Despite the rally, valuations in many of the high-quality businesses that we like remain modest.

Two line graphs illustrating the 12-month forward PE for the MSCI China and MSCI China private sector.

Source: Jefferies (March 2025)

Having led the way for EM over the last few years, Indian stocks returned just 3% as sentiment moderates.

South Korea bounced 18.7% as domestic political risks eased following the impeachment of former president Yoon Suk Yeol following his failed attempt to impose martial law in December 2024. Former opposition leader Lee Jae-myung was elected to the presidency in early June and will immediately grapple with a contracting economy which has been hit further by US tariffs.

Taiwan has been a laggard, its market flat over the period which includes the DeepSeek shock that hit AI supply chain stocks on fears of lower demand for the hardware used to power the technology.

Stocks in Southeast Asia are yet to fire this year despite being beneficiaries of a falling USD and improving global liquidity. Perhaps investors remain fearful that these smaller, open trading economies risk getting trampled at the feet of the two fighting elephants in the United States and China. In a meeting with our CIO Ian Beattie earlier this year in London, Malaysian Prime Minister Anwar explained what a difficult position his country is in. China is Malaysia’s biggest trading partner and second largest investor, while the United States is its largest investor and second largest trading partner! If trade tensions between China and the United States cool, then these markets should soar.

Elsewhere, South African stocks have boomed, rising 24.4% powered in part by the country’s gold miners, along with a tentative improvement in politics under the ruling national ANC/DA coalition.

Brazil and Mexico have largely avoided president Trump’s ire and have rallied despite challenging political and economic backdrops, up 20.0% and 28.3% respectively.

Huge rallies in Greece (47.5%) and Poland (43.3%) have been driven by a powerful cocktail of geopolitical realignment between Europe and the United States and fiscal stimulus combined with cheap valuations. The most notable catalyst has been Germany’s dramatic policy shift under Chancellor Friedrich Merz. His government has proposed a sweeping €500 billion infrastructure investment plan and a major increase in defence spending. Crucially, the proposal includes exempting defence expenditures exceeding 1% of GDP from the constitutional “debt brake,” a move that would allow for significantly more fiscal flexibility.

Turkey bucked the trend (-15%), the market tanking on news President Erdogan jailed a political rival on trumped up corruption charges. The portfolio is zero-weight Turkey, and we are not tempted by ever cheaper valuations while Erdogan threatens the rule of law.

Finally, the GCC was a mixed bag with Saudi Arabia (-5.2%) hit by a weaker oil price, while the UAE (14.9%) was much stronger.

Caveat

Monetary data in the United States had been signalling a slowdown this summer, and this is now likely to be exacerbated by tariffs with a muted recovery in the latter half of 2025. The best-case scenario for EM at present would be contained US economic weakness, a slowdown in underlying inflation and a sustained pace of rate cuts. The story would be one of a late-cycle catch-up in EM performance, as illustrated by the table below.

Stockbuilding cycle & markets: EM, small caps, industrial commodities lagging – catch-up potential?
Chart illustrating the percentage changes of various indices over previous cycles.
Source: LSEG Datastream, own calculations / dating, as at 2 June 2025

We would expect EM to underperform in a hard-landing scenario, although this might be temporary given the lack of prior outperformance, followed by a strong early cycle phase. The chart from CLSA below shows prior phases of early cycle outperformance.

Emerging equities are an early cycle play: EM equity outperformance phases post US recessions
Line graph showing prior phases of early cycle performance.
Source: CLAS, MSCI, NBER

Mexico’s scorching rally belies deteriorating institutional quality

Ducking US tariffs and in prime position to benefit from US friendshoring, Mexico has been one of the top performing emerging markets this year. Strong stock picking in our portfolio allowed us to keep up despite an underweight to the country. However, we have used the rally as an opportunity to take profits and increase our underweight on a view that investors underestimate the impact of recent judicial elections.

In June last year we flagged the potential for Morena’s dominance in congressional and presidential elections to expose investors to rising institutional risks – Political risks in EM spike as Indian, South African and Mexican elections surprise:

Crucially for investors, AMLO and Morena are pursuing policies that could threaten Mexico’s institutions. Institutional quality is a key factor in determining whether a country moves up the economic development ladder. …

Investors fear that a strengthened mandate will allow Sheinbaum (or even an outgoing AMLO) to undermine judicial independence,and pursue plans to eliminate autonomous government agencies overseeing telecoms, energy and access to information, as well as weaken electoral supervisory bodies.

Morena under president Sheinbaum pushed ahead with an unprecedented judicial overhaul, with Mexican citizens voting in early June to elect judges including for the Supreme Court. As reported by Bloomberg on the 2nd of June – Mexico Judicial Election Sees 13% Turnout in Historic Vote:

The controversial election asked voters to pick judges among several thousand hopefuls which marked a first of its kind experiment for a large democracy. The judicial overhaul could give Sheinbaum broad influence over a revamped judiciary, the only branch of government the leftist Morena party does not control.

Critics of the process argue that this will undermine the rule of law by injecting more politics into legal and constitutional disputes.

Only 13% of registered voters turned out to participate, tasked with choosing between thousands of candidates, while accounting for specialties while selecting an equal number of men and women.

Politicising the selection of the judicial officers compromises Mexico’s separation of powers between the executive, congress and judiciary. This is a step backward as it undermines the institutional pluralism within the country’s system of government, where different power centres provide checks and balances and ways for the system to self-correct.

Regressive judicial reform coupled with a fragile economy hit by tariff uncertainty, falling remittances from a deteriorating US labour market and deportation fears is the basis for added caution.

Risks are to the downside for Mexico’s industrial production in 2025
Chart comparing current performance of various sectors to their performance last year.
Source: GBM (June 2025)

Exposure to Mexico in our portfolio is now c. 1% versus c. 2% for the benchmark.

Given the direction of travel in macro risk, we will debate whether to downgrade our country rating for Mexico further in the coming weeks. We are always seeking competition for capital in the portfolio, and in LatAm we are seeing interesting opportunities emerge in places like Argentina, Peru and Brazil, all competing for risk budget.

Photo of Bryce Walker.

We would like to announce that Bryce Walker has taken on the role of President and CEO of Connor, Clark & Lunn Funds Inc. (“CC&L Funds”) and has been named Ultimate Designated Person (“UDP”).

Tim Elliott is joining Connor, Clark & Lunn Investment Management Ltd. (“CC&L Investment Management”) in a role on its institutional client solutions team, effective July 1, 2025.

Bryce Walker joined CC&L Funds in 2012 as Vice President, Business Development, leading sales and service efforts in Western Canada. In 2018 he became Senior Vice President, Business Development, taking on the leadership of the sales and service teams across all of Canada.

Tim Elliott originally joined Connor, Clark & Lunn Financial Group Ltd. (“CC&L Financial Group”) in 2007 and founded CC&L Funds in 2012 with the aim of delivering unique and proven institutional investment strategies to the Canadian wealth management market through full-service investment dealers and the multi-family office channel. Since that time, the firm has grown rapidly in assets, strategies and people, to be recognized as a leader in the market for separately managed accounts (“SMAs”) and in liquid alternative and niche investment fund strategies.

“I’m very proud of the team and business that we have built at CC&L Funds in delivering unique, institutional-calibre investment solutions and in creating strong partnerships with some of the best Advisors and organizations in Canadian wealth management,” said Tim Elliott. “I’m really excited to be joining CC&L Investment Management at a time of rapid institutional growth for the firm, and also to see where Bryce and our terrific team can take the CC&L Funds business from here.”

“Tim and I have worked closely together for the past 12 years in building a business that is relatively unique in Canada, given our specialized approach in the wealth market, backed by one of Canada’s largest privately owned asset managers. I’m excited to lead the business forward through this next phase of growth and expansion,” said Bryce Walker.

This transition will support the strong growth for both CC&L Investment Management, particularly in the institutional market, and for CC&L Funds in Canadian wealth management, and is consistent with CC&L Financial Group’s long-term approach to succession planning.

About Connor, Clark & Lunn Funds Inc.

Connor, Clark & Lunn Funds Inc. partners with leading Canadian financial institutions and their investment advisors to deliver unique institutional investment strategies to individual investors through a select offering of funds, alternative investments and separately managed accounts.

By limiting the offering to a focused group of investment solutions, CC&L Funds is able to deliver unique and differentiated strategies designed to enhance traditional investor portfolios. For more information, please visit www.cclfundsinc.com.

About Connor, Clark & Lunn Investment Management Ltd.

Connor, Clark & Lunn Investment Management Ltd. is one of the largest independent partner-owned investment management firms in Canada with $78 billion in assets under management. Founded in 1982, CC&L Investment Management offers a diverse array of investment services including equity, fixed income, balanced and alternative solutions including portable alpha, market neutral and absolute return strategies. For more information, please visit cclinvest.cclgroup.com.

About Connor, Clark & Lunn Financial Group Ltd.

Connor, Clark & Lunn Financial Group Ltd. is an independently owned, multi-affiliate asset management firm that provides a broad range of traditional and alternative investment management solutions to institutional and individual investors. CC&L Financial Group brings significant scale and expertise to the delivery of non-investment management functions through the centralization of all operational and distribution functions, allowing talented investment managers to focus on what they do best. CC&L Financial Group’s affiliates manage over $142 billion in assets. For more information, please visit www.cclgroup.com.

Contact

Lisa Wilson
Manager, Product & Client Service
Connor, Clark & Lunn Funds Inc.
416-864-3120
[email protected]