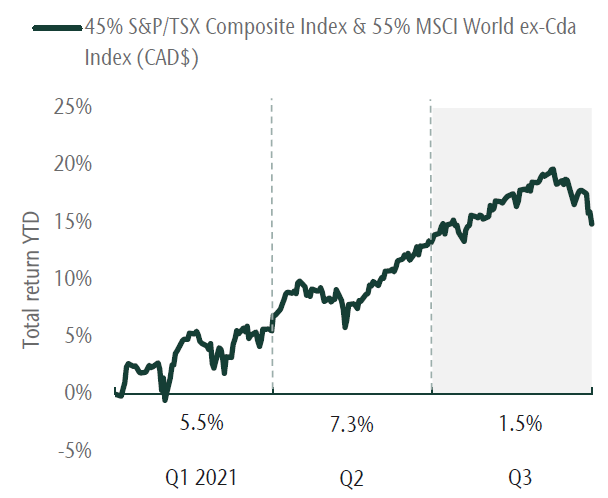
The economic recovery from the pandemic has been strong and more enthusiastic than expected. There is a surge in demand for goods which is contributing to supply shortages and rising inflation. Given the backdrop, policymakers are beginning to reduce the emergency level stimulus that was put in place. The equity market response has been more volatility and lower returns than earlier in the recovery. This is expected given the outlook for more moderate growth and less support from central banks. On the quarter the S&P/TSX Composite Index was up 0.2% and the MSCI World ex Canada (C$) advanced 2.5%. Year to date this brings these market returns to 17.5% and 12.6%, respectively.
More moderate equity returns in Q3
Source: MSCI, Refinitiv
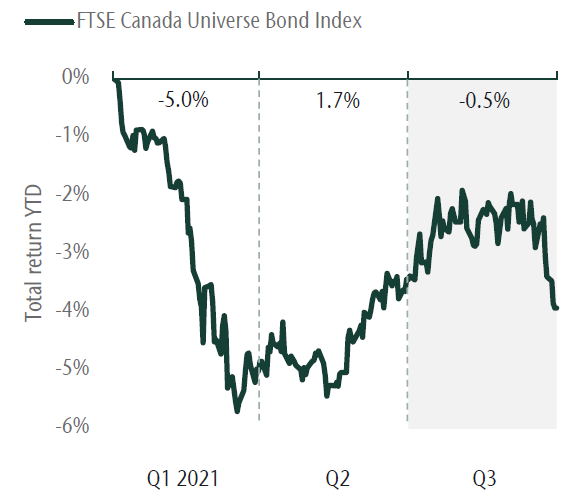
Bonds produced negative returns this quarter and year as yields were affected by both a surge in growth earlier in the year and recent changes to central bank policy. The FTSE Canada Universe Bond Index was down -0.5% for the quarter and down -4.0% for the year. High yield and short bonds, which are less sensitive to changes in yield, generated positive returns.
Bond returns remain negative
Source: FTSE, Refinitiv
Portfolio strategy
Our view is that we are experiencing a strong economic recovery supported by a broadening global restart. At the same time we expect higher inflation and a more muted monetary response going forward. We maintain an overweight to equities but recognize risks are rising. As equity market performance has been strong, we have taken profits. Within equities, we have an overweight to small-cap stocks which will benefit from above trend growth. Within bonds, we have been increasing our high yield exposure which is more attractive than core bonds given their low expected return.
Our portfolio management teams continue to favour more cyclical companies that are levered to the economic recovery. However, given the outlook for slower economic growth, inflation and supply bottlenecks, we are adding companies that can generate strong earnings despite these headwinds. Within fixed income, we have taken profits by reducing exposure to the corporate sector as well as real return bonds that have benefited significantly from higher inflation. Our positioning in portfolios has served clients well and remains attractive as we move into the final quarter of the year.
From the desk of Jeff Guise, Managing Director, Chief Investment Officer, CC&L Private Capital.
This post is for information only and is not intended as investment advice. The views expressed are those of the author at the time of publication and are subject to change at any time.
Global industrial output has flatlined since early 2021, reflecting supply disruptions but also a loss of demand momentum. Output may recover into 2022 as supply problems ease but money trends signal a further weakening of underlying momentum. Second-round inflation effects, meanwhile, may force central banks to bring forward plans for stimulus withdrawal – unless markets weaken sharply. This backdrop suggests retaining a cautious investment strategy unless money trends rebound in late 2021 – possible but not a central scenario.
The ”monetarist” forecasting approach used here relies on the rules of thumb that 1) real narrow money growth directionally leads demand / output growth by 6-12 months (average 9 months) and 2) nominal broad money growth directionally leads inflation by 1-3 years (average 2+ years). Global narrow / broad money growth surged in 2020 but has slowed this year. This slowdown is being reflected in a loss of economic momentum but the inflationary impact of the 2020 bulge will continue well into 2022. Current “stagflation” concerns, therefore, are likely to persist.
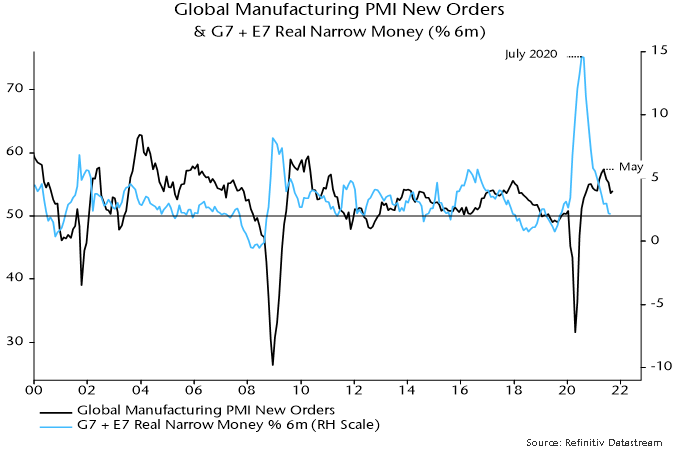
Supply chain disruption is distorting economic data, complicating analysis. The presumption here is that the global manufacturing PMI new orders index is a reasonable guide to underlying industrial demand momentum. The index has fallen since May, mirroring an earlier decline in global (i.e. G7 plus E7) six-month real narrow money growth from a July 2020 peak – see chart 1. With real money growth sliding further into July / August 2021, the suggestion is that the PMI new orders index is unlikely to reach a bottom before early 2022.
Chart 1
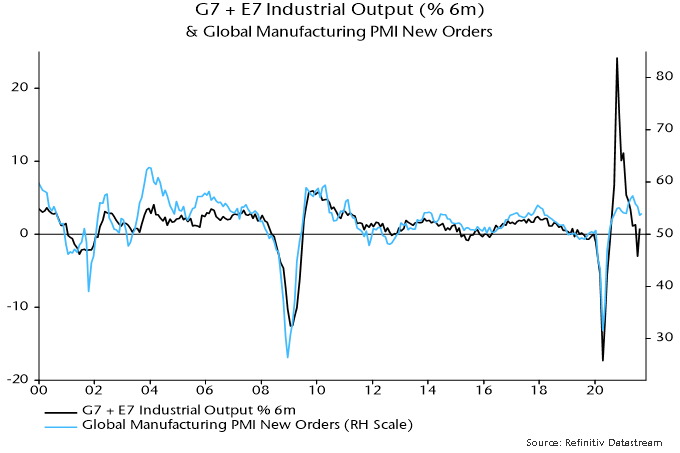
Supply chain disruption, however, has resulted in a substantial undershoot of industrial output relative to the growth rate suggested by the PMI new orders index, implying scope for a short-term catch-up – chart 2. Market participants could wrongly interpret such a pick-up as a reversal in trend momentum. Confusing signals could lead to greater market volatility but any revival in the cyclical / reflation trade is likely to be short-lived unless monetary trends – and hence PMI prospects – improve.
Chart 2
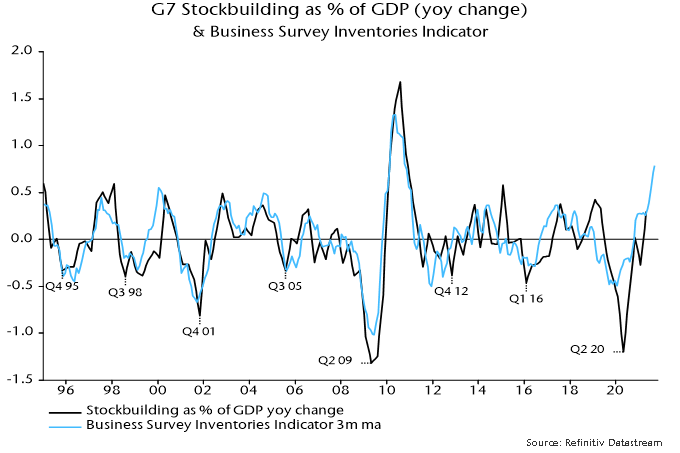
The approach here uses cycle analysis to cross-check monetary signals and provide longer-term context. The 3-5 year stockbuilding and 7-11 year business investment cycles are judged to have bottomed in Q2 2020 and are currently providing a tailwind to the global economy, cushioning the impact of less expansionary monetary conditions.
The next cyclical “event” will be a peak and downswing in the stockbuilding cycle. Based on its average historical length of 3 1/3 years, the next cycle low could occur in H2 2023, implying a peak by H2 2022 at the latest. The business survey inventories indicator calculated here, however, suggests that the cycle upswing is already well-advanced, hinting at an early peak – chart 3.
Chart 3
The upshot is that monetary trends suggest a slowdown in global economic momentum through early 2022 while the stockbuilding cycle is likely to act as a drag from H2 2022. This leaves open the possibility of a resumption of strong economic growth in a 2-3 quarter window around mid-2022. An immediate rebound in global real narrow money growth, however, is needed to validate this scenario.
Such a rebound is possible despite the Fed and other central banks moving to wind down stimulus. It could be driven, for example, by Chinese policy easing to support a weak economy, a sharp reversal in commodity prices as industrial momentum softens (boosting real money growth via a near-term inflation slowdown) or a pick-up in bank lending (normal at this stage of stockbuilding / business investment cycle upswings). It is, however, unnecessary to speculate – it is usually sufficient for forecasting purposes to respond to monetary signals rather than try to anticipate them.
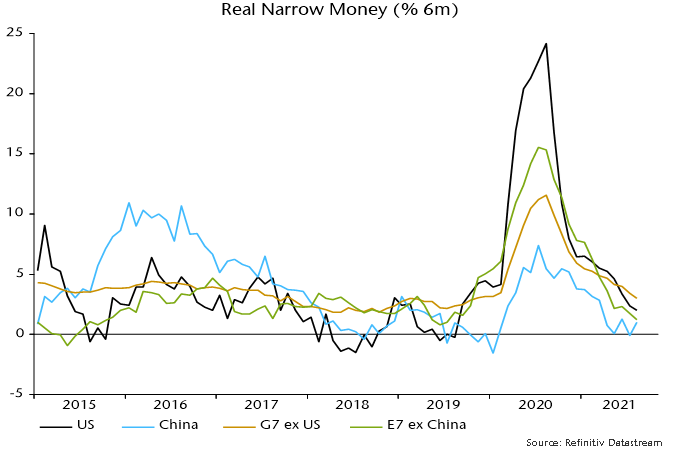
Chart 4 shows a breakdown of G7 plus E7 six-month real narrow money growth. Earlier US relative strength / Chinese weakness has been reflected in divergent year-to-date equity market performance, with DM ex. US and EM ex. China indices charting a middle course. A recent cross-over of US real money growth below the G7 ex. US average suggests reducing US exposure in favour of other developed markets.
Chart 4
Chinese real money growth, meanwhile, was showing signs of bottoming before the recent escalation of financial difficulties at property developer Evergrande. This could result in faster policy easing, an “endogenous” tightening of credit conditions, or both. The net monetary impact is uncertain but a recovery in money growth in late 2021 would argue for adding Chinese exposure in global and EM portfolios despite likely further weakness in economic data.
Investors continue to debate whether high inflation is “transitory” as central bankers naturally assert. The monetarist view is straightforward: the roughly 2-year transmission of money to prices implies no significant inflation relief before H2 2022, while a return to pre-covid levels requires a further slowdown in global broad money growth.
Inflation drivers are likely to shift, with energy and other industrial commodity prices cooling as the global economy slows but offsetting upward impulses from food, rents and accelerating unit wage costs as labour shortages and mismatches force pay rises above productivity growth.
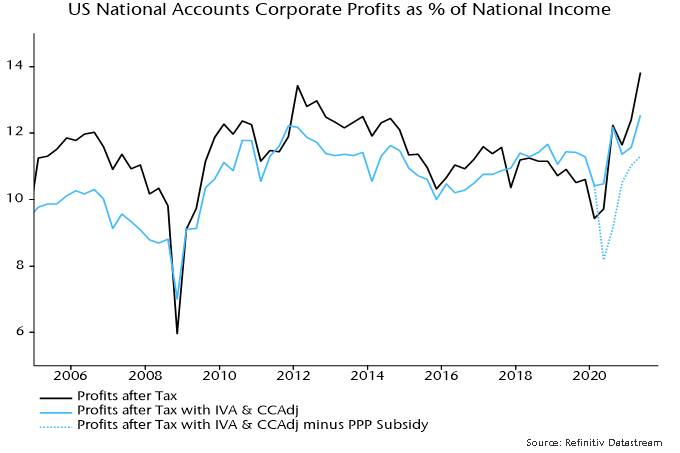
Rising labour costs could, in theory, be absorbed by a reduction in profit margins rather than being passed on in prices. Recent profits numbers, however, overstate underlying health because of stock appreciation and pandemic-related government support. The share in US national income of an “economic” measure of corporate profits (i.e. adjusted for inventory valuation effects and Paycheck Protection Program subsidies, and to reflect “true” depreciation) is in line with its average over 2010-19, in contrast to inflated book profits – chart 5.
Chart 5
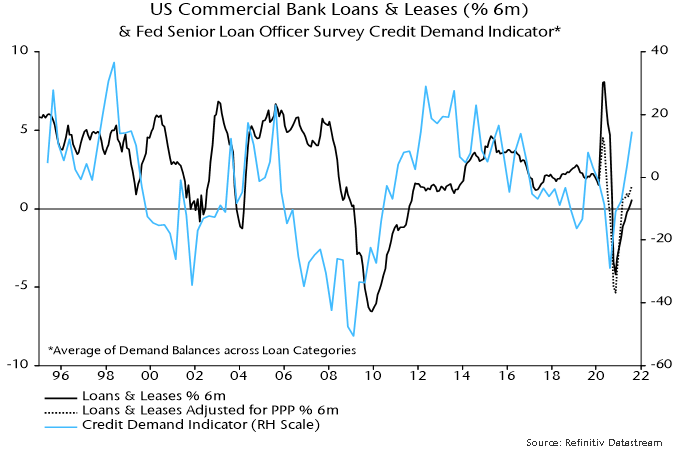
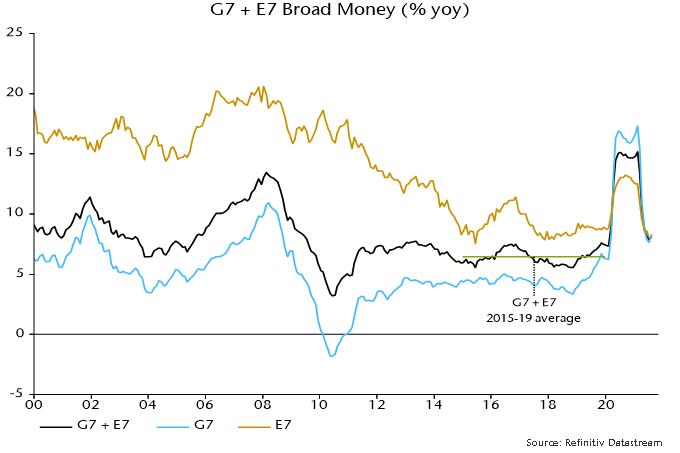
G7 annual broad money growth has fallen from a peak of 17.3% in February 2021 to 8.3% in August, with 3-month annualised growth at 6.2%. This is still high by pre-covid standards: annual growth averaged 4.5% over 2015-19. Reduced support to money growth from QE could be offset by faster expansion of bank balance sheets, reflecting strong capital / liquidity positions and rising credit demand. US commercial bank loans and leases have recently resumed growth, with the Fed’s senior loan officer survey suggesting a further pick-up – chart 6. The ECB’s lending survey is similarly upbeat.
Chart 6
Adding in the E7, annual broad money growth is closer to the pre-covid level, at 8.2% in August versus a 2015-19 average of 6.4% – chart 7. Growth is below average in China, Mexico and Russia and in line in India. Inflationary pressures are more likely to prove “transitory” in these economies, suggesting support for local bond markets.
Chart 7
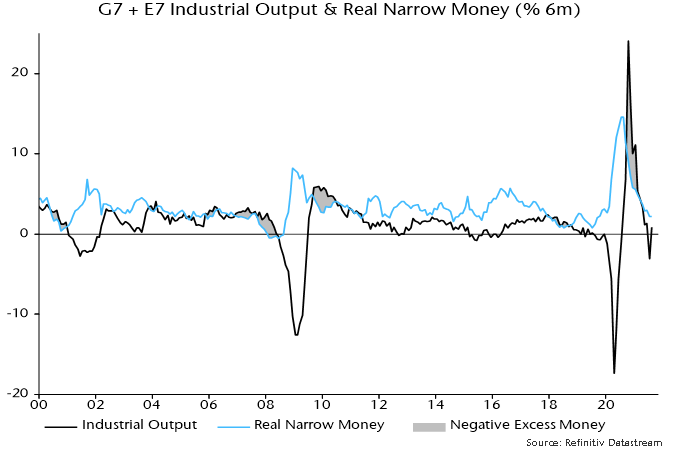
Global equities held up over the summer despite weaker activity news and upside inflation surprises. A monetarist explanation is that markets were supported by “excess” money, as supply disruptions contributed to global six-month industrial output growth falling below real narrow money growth – chart 8. A temporary output catch-up as supply problems ease could reverse this crossover – a further argument for maintaining a cautious investment stance emphasising defensive sectors and quality.
Chart 8
Thanksgiving is the time of year when we reflect on the fortunate aspects of our lives and show our appreciation for friends, family and those who support us. At CC&L, we are thankful for our local food banks and the support that they continue to provide in the communities in which we live and work.
Food banks have come to play a vital role in many people’s lives, particularly as COVID-19 has created additional food insecurity for more families across the country. Since the start of the pandemic, food banks have seen a rise of more than 50% in the number of people requiring their services. If the current trend continues, Toronto food banks will see 1.4 million visits by the end of 2021.1
The CC&L Foundation has donated to the Daily Bread Food Bank in Toronto for a number of years and has recently furthered support with a multi-year commitment. The Daily Bread Food Bank was founded in 1983 and has become one of Canada’s largest food banks. It believes no one should go hungry or face barriers to accessing food. Its nearly 200 food programs across Toronto aim to provide healthy and nutritious meals to people experiencing food insecurity.
“Although a sense of normalcy is returning to our city, for tens of thousands of individuals living in poverty, the reality is very different. In August 2021, there were over 113,000 visits to Daily Bread member food banks – a 67% increase compared to the same time last year,” says Neil Hetherington, CEO, Daily Bread Food Bank. “We are deeply grateful to CC&L for stepping forward this Thanksgiving season with a generous donation that will help ensure that the right to food is realized for our adults, seniors and children experiencing food insecurity in our city.”
About the Connor, Clark & Lunn Foundation
Created in 1999, the CC&L Foundation is supported by CC&L Financial Group and its affiliates and it responds to requests from clients, staff and others to fund programs and not-for-profit organizations that help promote a better environment, improvements to education, advances in science and medicine, stronger communities and the arts.
1 Dailybread.ca
During the late 1950s, Gerald Tsai pioneered the strategy of momentum investing. He started the first publicly traded aggressive growth fund while working at Fidelity Management. The fund grew from $12.3 million in 1959 to $340 million in 1965. The term “go-go” was frequently used to describe this aggressive way of investing.
The 50s and 60s were golden years for the United States (US) economy and the stock market. During this time, we saw the rise of the professional fund manager, with the mutual fund industry managing $38.5 billion in assets and representing a quarter of all transactions on the stock market.[1] They had no idea they were creating a bubble, which would eventually burst. Since then, we have seen this pattern play out countless times, and yet, momentum investing never died out. In fact, it is back with a vengeance and will inevitably end in tears.
The Nifty Fifty
Momentum investing really took off when market commentators identified fifty stocks, which soon became the darlings of Wall Street. These companies shared strong traits, like high-quality franchises, good balance sheets, and strong topline growth. As these companies delivered higher returns, investors rewarded them with ever-increasing multiples.
Most professional investors started their careers on Wall Street in the 60s, so at this point, they had only seen the market go up.[2] They had just one rule when it came to the Nifty Fifty stocks – and the rule was buy!
The markets were so frothy that even legendary investor Warren Buffet closed his investment partnership on May 29, 1969. In the late 60s, Buffett noted in his letters that the number of attractive investment opportunities was rapidly diminishing. As a result, investors were piling onto the “winners”, regardless of price.
When the bears woke up in 1973, the Nifty Fifty stocks initially held up when compared to the rest of the market. However, it was just a matter of time before they saw severe selling pressure. As one columnist at Forbes Magazine put it, “the Nifty Fifty were taken out and shot one by one”.
The arrival of the Four Horsemen
Fast forward to the late 90s when the “information super highway” sprang forth from cyberspace, and the only companies that mattered, had something to do with the internet. Back then, Microsoft, Intel, Cisco, and Dell were referred to as the “Four Horsemen” given their total dominance in the tech world. There were times when these four represented 55-60% of the Nasdaq price movement. Not surprisingly, investors were attracted to tech due to the general adoption of the internet and sweeping investments in technology and telecom infrastructure.
The four were later joined by companies like Oracle, EMC, Sun Microsystems, AOL, eBay, and Yahoo. Eventually, the tech bubble burst, giving us yet another example of why momentum investing comes with a lot of risk.
The evolution of FAANGM
The tech bubble may have burst, but our obsession with tech giants lives on. Over the last few years, a new cohort of companies caught the eyes of momentum investors. Originally, they were called FANG stocks (Facebook, Amazon, Netflix and Alphabet). Eventually, the group evolved into FAANG (Adding Apple) and later FAANGM (adding Microsoft). These stocks are long recognized as powerful market movers. But how long will these giants rule?
Some similarities from the Nifty Fifty years
Just like in the 60s, investors and professional fund managers who joined Wall Street after the financial crisis of 2008 have only seen the market go up. While there has been some volatility from events like Brexit and the pandemic, the market has been consistently strong. The new breed of investor has only seen interest rates drop and governments eager to bail out the economy by printing money. In this environment, the only rule is to buy, buy, buy.
Robin Hood Army and WFH boredom
There is growing evidence that working from home (WFH) boredom has been driving many unsophisticated or non-professional investors to start playing the market. Historically, retail investors have not played a major role in the movement of individual stocks. However, according to research from Pipe Sandler, this has changed. Since COVID-19’s impact, we are seeing a high correlation between retail user accounts and stock price fluctuations.
The retail-investing approach unfortunately seems too simple: buy regardless of fundamentals or valuations.
Out-of-control valuations
The combined market cap of FAANGM is over $9 trillion dollars, which is greater than the MSCI World Small Cap Index, which has 4,432 constituents. The entire US stock market is worth $51 trillion dollars, meaning FAANGM stocks represent almost 18% of the market.
While it’s true these businesses are growing fast and their margins are better, a lot of the margins for companies like Google, Amazon, and Microsoft are from cloud computing, which over the long run is a commodity product and whose price has been falling. As a comparison, back in the 60s, Coke and McDonald’s were delivering hyper growth and attracting legions of investors who thought the party would never end. But eventually, the law of large numbers kicked in. That level of growth is unsustainable.
The mounting risk
Regulatory – There are numerous anti-trust lawsuits against FAANGM across the world. South Korea became the first country in the world to ban Google and Apple from requiring users to pay for apps with their own in-app purchasing systems. Facebook is fighting the Federal Trade Commission’s antitrust lawsuit while also facing a backlash from the whistleblower hearings.
Inflation and Interest rates – Looking back to the Nifty Fifty, interest rates were a lot higher, and globalization and automation were providing deflationary pressure. At the moment, interest rates are almost as low as they can get, unless we are going negative. Enormous liquidity released by the various central banks worldwide are giving rise to inflationary pressure.
Meanwhile, the debate over what is transitory and what is not continues. A higher interest rate will reduce the valuation for growth stocks. An inflationary environment will eat into the earnings power, which will lead to a lower multiple.
Portfolio impact
We do not participate in momentum investing. Our portfolio has much faster growth than the index, and is currently trading at a discount to our index. Our companies continue to deliver strong topline and bottom-line growth in their latest reported earnings. Our portfolio holdings have a strong balance sheet and a third of our companies have no debt. As money begins to move out of the various highflyers, we believe our names are ideally positioned to benefit from the reallocation.
[1] https://www.jstor.org/stable/40721527
[2] The Go-Go Years: The Drama and Crashing Finale of Wall Street’s Bullish 60s, By John Brooks
Crestpoint Real Estate Investments Ltd. (“Crestpoint”) is pleased to announce it is expanding its product offering to include a dedicated commercial mortgage strategy.
The Commercial Mortgage Strategy (“the Strategy”) will be led by Blake Steels, Vice President, Head of Mortgage Investments. Steels, a seasoned private markets real estate investment manager, joined the Crestpoint team in October 2021, bringing over 12 years’ experience in the real estate debt and equity markets.
“The forthcoming launch of our Commercial Mortgage Strategy marks an exciting new chapter for Crestpoint,” said Kevin Leon, President & Founder, Crestpoint. “Our strong understanding of individual properties and the real estate market positions us well to provide timely and customized responses to borrowers which should translate into strong risk adjusted returns for our investors. We are excited to have Blake Steels at the helm of this Strategy.”
The Strategy is a higher yielding short-term fixed income strategy with a focus on capital preservation over the long term, designed to generate attractive risk adjusted returns by providing borrowers with different options to address their capital needs. The Strategy will be standalone, separate from the Core Plus Real Estate Strategy. The primary focus of the Strategy will be on conventional and conventional plus mortgages on properties located in Canada.
About Crestpoint Real Estate Investments Ltd.
Crestpoint Real Estate Investments Ltd. is a commercial real estate investment manager, with $6.3 billion of gross assets under management, dedicated to providing investors with direct access to a diversified portfolio of commercial real estate assets. Crestpoint is part of the Connor, Clark & Lunn Financial Group, a multi-boutique asset management company that provides investment management products and services to institutional and high net-worth clients. With offices across Canada and in Chicago and London, Connor, Clark & Lunn Financial Group and its affiliates are collectively responsible for the management of approximately $100 billion in assets. For more information, please visit: www.crestpoint.ca.
Contact:
Kevin Leon President Crestpoint Real Estate Investments Ltd. (416) 304-6632 [email protected]
The global manufacturing PMI new orders index – a timely indicator of industrial momentum – registered a surprise small rise in September, with weaker results for major developed economies foreshadowed in earlier flash surveys offset by recoveries in China and a number of other emerging markets.
Does this signify an end to the recent slowdown phase, evidenced by a fall in PMI new orders between May and August? The assessment here is that the rise should be discounted for several reasons.
First, it was minor relative to the August drop. The September reading was below the range over October 2020-July 2021.
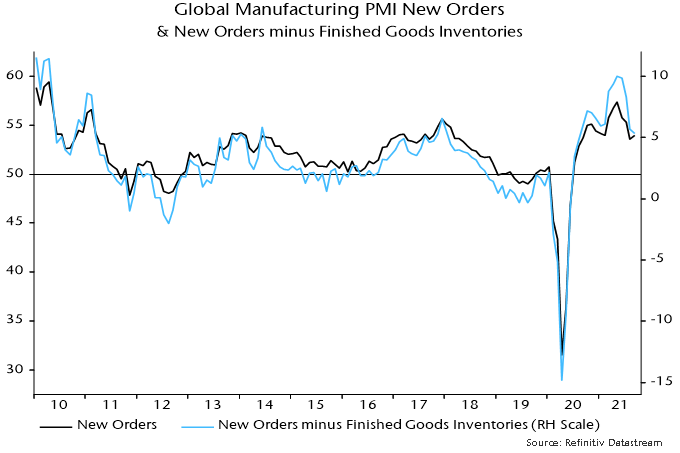
Secondly, the increase appears to have been driven by inventory rebuilding. The new orders / finished goods inventories differential, which sometimes leads new orders, fell again – see chart 1.
Chart 1
Remember that orders growth is related to the second derivative of inventories (i.e. the rate of change of the rate of change). Inventories are still low and will be rebuilt further but the pace of increase – and growth impact – may already have peaked.
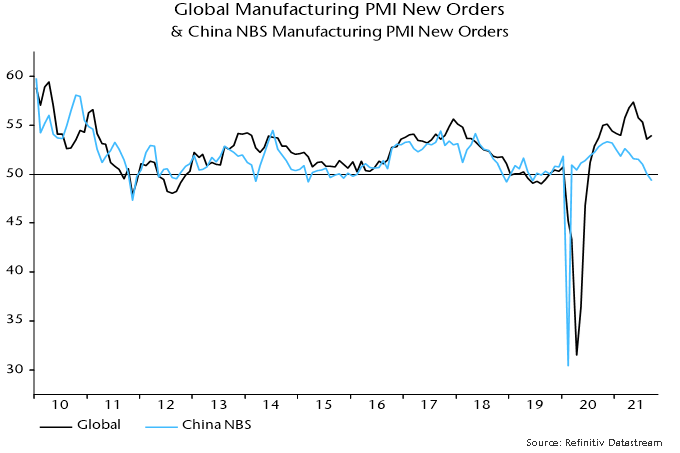
Thirdly, the recovery in the Chinese component of the global index was contradicted by a further fall in new orders in the official (i.e. NBS) manufacturing survey, which has a larger sample size. The latter orders series has led the global index since the GFC – chart 2.
Chart 2
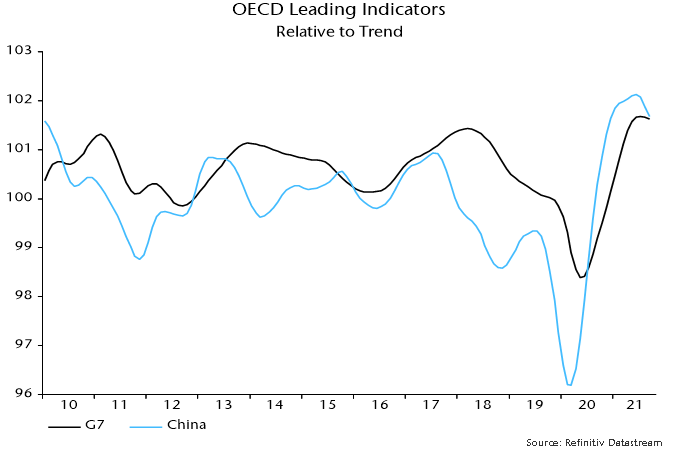
Fourthly, the OECD’s composite leading indicators for China and the G7 appear to have rolled over and turning points usually mark the start of multi-month trends. The series in chart 3 have been calculated independently using the OECD’s published methodology and incorporate September estimates (the OECD is scheduled to release September data on 12 October). The falls in the indicators imply below-trend and slowing economic growth.
Chart 3
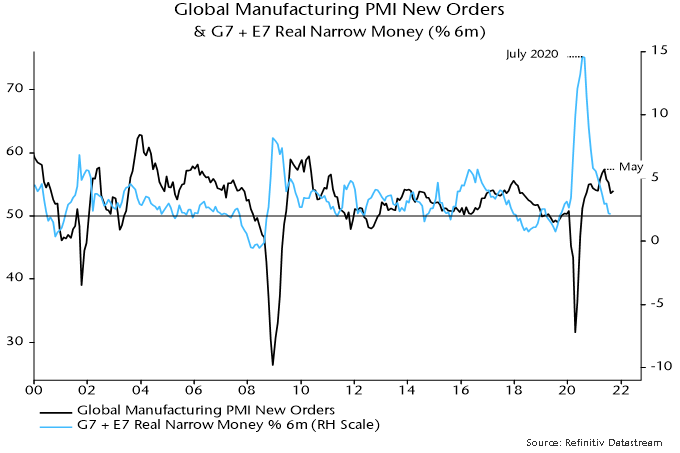
Finally, additional August monetary data confirm the earlier estimate here that G7 plus E7 six-month real narrow money growth was unchanged at July’s 22-month low – chart 4. The historical leading relationship with PMI new orders is inconsistent with the latter having reached a bottom in September. The message, instead, is that a further PMI slide is likely into early 2022, with no signal yet of a subsequent recovery.
Chart 4
While the focus of inflation is typically centered on rising raw material costs and wage increases, we are seeing transportation costs become an additional and significant part of the inflation problem, and one that is not as easily passed on to consumers.
Transportation affects every aspect of a company’s supply chain and the rising costs are unavoidable. Further, it has been a recent topic of conversation for our own holdings, as well as some of the largest companies in the world. At a recent conference, Molson Coors, the fifth largest brewer in the world, said transportation costs are the main contributing factor to inflation, while Proctor and Gamble warned that an announced price increase will not be enough to offset higher commodity and transportation costs due to not only the size, but the speed of the increases. Multinational conglomerate 3M is a good barometer, as it is seeing “a lot of pressure on logistics costs.” Dollar Tree is one of the largest retail importers in the United States (US) and at their recent quarterly earnings presentation, they spent a considerable amount of time discussing the global supply chain and higher freight costs, saying they were “not counting on material improvements in 2022, especially in the first portion of the year.”
The recovery from the pandemic has seen a huge increase in demand, but with continued quarantine controls, distancing measures at ports and labour shortages are causing severe backlogs. The Suez Canal blockage and summer typhoons off the Chinese coast did little to ease the problem. Another consideration is the consolidation of ocean shipping lines’ key shipping routes being dominated by a handful of companies, causing fewer vessels in general to be travelling between ports.
The ocean carriers have responded to the high demand by increasing container capacity by 22%, but this does not solve the problem of logjams and the waiting lines reaching record levels at some of the ports.[1]The order book for container ships has doubled in 2021, but the majority won’t be delivered until 2023.
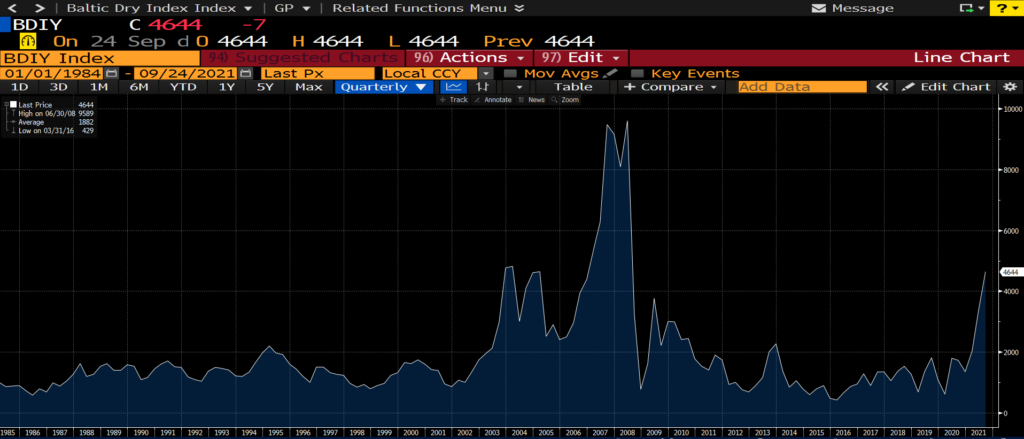
So what does all this mean? Container rates seem to be stabilizing, yet remain extremely elevated. Freightos, a digital booking platform for international shipping, published containerized freight rates. The cost of a container from Asia to the US East Coast is over $20,000, an increase of 415% compared to last year. Shipping from Asia to the US West Coast is slightly less, but the cost is up 452% in comparison to a year ago. Shipping from Asia to North Europe has seen the largest year-over-year increase, up 714% to $13,855. Freight rates from Northern Europe to the US East Coast have been the least affected, up “only” 238% from the period last year to $5,929. In view of these rates, shipping companies are focusing on the most profitable trade routes, meaning reduced volumes crossing the Atlantic. The Baltic Dry Index is a benchmark for the price of shipping major raw materials by sea and is at its highest level since before the Great Financial Crisis.
Source: Bloomberg
The majority of companies are struggling to solve this logistical headache, but our portfolios contain two names that have been natural beneficiaries.
Clipper Logistics (CLG.LN) is a leading provider of value-added logistics solutions, e-fulfilment, and returns management services to the retail sector, primarily in the United Kingdom (UK), but with an expanding presence in Europe. Sales are comprised of the following: 60% of sales come from e-fulfilment and returns management, supporting the online activities of customers; 28% of sales come from non e-fulfilment businesses, supporting traditional brick and mortar customers; and the remaining 12% of sales comes from commercial vehicles sales. Of the logistics related revenues, 85% comes from the UK. Over 90% of Clipper’s contracts are on an open book basis (i.e. cost plus), or hybrid contract, protecting them from increasing costs. However, they are not immune to labour shortages, as they recently flagged the impact that a shortage of HGV drivers is having.
Kerry Logistics (636.HK) is a third-party logistics service provider based in Hong Kong with global exposure. The company provides many supply chain solutions, including integrated logistics, international freight forwarding (air, ocean, road, rail, and multimodal), industrial project logistics, cross-border e-commerce, last-mile fulfilment, and infrastructure investment. Revenue mainly comes from Asia-Pacific, which accounts for 74% of sales (Mainland China 32%, Hong Kong 13%, Taiwan 7%, and other Asia 21%). The Americas accounts for 16% and Europe about 10%. Their customers are mainly big multinational companies, across many industries, including fashion, electronics, food and beverages, FMCG, industrial, automotive, and pharmaceutical.
Perhaps the best advice we could give readers is that with supply chain and transportation issues showing little signs of abating, you would be wise to start your holiday shopping sooner, rather than later.
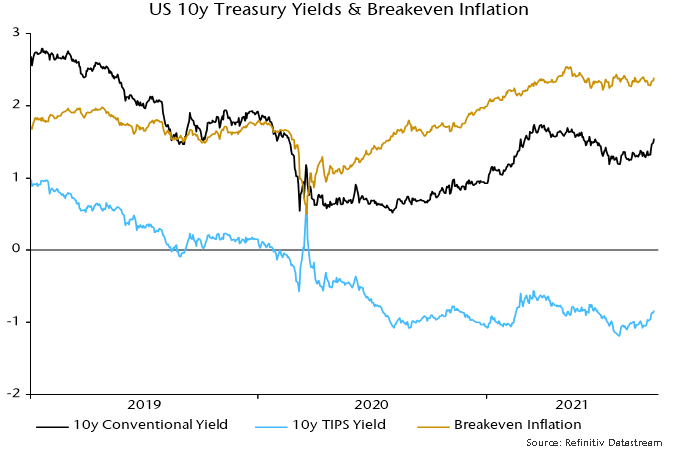
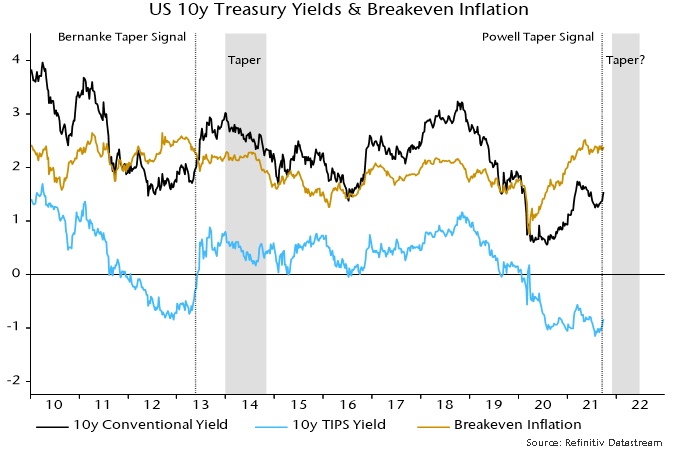
US Treasury yields have risen sharply since Fed Chair Powell’s signal last week of a likely tapering decision at the November or December FOMC meeting. The move higher mainly reflects an increase in real yields, with inflation break-evens range-bound – see chart 1.
Chart 1
The reaction recalls a surge in nominal and real yields when former Chair Bernanke signalled that the Fed was considering tapering in Congressional testimony on 21 May 2013. Inflation breakevens, which had been falling into the announcement, declined further before recovering – chart 2.
Chart 2
Bernanke’s signal was a catalyst for real yields – which had reached negative levels similar to recently – to return to positive territory. The yield surge triggered a short-lived “risk-off” move in markets, focused on emerging markets and credit (the “taper tantrum”).
The market response spooked the Fed, causing the taper decision to be delayed until December 2013. When tapering finally started in January 2014, nominal and real yields embarked on a sustained decline. Inflation breakevens moved sideways but also fell later in 2014.
Cyclical sectors of equity markets outperformed defensive sectors between Bernanke’s May announcement and the start of tapering in January.
The view here, though, is that investors should be cautious about drawing parallels between 2013-14 and now.
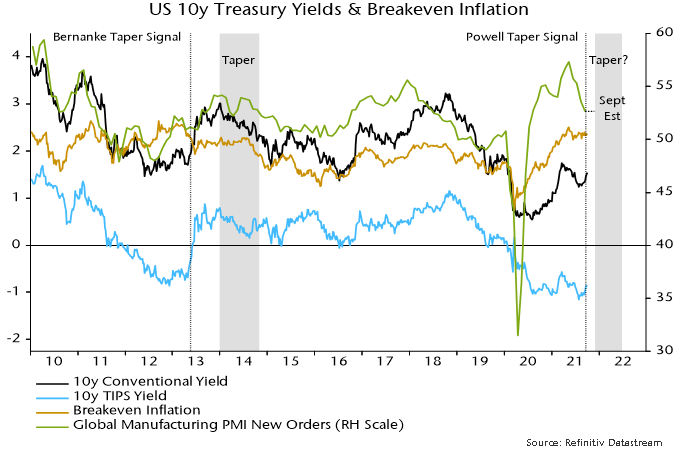
The economic backdrop is a key difference. The global manufacturing PMI new orders index was about to embark on a significant rise as Bernanke gave his taper signal in May 2013 – chart 3. So it is difficult to disentangle the taper effect on yields from the usual correlation with cyclical momentum.
Chart 3
Economic momentum is slowing currently, with money trends suggesting a further PMI decline into early 2022.
This suggests that 1) the yield increase won’t mirror 2013 because the taper announcement effect is offset by a weakening cyclical backdrop, and 2) any rise in real yields could be dangerous for cyclical assets because – in contrast to 2013 – a higher discount rate is unlikely to be balanced by positive economic / earnings news.
In this special commentary, we discuss the evolving Evergrande situation. While we do not hold Evergrande in our portfolio, we wanted to share our views because it is the most indebted real estate company in the world, and has created lots of volatility in the global financial market.
Background on Evergrande
Evergrande is the second largest property developer in China in terms of sales value. The company has 160,000 employees and close to 4 million employees related to Evergrande’s activities. It has a total debt of RMB 2 trillion (around USD $300 billion, equivalent to 1% of deposits in China, and almost 2% of China’s GDP), including interest-bearing debts of RMB 571 billion, pre-sale of RMB 216 billion, payables of RMB 963 billion, and wealth management products of RMB 100 billion. It is one of the most levered real estate companies in the world, but its debt is still minor in relation to China’s financial system as a whole. Considering the above data, we believe China’s financial system can absorb, without any mayor problem, all the losses from this company.
Potential of creating a contagion effect on the broader global financial markets?
This is not another Lehman. We think the contagion effect on the broader global financial markets is limited. The Evergrande saga remains a domestic issue. The Chinese government has enough capacity to intervene and will do so to reduce the contagion risk.
The recent news is an example: Evergrande reached an agreement with yuan bondholders on an interest payment due September 23, 2021, without clarifying the terms. The Chinese government injected RMB 120 billion into the banking system on September 22, 2021.
The major risk is a contagion to other developers, banks, suppliers, holders of Evergrande’s wealth management products, and home buyers. A possible scenario is that the government could take over the problem companies with state-owned enterprises (SOE).
As the property policy is unprecedentedly tight at this moment, the government has plenty of room to loosen if they want. It is likely that they are willing to wait in order to show that the real estate sector is not “immune” but that they can come in at any time in order to preserve financial stability. Many loans to Evergrande made by Chinese banks are implicitly backed by the government. We believe that the first priority for the government is to ensure that the pre-sold apartments are delivered to the buyers, otherwise, there will be serious social unrest.
Regulatory headwinds coming from China
The key words for China’s policy is currently “Common Prosperity,” which fundamentally entitles a policy shift towards reducing wealth inequality. The concept is not new; it has been a long-term goal of the Chinese government that has become more relevant recently.
The Central Party and State Council jointly announced the plan on June 10, 2021, establishing Zhejiang province as the pilot zone. The 14th five-year plan (2021-2025) called for an “action plan” to be fully implemented by 2050, to become an advanced, modern economy. Among common prosperity goals are narrowing the income gap, tackling the increasing real estate prices, promoting higher household income growth, increasing public services, such as healthcare and education, and improving living conditions of rural residents, among many others. These common prosperity initiatives will likely rebalance the economy from investments to consumption, targeting the midlow-income population. Moreover, the state’s role in public and private sectors is likely to become more relevant.
In the upcoming Politburo meeting this December, policymakers will set priorities for next year.
Appendix
Examples of contagion risks:
Other developers will find financing more difficult, if investors lose confidence in them. Project sales will also become more difficult. As a matter of fact, the selling prices of properties are controlled by the governments, so developers are not able to sell their properties at discounts.
Suppliers should be more cautious on payment terms and conditions on other developers. They would also see lower demand and production. Some may need to cut jobs or wages, causing weaker household consumption.
Home buyers (more than a million) are also heavily protesting at Evergrande’s offices causing their construction projects to be halted. Home buyers that are working with other developers may also doubt their houses would be delivered, therefore, causing more selling pressure.
Local governments receive transfers from the central government with bond issues via Local Government Financing Vehicle (LGFV) which are collateralized with land use rights. Raising funds for local governments could eventually become more complicated.
More default scenarios of individual companies are also likely to occur. For example, Sinic (2103 HK) was implied to have financial problems, and the stock slumped 87% on September 20, 2021.
Chinese government successfully resolved the interbank credit crunch in 2013. Tools that the government could use this time:
Easing liquidity: RRR cut, liquidity injection
Verbal support
Controls of LGFV financing likely to become less tight
Loosening of property policy
Accelerating LG bonds
Maintaining low rates
Persuading banks to lend
The systemic risk is not high.
Although Evergrande has a larger balance sheet (RMB 2.4 trillion) than Huarong (RMB 1.6 trillion) and Anbang (RMB 1.5 trillion), its asset contains largely land lots which are much more “tangible than the other financial companies.”
Since the government controls the financial system, many SOEs could be strategic investors of Evergrande and also adjust the property policies.
When the People’s Bank of China (PBoC) initiated its support to the property sector (printing money) in-mid 2014, it granted a long term loan to China development bank. PBoC said at that time, “A change emerged in the base money supply channel.”
The government could buy their own land, as they did in 2014-2015.
In the case of Evergrande, the government can let them fall, avoiding a contagion or make an orderly debt restructuring. In similar cases they have taken actions. In the case of Anbang, several SOEs took up the company and formed a new insurance company. In the case of Huarong, Citic Group (a SOE) and other “strategic” investors capitalized the company.
Thoughts on the stock market
It is worth noting that the Chinese government seems to have downplayed the importance of paying too much attention to short-term growth. They indeed have a short-term buffer, considering the 2021 GDP target is “above 6%,” and the country is likely to grow in the range of 8% this year. The current outlook is more focused on solving structural problems, which may have short-term collateral consequences, but the vision is to improve the long-term perspective. Indeed, President Xi has emphasized on numerous occasions that the aforementioned long-term goals are not just an economic objective, but serve as the Party’s “governing foundation”. The foregoing is still interesting, since, as previously mentioned, the Western vision is often different. Billions of dollars have been lost in market capitalization of the Chinese assets sector, driven by strict regulatory policy in the afterschool tutoring, together with anti-monopoly and cybersecurity rules in the internet sector. The government has also tightened property policies. Currently, a blanket of uncertainty persists regarding “which sector will be regulated next.” For example, almost one month ago, a state media article equated the gaming industry, which has many companies that trade on the stock market, to “opium”. Although the government quickly quashed this article and there were no official statements, it caused a rapid slump of shares linked to the gaming sector, reflecting the prevailing nervousness among investors. The government recently released new regulations for the industry, including limiting the amount of time children can play video games to three hours a week, and last week state media mentioned that companies should avoid the sole focus of pursuing profit, in order to prevent minors from becoming addicted to games. This sentiment led to another round of losses in gaming-related stocks.
We believe China is trying to improve its society in the long term, but are not very concerned about the effect this may have on investors in the short term. The question then is; how can we better cope and adjust to these policies for the benefit of our clients? China accounts for around 10% of the MSCI EM Small Caps index, making it an important investment for our EM Small Cap fund. Our approach to this new environment is to understand the domestic perspective and invest in companies/sectors that are subject to less regulation and more likely to benefit from the new trends that we see emerging in the future. Each scenario presents a new opportunity and the trends include:
Greater self-reliance on government-fostered technology (semiconductors, artificial intelligence);
Renewable energy;
Fitness;
Consumption favouring local brands/companies; and
Manufacturing industry and robotics for products designed mainly to support and strengthen the Chinese economy.
The global pandemic has caused a sharp, worldwide economic contraction, with supply and demand severely affected across many industries. However, the real estate market was one of the few to experience strong and sustained growth in 2020 and 2021. House prices rose consistently, driven by robust demand and constrained supply.
On the demand side, buyer interest has surged since summer 2020, as people are scrambling to take advantage of low mortgage rates due to fear of missing out. According to the Mortgage Bankers Association (MBA), in the United States (US), the value of mortgage originations for new purchases increased by 13% in 2020, in comparison to 2019, despite the fact that most economic activities were effectively halted in April and May 2020. As America’s biggest generation, millennials have entered their prime years of purchasing power, driving the demand for houses even further. On top of that, as people spend more time at home during the pandemic, demand for bigger spaces increased significantly.
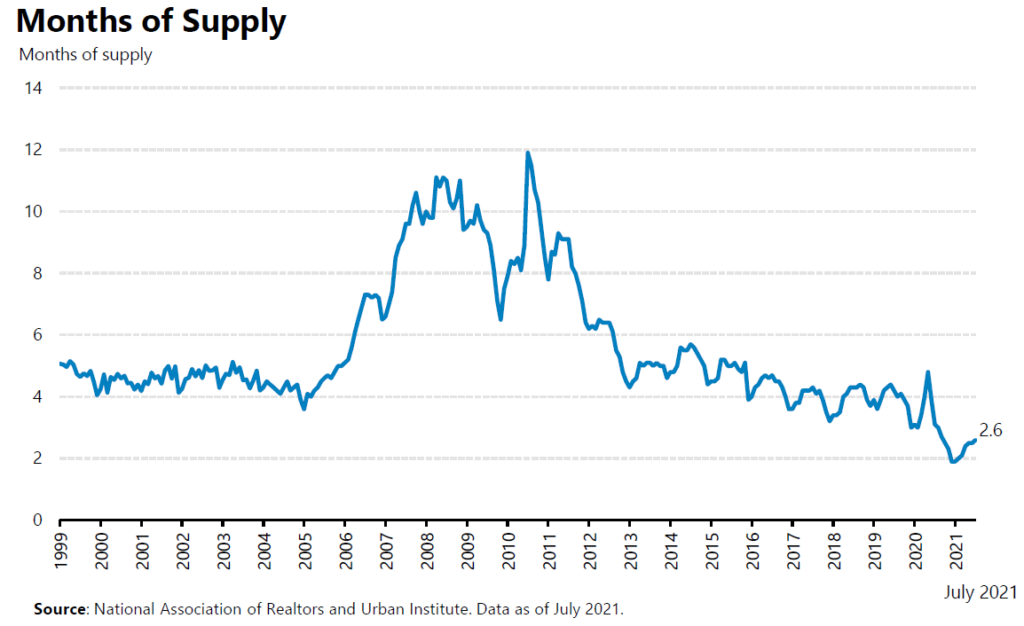
On the other hand, supply has been extremely tight. In the US, months of supply in July 2021 was 2.6, which is an increase from the record low of 1.9 in January 2021, but still at a historically low level. Historically, a balanced market has been defined as 6.0 months of supply. Even before the pandemic, there was a shortage of homes for sale. From 2010 to 2019, the US had the lowest number of homes built than any other decade since the 1960s.[1] From 2010 to 2019, only 5.8 million homes were built, compared to over 27 million homes built from 2000 to 2009. Strong demand for housing in recent years, fueled by low mortgage rates, has exaggerated the imbalance of supply and demand. As a result, house prices keep going up.
The strong residential market is not limited to the US. In the United Kingdom (UK), house prices have been increasing consistently since May 2020. In June 2021, the average house price was £266,000, up 13.2% year over year and 4.5% month over month. This is partially due to the stamp duty holiday introduced in July 2020 to help homebuyers and boost the UK property market during the pandemic. Even though the stamp duty holiday will gradually taper from July 2021, demand still outstrips supply, and prices are expected to stay on the upward trend. One of our holding companies, Savills (SVS LN), has been benefiting from this trend. Founded in 1855, Savills is one of the world’s leading property service providers for both residential and commercial properties. They have a dominant position in many markets across the globe, with more than 600 offices across the Americas, Europe, Asia Pacific, Africa, and the Middle East. In the first six months of 2021, Savills hit record profits thanks to the hot UK housing market, with revenue in the country having increased by 40% year over year.
This housing boom has been positive news for homeowners; CoreLogic analysis shows homeowners with mortgages (roughly 62% of all properties) in the US have seen their equity increase by a total of $1.9 trillion since the first quarter of 2020, an increase of 19.6% year over year. However, it has also reduced housing affordability, and shut a growing number of people out of the housing market. In the US, homeownership has been falling after its previous peak of 69% in 2004.[2] In the second quarter of 2021, homeownership dropped to 65.4%, which is 2.5 percentage points lower than in Q2 2020. The rate varies significantly by race, with the biggest gap observed between non-Hispanic white households and Black households, homeownership rates for which were 74.2% and 44.6%, respectively. If the trend continues, the US homeownership rate will decline to 62% by 2040.
Therefore, it is crucial to increase the supply of affordable homes to meet the needs of future homeowners and renters. Century Communities (CCS US), a top ten national homebuilder and a holding company in our portfolios, focuses on affordable homes. Entry-level buyers represent 80% of their total deliveries. A total of 43% of the homes are under the price of US $250,000, and close to 90% of homes are under the price of US $500,000. In the second quarter of 2021, the company’s home sales revenue increased by 34% to a record $1 billion, and net income increased by 207% to a record $117.9 million. The company has increased their revenue guidance for 2021, and remains confident in its success in the second half of the year.
It’s not just the home buyers, renters also faced a significant amount of financial stress. In the first quarter of 2021, 17% of all renter households in the US reported being behind on rent. This rate is 21% for Hispanic and 29% for Black renters. Several companies in our portfolio contribute to the rental market’s affordability.
Boardwalk Real Estate InvestmentTrust (BEI-U CN) is one of Canada’s largest multi-residential real estate owners and managers. Founded in 1984, the company owns 33,513 residential suits, concentrated in Alberta, Quebec, Saskatchewan, and Ontario. The REIT is committed to providing the best product quality and experience to their clients, at affordable prices. The average rent is approximately 20% of the average renter’s household income. Thanks to its strong brand of service at affordable prices, Boardwalk has been gaining market share, and maintained an above-market-average occupancy rate.
SBB (SBBB SS) is a Swedish-focused, social infrastructure property company. Of its portfolio, 94% is in rented residential and social infrastructure, including education, senior care, healthcare, and government/municipal buildings. The government backs 88% of the rent. As of Q2 2021, the company invests 27% of its social assets in affordable housing. The average rent levels for SBB’s rent-regulated residential portfolio is about 40% below the rent levels of new productions.
Advance Residence (3269 JP) is the largest residential REIT in Japan. They focus on compact apartments, mainly in Tokyo metropolitan areas; 64% of its portfolio are studio and one-bedroom properties, the rents for which are more affordable. Over 50% of the rents were below JPY 100,000 per month (approximately US $911). As a comparison, a typical mid-range, two-bedroom apartment in Tokyo is about US $1903 per month, according to a Deutsche Bank report.
Affordable housing is part of Goal 11 of the Sustainable Development Goals (SDGs). It’s also central to achieving almost all of the SDGs. The demand for affordable housing keeps growing, given the trend of urbanization and population growth. Investment in this theme will not only allow us to ride the secular trend, but also contribute to a more sustainable and inclusive future.