US broad money growth has slowed significantly despite a strong pick-up in bank lending expansion. How has this occurred and does lending strength portend a rebound in money growth?

The broad money aggregate calculated here* rose by 2.6% (5.2% annualised) in the six months to April, down from 4.5% (9.2%) in the prior six months – see chart 1. All the growth over the last six months occurred over November-January: the aggregate has flatlined over the last three months.

Chart 1
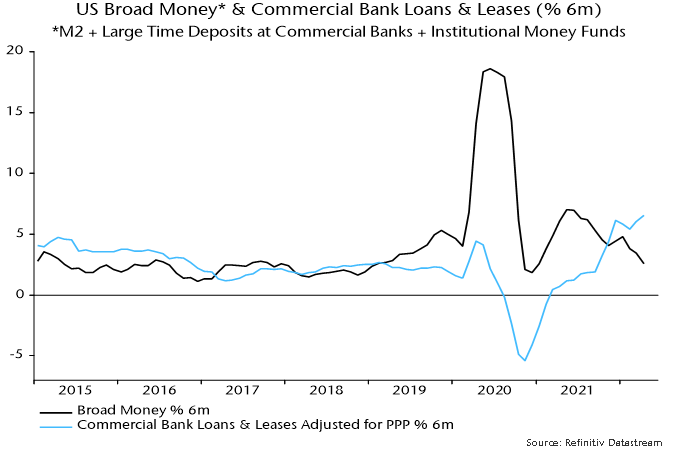
Chart 1 showing US Broad Money* & Commercial Bank Loans & Leases (% 6m) *M2 + Large Time Deposits at Commercial Banks + Institutional Money Funds

The monetary slowdown contrasts with further strength in bank lending. Commercial bank loans and leases, adjusted for Payment Protection Program forgiveness, grew by 6.5% (13.5% annualised) in the six months to April, up from 3.3% (6.6%) in the previous six months.
 
Q. What happened to the additional deposit money created by the expansion of banks’ loan books?

A. It was mostly diverted into the coffers of the US Treasury.

Political wrangling over raising the debt ceiling resulted in the Treasury running down its cash balance at the Fed from over $800 billion in mid-2021 to below $100 billion by December. This monetary injection boosted broad money growth late last year.

Since the ceiling was raised in December, the Treasury has “overfunded” the federal deficit to replenish its cash balance, which currently stands at over $900 billion.

The monetary inflow to the Treasury amounted to 2.7% of broad money in the six months to April – chart 2.

Chart 2
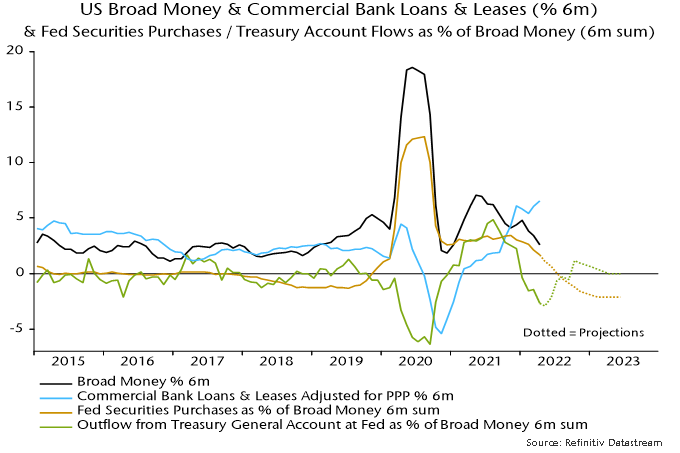
Chart 2 showing US Broad Money & Commercial Bank Loans & Leases (% 6m) & Fed Securities Purchases / Treasury Account Flows as % of Broad Money (6m sum)

The monetary slowdown has also reflected – to a lesser extent – the wind-down of QE: securities purchases by the Fed were 1.7% of broad money in the six months to April, down from 3.4% in the prior six months.

Adding together the effects of QE and changes in the Treasury’s cash balance, there was a net monetary withdrawal of 1.0% of broad money in the six months to April, following an injection of 6.2% in the previous six months. This reversal more than offset the monetary impact of stronger bank lending expansion.

What happens next?

The Treasury’s latest financing projections assume a cash balance of $650 billion at end-September, representing a fall of about $310 billion from its level at end-April.

The Fed, meanwhile, plans to reduce its securities holdings at a monthly pace of $47.5 billion starting in June rising to $95 billion in September. This suggests cumulative QT of about $330 billion over the six months to October.

In combination, QT and changes in the Treasury’s cash balance may, therefore, result in a net monetary withdrawal of only about $20 billion, or 0.1% of broad money, in the six months to October, down from $280 billion or 1.0% in the six months to April.

In terms of the combined influence of the Treasury and Fed, QT effectively started in January and is about to slow temporarily before stepping up later in the year – assuming no further change in the Treasury’s cash balance beyond the expected fall to $650 billion and an ongoing $95 billion per month reduction in the Fed’s securities holdings.

Will a temporarily reduced “public sector” drag allow broad money growth to recover into H2?

The forecast here is that this small positive will be outweighed by a slowdown in bank lending. Corporate credit demand has been boosted by inventory financing but the stockbuilding cycle is now entering a downswing. Higher mortgage rates will cool demand for real estate loans, while banks may rein back on consumer lending as economic prospects deteriorate.

The suggestion of a lending slowdown is supported by the April Fed senior loan officer survey: the aggregate credit demand indicator fell sharply while the net percentage of banks tightening loan standards rose for a third successive quarter – chart 3.

Chart 3
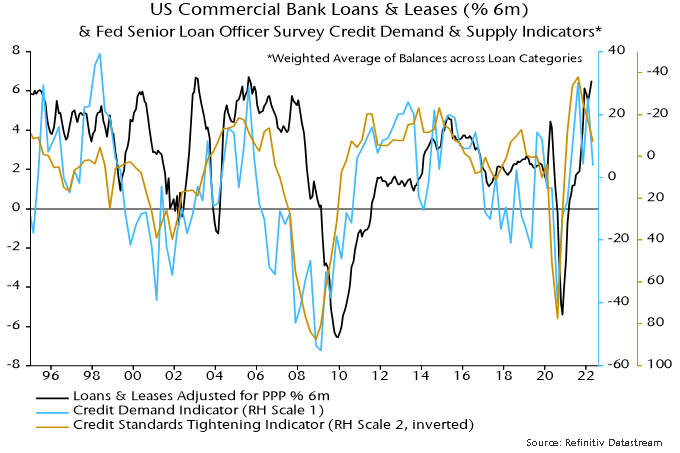
Chart 3 showing US Commercial Bank Loans & Leases (% 6m) & Fed Senior Loan Officer Survey Credit Demand & Supply Indicators* *Weighted Average of Balances across Loan Categories

*”M2+” = M2 + large time deposits at commercial banks + institutional money funds. M2 = currency + demand deposits + other liquid deposits + small time deposits + retail money funds. April estimated.
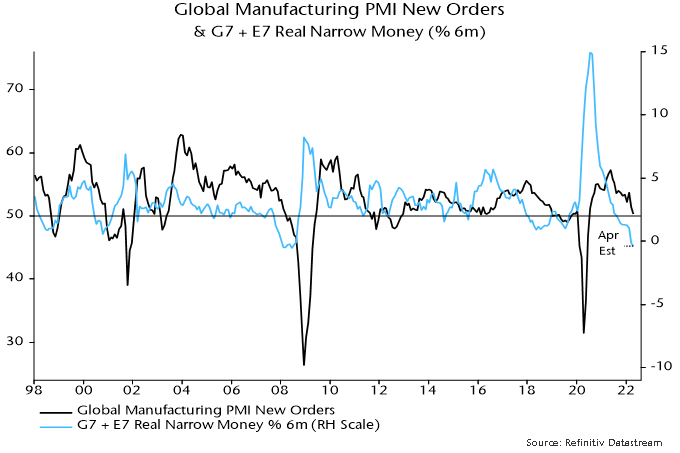
Global* six-month real narrow money momentum turned negative in March and is estimated to have fallen slightly further in April, based on monetary and CPI data covering two-thirds and 90% of the aggregate respectively – see chart 1.

Chart 1

Chart 1 showing Global Manufacturing PMI New Orders & G7 + E7 Real Narrow Money (% 6m)

Current weakness is more pronounced than before the 2001 recession and almost on a par with early 2008 before the escalation of the financial crisis.

The leading relationship with the global manufacturing PMI new orders index suggests a sizeable further decline in the latter with no recovery before Q4. A move below 45 would confirm a recession.

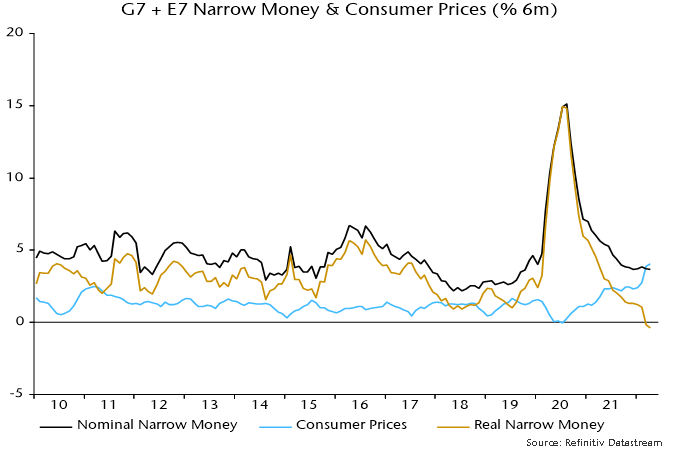
The further fall in real narrow money momentum in April reflected another rise in global six-month CPI inflation, with small CPI slowdowns in the US and Eurozone more than offset by pick-ups in China, Japan (Tokyo data) and the UK (estimated), among others – chart 2.

Chart 2

Chart 2 showing G7 + E7 Narrow Money & Consumer Prices (% 6m)

Six-month nominal narrow money growth has been moving sideways since December. With CPI inflation probably peaking, real money momentum could be bottoming. Any recovery, however, could be limited by a renewed nominal money slowdown as central bank policy tightening proceeds.

*G7 plus E7. E7 defined here as BRIC plus Korea, Mexico and Taiwan.

Close up of unrecognizable male person opening glass door to enter the office. There are people in the background.

Globally, inflation has been a main topic of conversation among investors this year, as well as the Fed’s ability to handle it. In the last few commentaries, we shared our views on the ongoing inflationary pressures and why we think the target of 2% is hardly achievable in the near future. Aside from an unprecedented monetary and fiscal stimulus, spiking energy prices and supply chain disruptions caused by Covid and the war in Ukraine, the main driving forces of current inflation include labour shortages and rising wages.

Indeed, it’s what we are currently experiencing and what some experts in the U.S. are calling the tightest labour market in 70 years. During a panel in Washington hosted by the International Monetary Fund, Fed Chair Jerome Powell described the current state of the U.S. labour market as unsustainably hot.[1] According to the U.S. Labor Department’s Job Openings and Labor Turnover Survey, in March 2022, the number of job openings increased to 11.5 million, from 11.3 million in February. Moreover, there were almost two vacancies for every unemployed person, pointing to an intensifying tightness and further wage pressure.[2] These trends are supported anecdotally while businesses from different sectors report difficulties hiring talent and surging labour costs. When we talk to companies in our emerging markets (EM) universe, we get similar feedback with a slightly varying magnitude in different regions.

As much as one wants to credit purely Covid, the fundamental reasons underlying labour tightness started to surface before the pandemic. Demographics, immigration policy and de-globalization trends have sowed the seeds of the current environment. Covid and the fiscal response to it only added fuel to the fire. The working-age population has slowed in many Organisation for Economic Co-operation and Development (OECD) countries since early 2000.[3] Short-sighted immigration policies in some countries have contributed to that slowdown. A tremendous cost advantage that China enjoyed for years winded down by 2015-2016 due to wage growth and demographics. During the Covid pandemic, many governments found themselves navigating through unchartered territory. Some of those responded with massive fiscal stimulus, which created an unprecedented demand for goods and services, and eventually labour.

There is also a social component to the set-up as the relationship between capital and labour undergoes a fundamental transformation. For example, in the U.S., the population has higher savings, and as a result, this means an improved bargaining power over employers. In many instances, employees can dictate working conditions by pushing for more remote work. Low minimum wages became a major political issue a long time ago. Every year, a larger percentage of people of different ages are reported to be suffering from various mental health issues. Covid was an accelerator of many burnouts that happened in the last two years. And it’s far from being an issue only in developed markets.

For instance, the majority of office workers in India are reportedly suffering from enormous pressure because their colleagues are quitting.[4] The pandemic has radically changed how people work and what the job means to them. As a result, it has contributed to “the Great Resignation”. These factors are reshaping how managers think about their employees, as well as their mental health and wellness. CEOs acknowledge that human capital is the most important asset in any business. Engaging in the current wars for talent, employers have no choice but to pay up. Shorter work weeks could become more common as companies across the world are experimenting with a four-day work week. Additionally, a strong corporate culture and Diversity and Inclusion (D&I) policy have become an important differentiator of successful businesses.

We believe the current labour market issues will persist and become the major drivers of inflation. So, how do we position our EM portfolio from this perspective?

  • We prioritize companies that exercise a superior level of pricing power, have a strong culture and a track record of attracting and retaining talent, have a solid D&I policy, and are relatively less labour intensive. An analysis of social aspects is an integral part of the comprehensive ESG due diligence that we make on every candidate for inclusion in our portfolio.
  • We prefer companies with strong balance sheets and industry-leading margin profiles. As labour shortages limit capacity to grow, companies have to gain efficiencies. An economy with excessive demands creates enough incentives for businesses to invest in productivity improvement. Although we acknowledge a time lag between investments made and productivity improvements, we believe that our holdings should come out as winners in the medium to long term.
  • We look for businesses that can capitalize on this environment, especially those in the automation space.

E Ink Holdings Inc. (8069 TT)

E Ink, based in Taiwan, is the global leader in Electronic Paper Display (EPD) technology. Also known as ePaper, it allows devices to mimic the appearance of ordinary ink on paper and is widely adopted in several end applications, including Electronic Shelf Labels (ESL), eReaders and various IoT solutions.

Unlike LCD and OLED, EPD does not require power to hold an image and consumes energy only when the content is being changed, has no backlight, uses ambient light from the environment and is easy on the eyes. It’s also thinner, flexible and rugged. ESL attaches to the shelves with EPD that show price, sales promotions, and other product information and replaces conventional paper price tags.

Due to wireless data transmission capability, the solution allows for real-time information updates. ESL not only reduces the labour cost associated with a manual replacement of price tags but also minimizes the likelihood of pricing errors and enables stores to quickly improve their efficiency in a highly competitive market. Implementation of in-store technologies and the increasing adoption of smart shelves are driving the continued growth in demand for ESL. The current penetration rate in retail markets is only 4-5%, suggesting plenty of room to grow for E Ink as it commands virtually 100% of the market share in the ESL upstream material supply. The global ESL market is expected to grow at a CAGR of over 18% during 2022-2032 and will exceed US $5 billion by 2032.[5] We like E Ink’s monopoly-like position in a niche market, with strong IP protection, vertical integration, solid R&D capabilities, and placing it in a unique stance to benefit from the rapid industry growth driven by increasing the adoption of ESL, new colour ePaper products, and wider IoT penetration.

Estun Automation Co. Ltd. (002747 CH)

Estun is one of the leading Chinese industrial robot manufacturers, with strong product competitiveness and diversified end-market exposure, including lithium batteries, solar, construction, automotive and consumer electronics. We believe the company is set to benefit from a rising demand for industrial robots in China, given labour tightness and surging wages in that country. After peaking in 2015, the labour force in China has since been on a consistent decline,[6] likely falling victim to the former one-child policy. Moreover, we believe that labour shortages in the manufacturing industry will get only worse due to competition from the new economy companies that lure talent with higher wages and other benefits. Although fighting input cost inflation and supply chain issues in the near term, we believe Estun will be among the winners in the factory automation space, enjoying favourable demographic trends and government policy tailwinds.

Guangzhou KDT Machinery Co. Ltd. (002833 CH)

Based in China, KDT Machinery is a global leader in the production of automated equipment for panel-type furniture, with significant market share growth potential. We like its solid technological know-how, strong cost competitiveness, scale and manufacturing capabilities. As furniture producers globally chase efficiency improvements, automation solutions are expected to enjoy a robust demand in the long term. KDT Machinery not only facilitates the shift from labour to automation in the furniture manufacturing industry, which has been historically high labour intensive, but also contributes to forest protection and CO2 emissions reduction on the back of panel-type furniture replacing solid wood.


[1] https://www.reuters.com/business/finance/feds-powell-half-point-rate-increase-table-may-meeting-2022-04-21/

[2] https://www.bloomberg.com/news/articles/2022-05-03/u-s-job-openings-rose-unexpectedly-to-record-11-5-million

[3] https://data.oecd.org/pop/working-age-population.htm

[4] https://www.dqindia.com/labor-shortage-in-india-is-real-heres-why-people-are-quitting-their-jobs/#:~:text=According%20to%20a%20new%20study,the%20highest%20in%20any%20region

[5] https://www.prnewswire.com/news-releases/electronic-shelf-label-market-to-reach-usd-5-2-bn-by-2032–latest-factmr-study-301490430.html

[6] https://www.china-briefing.com/news/china-labor-market-hiring-costs-job-preferences-talent-acquisition/#:~:text=Distribution%20of%20local%20workforce,quarters%20of%20the%20US%20population

The strategy experienced a perfect storm of negative risk events during the quarter, starting with the unrest in Kazakhstan in January. This was followed closely by the Russian invasion of Ukraine at the end of February.

The unrest in Kazakhstan proved to be short-lived yet significant in terms of the changes it brought to the political landscape. Former President Nazarbayev was removed from the chairmanship of the National Security Council and several of his key allies were detained in what has been described as a targeted purge. Nazarbayev ruled Kazakhstan since its independence in 1991, before handing over the reins to President Tokayev in 2019. Nazarbayev’s “retirement” was largely cosmetic as he continued to rule behind the scenes, cultivating his status as the father of the nation, and enriching his family and friends in the process (even the capital city, Nursultan, was renamed after him in 2019). Galvanised by the protests, President Tokayev and his camp turned on their old boss, swiftly eliminating him from Kazakhstan’s political life and offering up a range of compromises to protesters under a reformed “New Kazakhstan” agenda. Naturally, with these seismic shifts in the political environment, our investment in Kaspi.Kz suffered, losing 57% of its value in the quarter. In fact, Kaspi.Kz accounted for nearly a quarter of the strategy’s returns in the period.

So, what did we do in response to these changes and how do we feel about our investment in Kaspi.Kz today?

As the events unfolded, we took the decision to reduce risk first and sold approximately 30% of the investment at a price of ~$110/share (for context, Kaspi.Kz GDR shares closed March 2022 at $50/share on the London Stock Exchange). It is important to explain why we didn’t sell more of the stock: the Kaspi app is one of the few true “super-apps” globally, whereby each separate business (payments, e-commerce and consumer finance) combine to create a powerful network effect. This has two key benefits. First, that Kaspi are able to earn on multiple parts of the transactions that take place through their ecosystem, thus supporting strong unit economics. Secondly, they are able to attract new customers at very low cost. More services on the platform naturally draws in more customers and drives higher engagement, which makes Kaspi the ideal ecosystem in which to launch new products. Standalone businesses seen in developed markets such as food delivery, ride hailing and travel ticketing can all be incorporated into the Kaspi ecosystem. In fact, after just 18 months of operation, Kaspi have grown their Kaspi Travel business (think Trainline.com) to the largest rail and air ticketing platform in the country, annualizing $330 million in gross bookings as at 1Q22 data.

The combination of these two factors puts Kaspi into the hallowed bucket of companies that offer both a stellar growth and return profile. Kaspi delivered approximately 60% year-on-year earnings growth at an annualized 75% return on equity through 1Q22 – exceptional fundamentals compared to almost any peer globally, and even more so when we remember that they were operating through what was undoubtedly the most challenging period in the company’s history. We were emboldened by the company’s recent announcement of a share buyback of up to $100 million (~1% of market cap) and the reaffirmed guidance. We believe the strategy will be rewarded for being invested in Kaspi.Kz in the long term.

While the strategy has no direct Russian or Ukrainian exposure, a number of countries we are invested in like Egypt, Kenya, Pakistan, and the Philippines are negatively impacted by higher commodity prices. Those countries have a high proportion of energy and food in their Consumer Price Index (CPI) baskets, which results in high inflation and a worsening current account position. Taking that into account, we’ve made some adjustments in the period including exiting from our investment in Edita Food Industries, the leading snacks manufacturer and distributor in Egypt.

Edita is a fantastic business, however we have concluded it will experience lower for longer margins as a result of the pressure on the Egyptian Pound and the rising cost of raw materials. Edita has demonstrated it has pricing power over a few cycles, but we still took the decision to exit, as we think it will take them longer this time to express that pricing power. We are still close to the management team at Edita and believe there will be a time when we are once again investors in the business.

Despite our adjustments, Egypt overall still hurt the strategy and contributed to just over a quarter of the returns in the period. However, we believe that the strategy’s positioning in Egypt is appropriate for this environment and expect significant upside ahead.

We would highlight Fawry as one of the companies we continue to back in Egypt.

Fawry is transforming the payments market in Egypt where over 70% of transactions are still done in cash. In 2021, Fawry served 41 million customers through 269,000 points of sale terminals, and online through their payment gateway, as well as increasingly through the MyFawry app.

Management at Fawry is executing well on its strategy to diversify from traditional payment acceptance (the typical use case is a merchant using a Fawry point of sale terminal to take a cash payment from a customer topping up their SIM card) to higher value financial services including:

  • supplier financing and inventory management (a merchant can pre-order from PepsiCo without using cash or PepsiCo can pay a supplier using Fawry which reduces its cash management costs);
  • agent banking (using an offline network to service third party bank clients);
  • microfinance (disbursing loans to customers using technology and a rich set of proprietary data); and
  • e-commerce (from payment acceptance to buy now pay later).

Fawry’s impressive revenue growth was 34% in 2021. However, one must consider that number in the context of its traditional payments business growing 9% and contributing nearly half the revenue. This is evidence of strong execution from the management team at Fawry and has a positive impact on profit margins. Much like Kaspi, Fawry is a profitable business with EBITDA margins of around 30% that we expect will grow over time as the share of new business grows in the mix.

The strategy experienced strong positive returns from Indonesia and Vietnam in the period. From a top down perspective, both countries are relatively better positioned to weather the current climate; Indonesia is net commodity exporter and has seen improvement in its current account fundamentals, while Vietnam’s foreign direct investment (FDI) based economy means it is generally less susceptible to the ebbs and flows of short- term portfolio flows. Indonesia and Vietnam represent nearly a quarter of the strategy’s capital.

In Indonesia, the strategy is invested in Sido Muncul, an herbal medicine and beverage company that is best known for its flagship brand Tolak Angin. Sido Muncul sources most of its raw materials locally and leverages its superior manufacturing technology to extract market leading yields from those inputs. On top of that natural cost hedge, Sido has significant pricing power in the herbal medicine market given its ~75% market share and unrivalled brand equity (refer to our post on June 4, 2021 to learn more about Sido Muncul).

Sido Muncul is one of the most profitable consumer health companies in the world and is on track for a 15/15 year in 2022: 15% growth in top line and 15% growth in bottom line. Despite the strong share price performance, Sido Muncul’s fundamentals are not adequately reflected in its valuation and as such continues to be the largest investment in the strategy.

Faced with the new variables from the Russian invasion of Ukraine, our team was quick to identify companies that are relatively resilient in this environment. One such company is FPT Software in Vietnam, which we owned in a fairly small size in the past but added to during this period. FPT is part of a broader theme we are expressing in the portfolio around digital transformation and the idea that digital CAPEX spend will continue to grow and become less discretionary as organisations worldwide address the different needs of their customers, employees, suppliers, and regulators. Most of that opportunity today comes from the United States and Western Europe, and that is likely to be the case for some time. As such, the market opportunity for FPT is in fact in those markets, in addition to Japan, where FPT established a strong presence. However, the supply dynamics are very much Vietnamese; FPT counts nearly 16,000 staff, the majority of which are engineers.

Vietnam is an appealing base for IT services exporters due to its large and young population, strong emphasis on STEM in education curriculums and culture. Vietnam’s IT services industry is at a fairly early stage relative to more established Indian, Latin American, and Eastern European competition which translates to a cost advantage that FPT has used to grow and in the process win some major accounts. In fact, nearly half the order book at FPT is from Fortune 500 company clients. FPT’s main competitive advantage on the supply side (i.e.: human capital) comes from the schools and universities it owns and operates in Vietnam, which count for nearly 70,000 students and act as a hiring funnel for aspiring graduates. We see FPT as the ideal play on Vietnam’s human capital development and the global IT CAPEX spend theme. The power of the theme is evident in the numbers: FPT’s global order book was up nearly 20% in 2021, and the quality of the book shows continuous improvement based on contract size (19 contracts above $5 million), scope of work, client profile, and contract duration.

While the performance environment has been challenging in the quarter and the outlook is mired with uncertainties around inflation and interest rates, we think there are a few factors that can help the strategy perform well in 2022:

  • The country mix of the strategy is diverse. While over 80% of the strategy is invested in Asia and Africa, no one country exceeds 20%.
  • As highlighted above, the country mix means factor sensitivities to rates and commodities is somewhat managed. The strategy is, on net, exposed to commodity importers but still benefits from owning businesses in countries with a strong agricultural economy (Kenya and Morocco for example) and countries that have healthy balance of payments (Indonesia on a cyclical basis, Vietnam and Morocco on a more structural basis).
  • Within those countries, the sector mix is deliberately designed to focus on long term themes around the digital economy, financial inclusion, consumer health, and retail. These themes are driven by the formalisation of the economies we invest in and are underpinned by changes in demographics, consumer behaviour, improved regulations, entrepreneurship, and technological advancements.
  • Within those sectors, we own companies that are financially under-levered, have a healthy degree of pricing power and cost variability, and are either owner-operated or multinational-majority owned/operated.
  • The portfolio’s valuation today is attractive. This presents significant return potential for long term investors

The team is committed to our collective goal of delivering differentiated and strong returns to our partners. We have confidence in our investment process and our culture, and believe that will lead to positive long term outcomes for our partners and for us at Vergent.

Vergent Asset Management LLP


DISCLOSURES

  1. Unless otherwise stated, all data is at March 31, 2022 and stated in US dollars (US$). Source: Connor, Clark & Lunn Financial Group, Thomson Reuters Datastream.
  2. Performance history for the Vergent Emerging Opportunities Strategy is that of the Vergent Emerging Opportunities Composite. The Composite has an inception and creation date of August 2018.
  3. Net performance figures are stated after management fees, estimated performance fees, trading expenses and before operating expenses. Operating expenses include items such as custodial fees for pooled vehicles and would also include charges for valuation, audit, tax and legal expenses. Such additional operating expenses would reduce the actual returns experienced by investors. Past performance of the strategy is no guarantee of future performance; Future returns are not guaranteed and a loss of capital may occur. For illustrative purposes, performance fee of 20% on added value over the hurdle rate of 6% plus the management fee of 1.25% have been assumed. Actual management fees charged to a particular account may vary.
  4. There is no benchmark for the Vergent Emerging Opportunities Strategy because it has an absolute return objective
  5. Standard Deviation measures the dispersion of monthly returns since the inception of the strategy.

Benchmarks and financial indices are shown for illustrative purposes only, are not available for direct investment, are unmanaged, assume reinvestment of income, do not reflect the impact of any management or incentive fees and have limitations when used for comparison or other purposes because they may have different volatility or other material characteristics (such as number and types of instruments) than the Strategy. The Strategy’s investments are not restricted to the instruments comprising any one index and do not in all cases correspond to the investments reflected in such indices.

These materials (“Presentation”) are furnished by Vergent Asset Management (“Vergent”) on a confidential basis for informational and illustration purposes only. This Presentation is intended for the use of the recipient only and may not be reproduced or distributed to any other person, in whole or in part, without the prior written consent of Vergent. Certain information contained in this Presentation is based on information obtained from third-party sources that Vergent considers to be reliable. However, Vergent makes no representation as to, and accepts no responsibility for, the accuracy, fairness or completeness of the information contained herein. The information is as of the date indicated and reflects present intention only. This information may be subject to change at any time, and Vergent is under no obligation to provide you with any updates or amendments to this Presentation. This Presentation is not an offer to buy or sell, nor a solicitation of an offer to buy or sell any security or other financial instrument advised by Vergent. This Presentation does not contain certain material information about the strategy, including important risk disclosures. An investment in the strategy is not suitable for all investors, and before making an investment in the strategy, you should consult with your professional advisor(s) to determine whether an investment in the strategy is suitable for you in light of your investment objectives and financial situation. Vergent does not purport to be an advisor as to legal, taxation, accounting, financial or regulatory matters in any jurisdiction, and the recipient should independently evaluate and judge the matters referred to in this Presentation. Vergent Asset Management LLP is registered in England and Wales with its registered office address at 8th Floor, 1 Knightsbridge Green, London SW1X 7QA, United Kingdom (Companies House number OC418829) and is authorized and is an Exempt Reporting Adviser in the USA. It is regulated by the Financial Conduct Authority (FRN: 791909).

THIRD-PARTY DATA PROVIDERS

This report may contain information obtained from third parties including: Merrill Lynch, Pierce, Fenner & Smith Incorporated (BofAML), S&P Global Ratings, and MSCI. Source: Merrill Lynch, Pierce, Fenner & Smith Incorporated (BofAML), used with permission. BofAML permits use of the BofAML indices related data on an “As Is” basis, makes no warranties regarding same, does not guarantee the suitability, quality, accuracy, timeliness, and/or completeness of the BofAML indices or any data included in, related to, or derived therefrom, assumes no liability in connection with the use of the foregoing, and does not sponsor, endorse, or recommend CC&L Canada, or any of its products. This may contain information obtained from third parties, including ratings from credit ratings agencies such as S&P Global Ratings. Reproduction and distribution of third party content in any form is prohibited except with the prior written permission of the related third party. Third party content providers do not guarantee the accuracy, completeness, timeliness or availability of any information, including ratings, and are not responsible for any errors or omissions (negligent or otherwise), regardless of the cause, or for the results obtained from the use of such content. THIRD PARTY CONTENT PROVIDERS GIVE NO EXPRESS OR IMPLIED WARRANTIES, INCLUDING, BUT NOT LIMITED TO, ANY WARRANTIES OF MERCHANTABILITY OR FITNESS FOR A PARTICULAR PURPOSE OR USE. THIRD PARTY CONTENT PROVIDERS SHALL NOT BE LIABLE FOR ANY DIRECT, INDIRECT, INCIDENTAL, EXEMPLARY, COMPENSATORY, PUNITIVE, SPECIAL OR CONSEQUENTIAL DAMAGES, COSTS, EXPENSES, LEGAL FEES, OR LOSSES (INCLUDING LOST INCOME OR PROFITS AND OPPORTUNITY COSTS OR LOSSES CAUSED BY NEGLIGENCE) IN CONNECTION WITH ANY USE OF THEIR CONTENT, INCLUDING RATINGS. Credit ratings are statements of opinions and are not statements of fact or recommendations to purchase, hold or sell securities. They do not address the suitability of securities or the suitability of securities for investment purposes, and should not be relied on as investment advice.

Source: MSCI. The MSCI information may only be used for your internal use, may not be reproduced or re-disseminated in any form and may not be used as a basis for or a component of any financial instruments or products or indices. MSCI makes no express or implied warranties or implied warranties or representations and shall have no liability whatsoever with respect to any MSCI data obtained herein. This report is not approved, reviewed or produced by MSCI.

Aerial view of Tokyo cityscape with Fuji mountain in Japan.

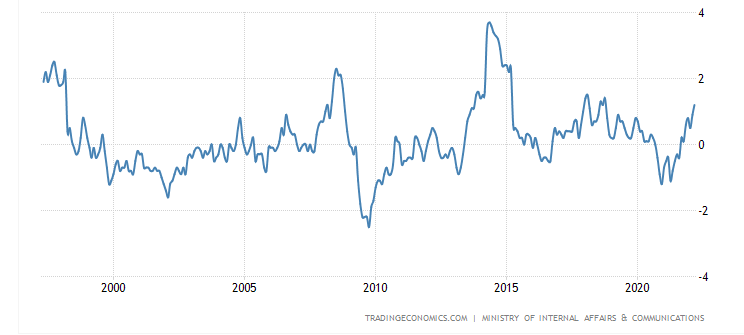
When most countries are wrestling with rising inflation, Japan is the outlier.

In March 2022, Japan’s consumer price index (CPI) growth was only 1.2% year-over-year, versus 8.5% in the United States (U.S.). Japan’s CPI has risen only 5.5% over the past 20 years, compared to 60% in the U.S.

Inflation rate in Japan (%)[1]

This chart highlights inflation rates in Japan over the past 20 years.

In theory, it is due to a long-term demand-deficient feedback loop.

  1. Expectations built up through decades of low inflation or deflation
  2. Weak consumer spending caused by aging population
  3. Firms’ caution on wage and price increases
  4. Stagnant wage growth constrains consumer spending

In reality, for many years, the story goes like this: Anyone under 40 years old in Japan has never really experienced rising inflation. If prices go up, consumers will spend less. Therefore, firms are reluctant to increase prices. To keep costs in control, firms keep wages stable, which does not stimulate consumer demand.

However, since September 2021, the inflation rate has been increasing, from -0.4% in August, 0.2% in September, to 1.2% in March, all due to high commodity prices. On April 26, the Bank of Japan (BOJ) reiterated its commitment to low-interest rates despite rising inflation, saying: “It is most important to support economic recovery by patiently continuing monetary easing.”

At Global Alpha, we are supportive of the BOJ’s policy. Rising inflation in Japan this year is inevitable but desirable. Looked at another way, the present inflationary trend could be an opportunity for Japan to finally escape from deflation.

All our Japanese holdings said they had raised their prices in the past year. According to the Teikoku Databank Ltd survey of 1,855 companies conducted in early April[2], 43.2% of the firms said they raised prices in April or plan to do so by the end of March 2023. When combined with the firms that have already raised prices between October and March, the percentage reaches 64.7% of the total.

The key for Japan to fight deflation is wage increases. According to data by the Organization for Economic Co-operation and Development (OECD), the average annual wage in Japan increased until 1997 to $38,395 and then flattened out. In 2020, the average Japanese workers made $38,515.

In November 2021, Japan’s new Prime Minister, Fumio Kishida, made it clear that raising wages is one of the top priorities for his economic agenda. He urged firms whose earnings have recovered to pre-pandemic levels to increase wages by 3% or more at their labour talks this spring. Prime Minister Kishida also pledged to raise the incomes of welfare workers, such as childcare workers, nurses and caregivers, by 3%, continuously.

Of course, a policy does not lead to easy solutions, considering Japan’s rigid employment culture, the large presence of part-time and contract workers, and a weak yen. The progress is yet to be seen.

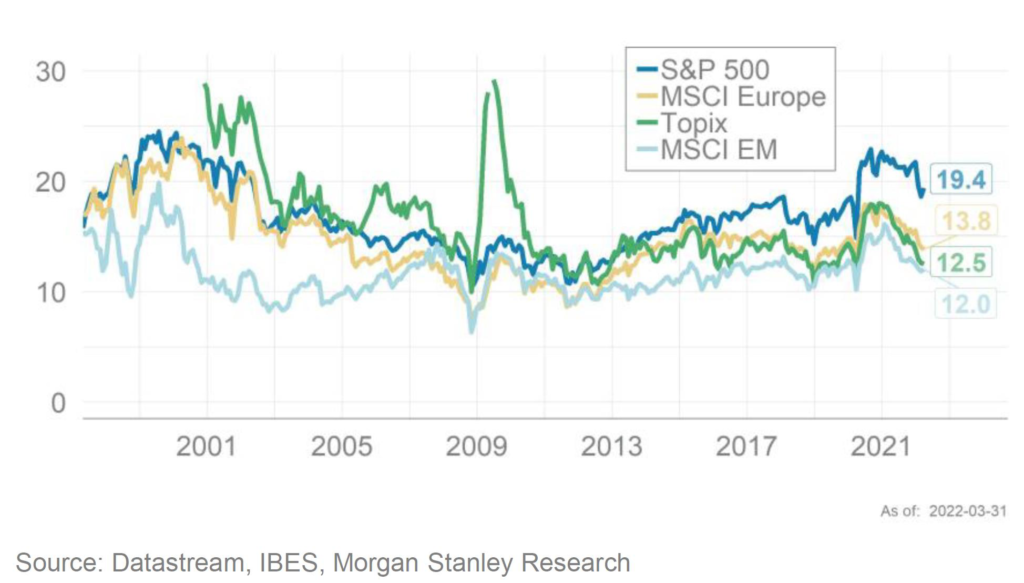
Japan has been a very important market for our investments. Despite low inflation pressure and limited geopolitical risk, Japanese stocks are currently trading at an attractive valuation compared to other markets.

Forward Price/Earnings

This chart depicts that Japanese stocks are currently trading at an attractive valuation compared to other markets. Source: Datastream, IBES, Morgan Stanley Research.

This year, JPY against USD has weakened by over 10%. The 130 milestone was the highest in two decades. We believe the rate should revert to 100 – 110 in the coming years. Meanwhile, a weak yen benefits exporters and encourages inbound travel. As Japan reopens, we foresee “revenge spending” from in-bound travellers. In 2019, almost 32 million foreign tourists spent 4.8 trillion yen.


[1] Japan Inflation Rate – April 2022 Data – 1958-2021 Historical – May Forecast (tradingeconomics.com)

[2] Get ready to pay more: Over 40% of Japanese firms to raise prices within a year: survey – Japan Today

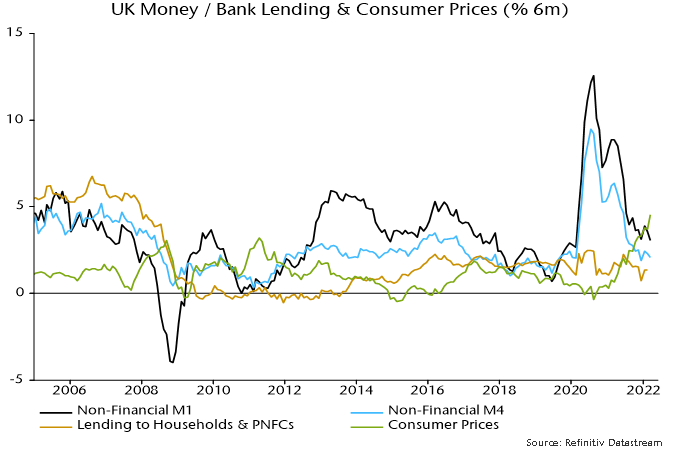
Six-month growth rates of UK narrow and broad money – as measured by non-financial M1 / M4 – fell in March. With six-month consumer price momentum rising further, real rates of change moved deeper into negative territory – see chart 1.

Chart 1

Chart 1 showing UK Money / Bank Lending & Consumer Prices (% 6m)

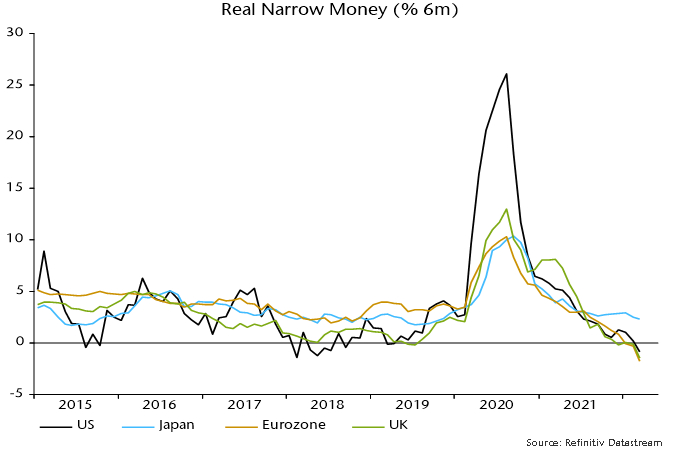
The six-month contraction in real narrow money in March was slightly larger in the Eurozone than the UK – chart 2 – but UK weakness will intensify in April as CPI momentum is boosted further by the rise in the energy price cap . Eurozone six-month CPI momentum, by contrast, eased slightly last month, according to flash data.

Chart 2

Chart 2 showing Real Narrow Money (% 6m)

Expressed at an annualised rate, UK six-month broad money growth was 4.2% in March, close to a 4.5% average over 2015-19 and a pace that, if sustained, would ensure medium-term compliance with the 2% inflation target.

A six-month contraction in real narrow money of the present scale was historically a reliable indicator of future economic weakness but did not always signal a recession.

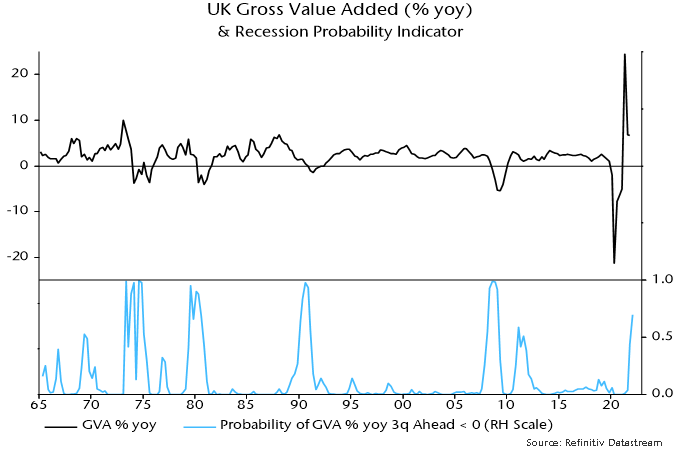
A recession probability model was previously developed here combining monetary information with a range of other financial variables. Based on end-March data, the model estimates the probability of a recession in 2022 at 70% – chart 3.

Chart 3

Chart 3 showing UK Gross Value Added (% yoy) & Recession Probability Indicator

The probability estimate is derived from an equation for the annual change in gross value added (GVA) including the following variables: real narrow money, real broad money, real broad money held by private non-financial corporations, short- and long-term interest rates, short- and long-term credit spreads, real share prices (FTSE local UK), real house prices and the effective exchange rate. Adjustments were made for the impact of strikes and the 1974 three-day week. The equation was estimated on data up to end-2019 to avoid the covid shock / recession.

The model “explains” the annual GVA change three quarters ahead using current and lagged values of the inputs. The recession probability estimate refers to the likelihood, based on the model, of a negative annual GVA change three quarters ahead, i.e. the 70% estimate refers to Q4 2022. (A negative annual change is a stricter requirement than the conventional recession definition of successive quarterly falls in GDP / GVA.)

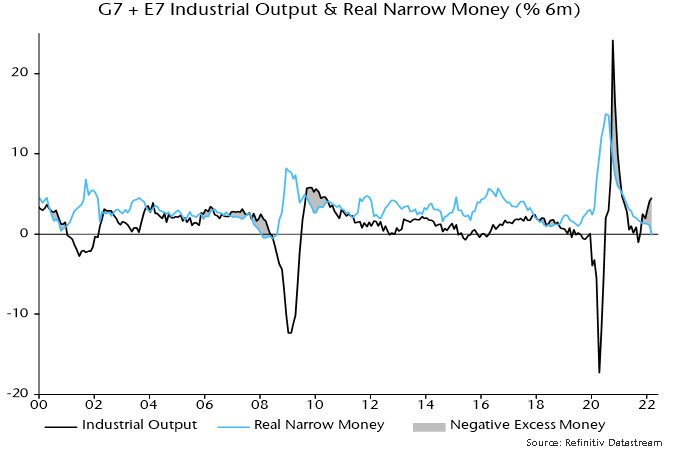
Global six-month real narrow money growth fell to zero in March*, the weakest since the GFC and a level historically consistent with recession – see chart 1. (The current reading matches a low before the 2001 recession.)

Chart 1

Chart 1 showing G7 + E7 Industrial Output & Real Narrow Money (% 6m)

A rebound in six-month industrial output growth, meanwhile, extended in March, reflecting a production catch-up from weakness in H2 2021 due to supply-side constraints. The negative real money / output growth gap, therefore, widened further.

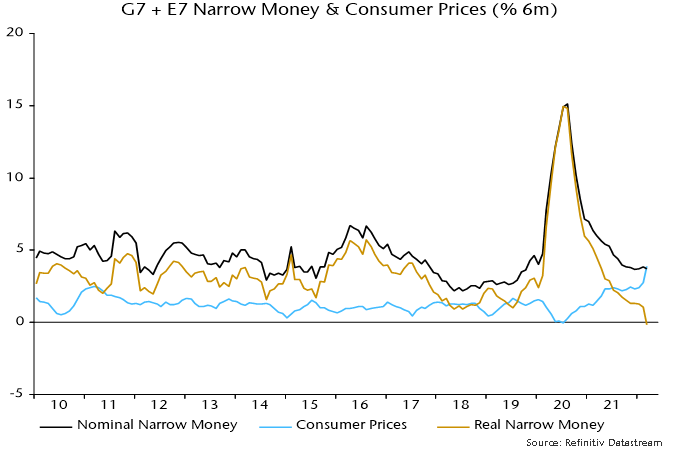
The March fall in real money growth was driven by a further spike higher in six-month consumer price momentum. Nominal money growth was little changed – chart 2.

Chart 2

Chart 2 showing G7 + E7 Narrow Money & Consumer Prices (% 6m)

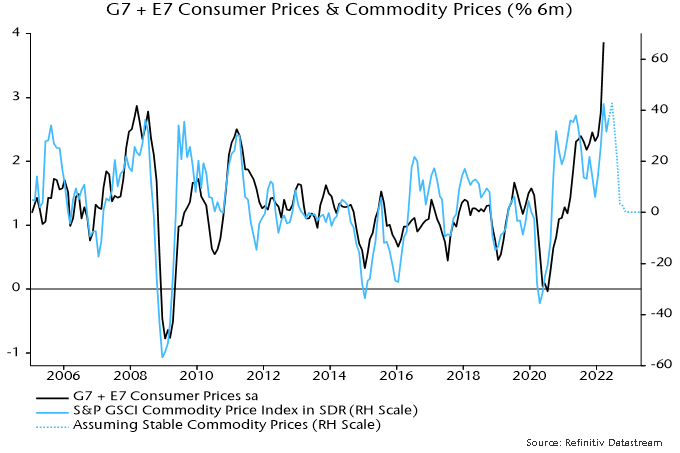
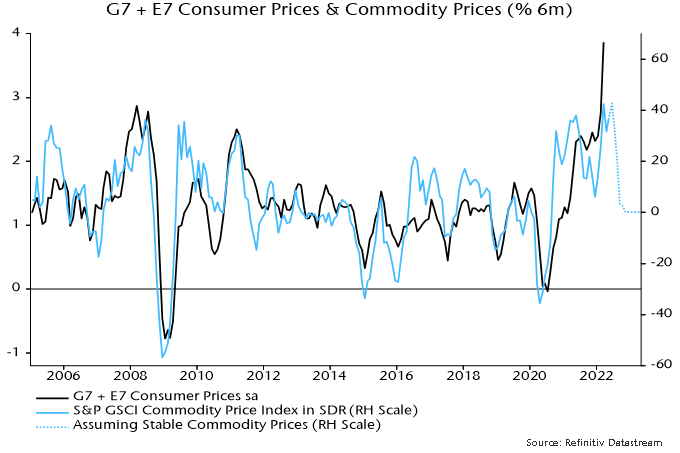
The historical relationship with commodity prices suggests that CPI momentum has overshot and will pull back, possibly sharply – chart 3.

Chart 3

Chart 3 showing G7 + E7 Consumer Prices & Commodity Prices (% 6m)

Six-month industrial output momentum, meanwhile, may move back into contraction because of Chinese covid disruption and weakening trends elsewhere, reflected in soft April global manufacturing PMI results – chart 4.
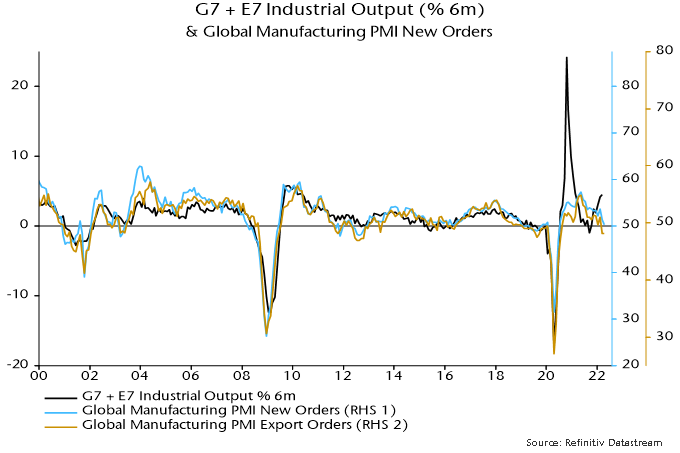
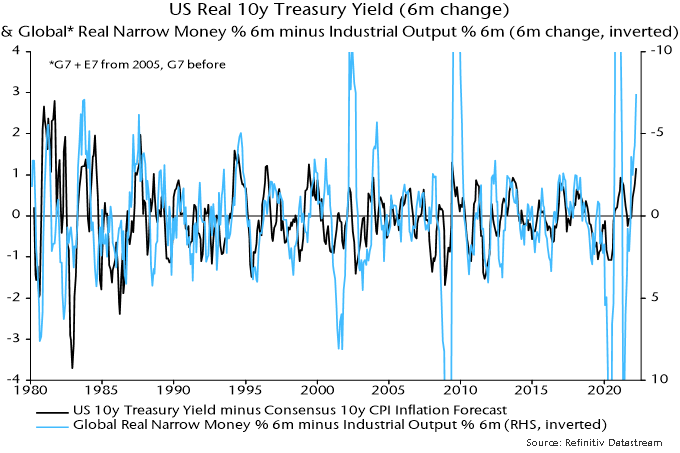
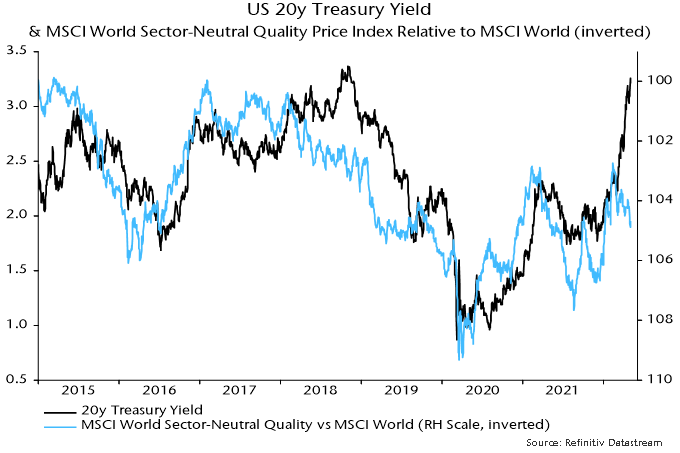
Chart 4

Chart 4 showing G7 + E7 Industrial Output (% 6m) & Global Manufacturing PMI New Orders

Nominal money growth will probably weaken in response to rising rates and as central banks end / reverse QE but falls in CPI and industrial output momentum may dominate, resulting in a narrowing of the negative real money / output growth gap. The gap, indeed, could return to positive territory by mid-year – sooner than previously expected here.

This gap is a proxy measure of global “excess” money, which – on the monetarist view – is a key driver of demand for financial and real assets**.

Historically (i.e. from 1970-2021), global equities underperformed US dollar cash by 6.7% pa on average when the gap was negative, outperforming by 12.2% pa when it was positive. These numbers refer to month-ahead returns based on the most recent reading of the gap.

Equities underperformed cash on average when the gap was negative whether or not it was widening or narrowing. The average loss, indeed, was larger when the gap was narrowing. So the near-term message for equities remains unfavourable.

It is, however, a different story for bonds. Historically, Treasury returns have been sensitive not to the level of the gap but rather its rate of change. That is, a positive change in the gap has been associated, on average, with a fall in Treasury yields (and a negative change with a rise) – chart 5.

Chart 5

Chart 5 showing US Real 10y Treasury Yield (6m change) & Global* Real Narrow Money % 6m minus Industrial Output % 6m (6m change, inverted)

This year’s yield surge is “explained” by the move in the gap into deep negative territory.

Historically, the average fall in yields associated with a positive change in the gap was similar for positive and negative levels of the gap.

The prospective change of direction of the gap, therefore, suggests that the bond bear market is ending.

A reversal in yields would have implications for equity sectors / styles. Quality historically outperformed when excess money was negative but suffered this year from its correlation with yields – the magnitude of the yield rise may have weakened its usual defensive character. (Overweight consensus positioning may also have contributed to underperformance, i.e. quality had become momentum). A yield decline could allow a performance catch-up.

The MSCI World sector-neutral quality index has already reversed more than half of its earlier YTD underperformance despite further bond market weakness, with this recovery another indication that a yield top may be imminent – chart 6.

Chart 6

Chart 6 showing US 20y Treasury Yield & MSCI World Sector-Neutral Quality Price Index Relative to MSCI World (inverted)

*G7 plus E7 aggregate. March estimate based on monetary data for all countries except Canada, Brazil and Korea (extrapolated).
**An additional proxy measure monitored here is the deviation of 12-month real narrow money growth from a long-term moving average. Historically, global equities outperformed cash on average only when both measures were positive. This second measure is expected to remain negative until late 2022, at least.

Blue Globe viewing from space at night with connections between cities. World Map Courtesy of NASA.

Higher input prices are having an adverse impact on household sentiment. European sentiment indicator turned negative in March, while UK consumer confidence fell close to an all-time low in April. Surprisingly, U.S. consumer sentiment unexpectedly rose to a three-month high in early April. Although consumers have accumulated savings through the pandemic, we believe that consumers may prioritize leisure spending over discretionary goods in the months ahead.[1]

Not all product categories performed equally in this context of high inflation. Companies that emerged as winners during the height of the pandemic have fallen back since. The streaming giant Netflix reported a loss of 200,000 members in the first quarter, with a forecasted drop of 2 million this quarter. The company blames the password-sharing business for the loss in subscribers. Netflix, which is already the most expensive streaming platform, has recently increased its pricing in some Latin American countries for sharing accounts between households.[2] With an increased offering of streaming platforms at the same time as consumers are shifting their dollar spending elsewhere, it will be interesting to see how loyal subscribers are.

There are still areas in the economy where demand for goods remains robust. Companies associated with recreational and outdoor activities seem to report strong trading updates. Companies like POOLCORP, Tractor Supply Co and Gardena have benefited during their latest publications compared to last year.[3],[4] In general, we feel like the big ticket items could experience a growing trend going forward. On the other hand, food, health, and some services linked to the post-pandemic reopening might still experience robust growth.

There are some interesting data points that suggest strong spending patterns in service-related categories:

  • OpenTable data suggests that consumer demand for restaurants continued its upward trajectory as of April 19, 2022. The Dining Out index, which tracks restaurant reservation data for approximately 20,000 restaurants across seven countries, shows that so far in 2022, the number of seated diners increased by 24% in the UK, 17% in the U.S. and 45% in Germany. Historically, higher gas prices have negatively impacted restaurant consumption as consumers change their eating habits, but this time around, consumers seems to be holding on to that spending category.
  • Airlines and hotels have also seen an important surge in demand. Delta Air Lines returned to profitability during March, thanks to a passenger revenue that is back to 75% of pre-Covid levels. According to a survey conducted by the World Travel & Tourism Council, travellers are currently planning on spending more on travel leisure than they have in the past five years. [5],[6]

As the economy and consumer behaviours turn more towards services over goods, the exposure to small caps could provide investors with some upside.[7] Small caps, which tend to be more domestic, seem to have a stronger representation of services as opposed to goods. According to the Bank of America, the S&P 500 index derives around half of its earnings from spending on goods, whereas the Russell 2000 index generates only a quarter of its earnings from spending on goods.

Small-cap indices have a better representation of leisure services when comparing it with the S&P500. The weight in the leisure industry services is approximately 1% for the S&P 500 index, as opposed to 3% for the Russell 2000 index.

Some companies we own should benefit from that spending pattern:

Autogrill is the global leader by revenue in the F&B concessions market in airports, motorways, and railway stations. Autogrill and its subsidiary, HMSHost, manage a portfolio of about 300 owned and licensed brands in over 30 countries, including proprietary brands (Spizzico, Puro Gusto, etc.) and third-party franchises with a particular emphasis on global brands (Burger King, Starbucks, etc.).

Meliá is one of the leading European hotel groups; it owns and manages more than 326 hotels and resorts in 33 countries, mainly in America and Europe. Now that the majority of travel restrictions have been lifted, Meliá is seeing an uptick in demand for its leisure hotels. The Easter holiday was strong, and booking trends for the upcoming summer look firm. Although wider concerns around consumer softness are unlikely to completely fade at this stage, investors are likely to focus on mix shifts and changes in demand across product categories. Companies that have continued to invest and managed to enlarge their market positioning should be in a better position to offset the broader market slowdown.


[1] https://www.reuters.com/world/uk/uk-consumer-morale-plunges-near-all-time-low-april-gfk-2022-04-21/

[2] https://www.google.com/amp/s/www.cnbc.com/amp/2022/04/19/netflix-nflx-earnings-q1-2022.html

[3] https://finance.yahoo.com/news/zacks-analyst-blog-highlights-j-113011500.html

[4] https://www.google.com/amp/s/www.marketscreener.com/amp/quote/stock/HUSQVARNA-AB-PUBL-6498674/news/Husqvarna-Group-INTERIM-REPORT-JANUARY-MARCH-2022-Strong-demand-but-sales-affected-by-supply-ch-40125061/

[5] https://www.hospitalitynet.org/news/4110148.html

[6] https://www.barrons.com/articles/-travel-booming-again-hotels-airlines-51649890847

[7] https://financialpost.com/pmn/business-pmn/two-speed-euro-zone-economy-as-services-shine-factories-struggle-pmi

Photo of office building at 121 King Street West in Toronto

Crestpoint Real Estate Investments Ltd. (Crestpoint) today announced the acquisition of 121 King Street, a 540,000 square foot, Class A office building located in Toronto’s financial district, one block from the corner of King and Bay streets. This 25 storey office tower has been recently renovated and is LEED EB Gold, BOMA BEST Gold, Wired Score Platinum, Fitwel Viral Response and Rick Hansen Certified. The building provides direct access to Toronto’s underground PATH system and a variety of retail and entertainment amenities. In addition, the property is well served by a variety of transit options including direct access to the St. Andrew’s Subway station, the King streetcar route and the GO Train at Union Station.

The building is home to a roster of quality tenants including the Federal Government of Canada and National Bank of Canada. Crestpoint acquired a 100% interest in the property on behalf of the Crestpoint Core Plus Real Estate Strategy, its open-end Fund, and another institutional partner. Colliers Capital Markets acted as exclusive buy side advisor to Crestpoint on the deal. Property management services will be provided by JLL.

The closing of the 121 King Street acquisition brings Crestpoint’s total assets under management to over $8 billion and 30 million square feet. This caps off a very active and productive 12 months, which saw the completion of $2 billion of acquisitions involving office, industrial, retail and multi-family opportunities, adding over 5.6 million square feet to its portfolio.

“Over the past year, we have grown the portfolio significantly and added landmark, high quality properties like 121 King Street and the Amazon Distribution Centre in Ottawa,” said Kevin Leon, President and CEO of Crestpoint. “The ability to add a Toronto financial core building connected to the PATH system in such a strong location, with high quality tenancies further elevates the profile of the Crestpoint Core Plus Real Estate Strategy portfolio. With our active management approach we look forward creating a dynamic workplace for the tenants that call 121 King Street home and we are optimistic the long term market for high quality office buildings in downtown Toronto will flourish. The Crestpoint Core Plus Real Estate Strategy continues to offer investors access to a well-diversified, high quality portfolio which continues to perform extremely well.”

About Crestpoint

Crestpoint Real Estate Investments Ltd. is a commercial real estate investment manager dedicated to providing investors with direct access to a diversified portfolio of commercial real estate assets. Crestpoint is part of the Connor, Clark & Lunn Financial Group, a multi-boutique asset management company that provides investment management products and services to institutional and high net-worth clients. With offices across Canada and in Chicago, London, and Gurugram, India, Connor, Clark & Lunn Financial Group and its affiliates are collectively responsible for the management of approximately $104 billion in assets. For more information, please visit: www.crestpoint.ca.

Contact

Elizabeth Steele
Director, Client Relations
Crestpoint Real Estate Investments Ltd.
(416) 304-8743
[email protected]

March CPI numbers globally have mostly surprised on the upside (again) but monetary trends and other considerations continue to suggest significant relief in 2023-24.

G7 annual CPI inflation rose to 6.8%* in March, the fastest since 1982.

post in September 2020 presented a “monetarist” forecast that G7 inflation would average 4-5% pa in 2021-22, i.e. between Q4 2020 and Q4 2022. Money growth in H2 2020 / 2021 was faster than assumed in the post and an outturn in the 5-5.5% range is now likely. (Annual CPI inflation was 4.9% in Q4 2021 and a retreat from the current level is likely over the remainder of 2022, partly reflecting commodity price base effects.)

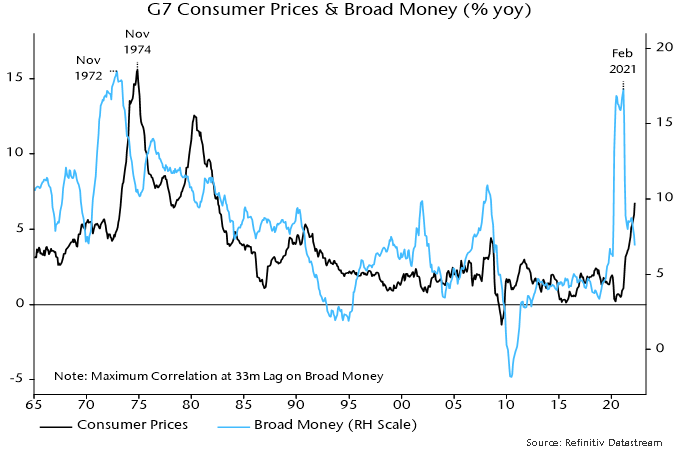
The current inflation surge reflects a money growth surge in 2020 – G7 annual broad money growth* rose from 6.2% in February 2020 to 16.9% by June, eventually peaking at 17.3% in February 2021. This increase has now almost fully reversed, with annual growth estimated to have fallen below 7% in March – see chart 1.

Chart 1

Chart 1 showing G7 Consumer Prices & Broad Money (% yoy)

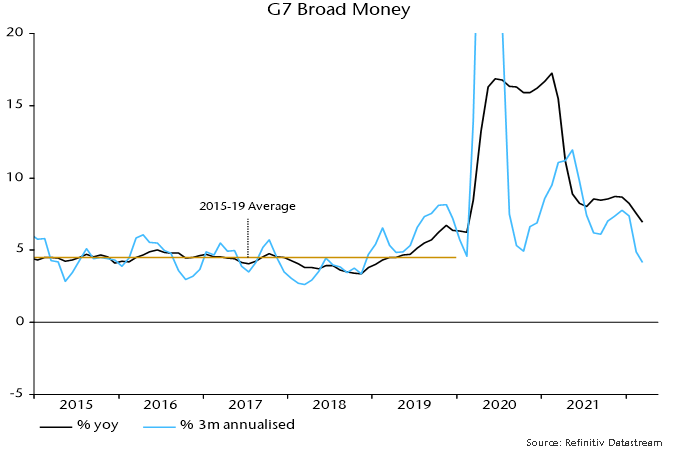
Three-month annualised growth is down to about 4%, close to its average in the five years before the pandemic – chart 2.

Chart 2

Chart 2 showing G7 Broad Money

Broad money growth has slowed by much more than after a comparable surge in the early 1970s. Annual money growth then bottomed above 10% before rebounding strongly, resulting in inflation remaining high and reaching a second peak in 1980.

Sustained broad money expansion of 4% would be consistent with inflation rates returning to target, though possibly not until 2024.

Will money growth stage a 1970s-style rebound? As previously discussed, this was triggered by monetary policy-makers abandoning restraint as economies weakened. Central bankers only recently shifted hawkishly and the hurdle for a policy U-turn is high.

The broad money slowdown partly reflects the winding down of QE, suggesting further weakness if QT plans are implemented. The proposed reduction of $95 billion per month in the Fed’s securities holdings is the equivalent of 0.35% of US broad money. The actual negative impact will be smaller because of various leakages, e.g. Fed disposals are likely to be partly absorbed by an increase in holdings of commercial banks (relative to a no QT scenario), implying a neutral effect on broad money. A reasonable assumption is a “multiplier” of 0.5, i.e. a drag on US broad money of 0.175% per month, or 2.1% over a year. This would cut 1.1 pp from G7 annual broad money growth.
 
With central bank actions on course to exert a negative impact, a rebound in money growth depends on “endogenous” strength in bank lending to the private sector. Monetary economists continue to debate this prospect. “Bulls” note a significant lending pick-up in recent months: G7 annual loan growth, adjusted for US PPP disbursements / forgiveness, was an estimated 6% in March, faster than in any month over 2009-2019. The suspicion here is that strength partly reflects the stockbuilding cycle, which is peaking, while recent yield rises will curb housing credit demand.

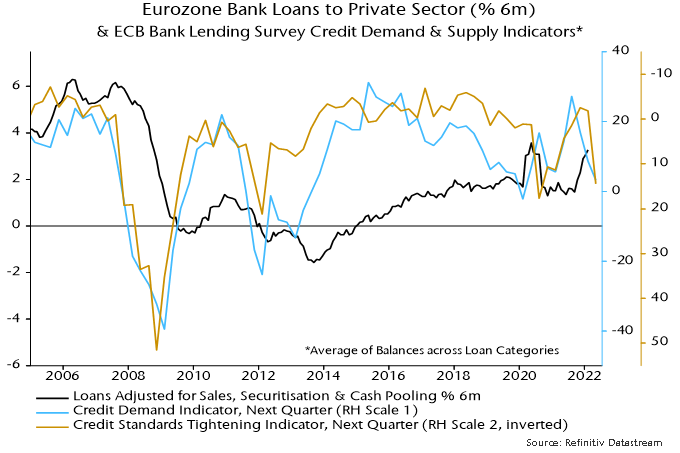
Central bank loan officer surveys are useful for gauging the outlook. The next Fed survey is due in early May but the ECB poll released last week signalled both a tightening of credit standards and weaker demand, suggesting that a recent pick-up in loan growth will reverse – chart 3.

Chart 3

Chart 3 showing Eurozone Bank Loans to Private Sector (% 6m) & ECB Bank Lending Survey Credit Demand & Supply Indicators*

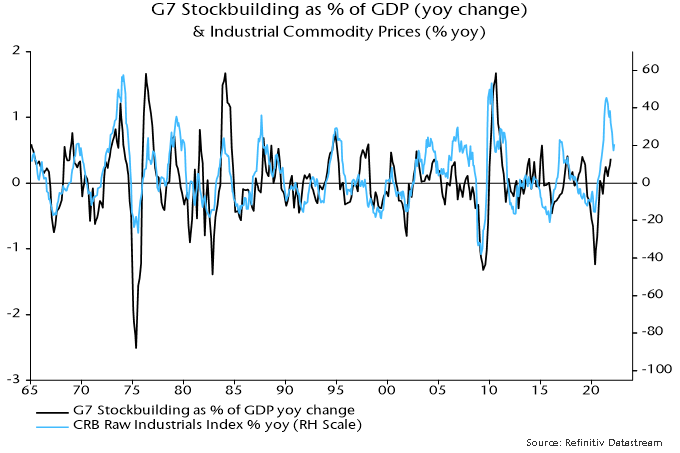
The monetary forecast of 2023-24 inflation relief is supported by the assessment that the stockbuilding cycle is about to enter a 12-18 month downswing. The cycle is correlated with industrial commodity price momentum, which appears to have peaked – chart 4. Supply issues may constrain the downside but the wedge between G7 annual headline and core (i.e. ex. food and energy) inflation – currently 2.5 pp – is likely to narrow significantly in H2 2022 and may turn negative in 2023.

Chart 4

Chart 4 showing G7 Stockbuilding as % of GDP (yoy change) & Industrial Commodity Prices (% yoy)

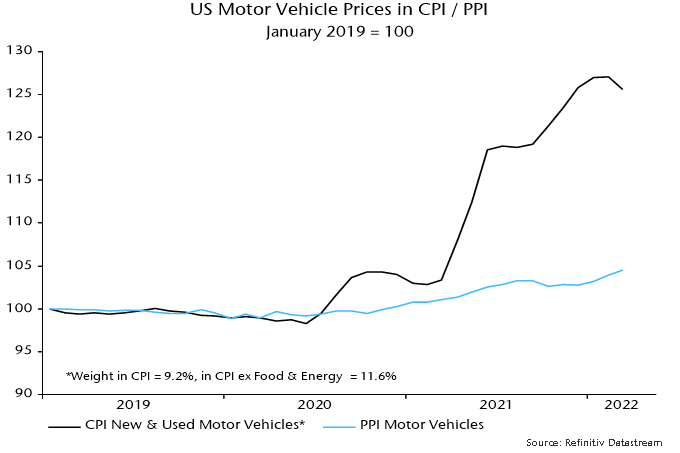
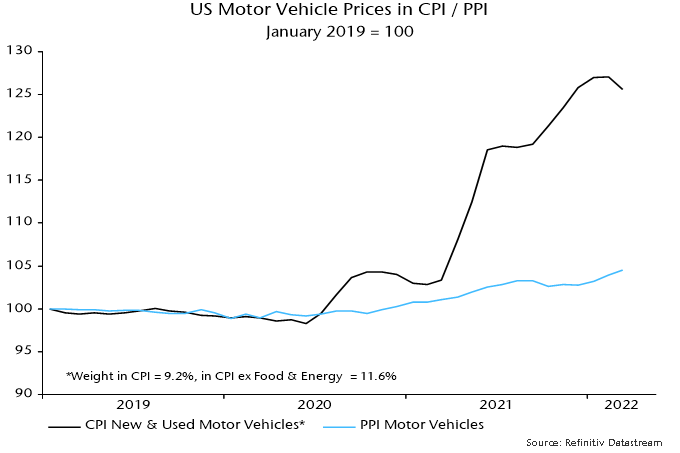
A “technical” factor promising CPI relief is a prospective reconvergence of consumer and producer prices of vehicles when supply constraints eventually ease. In the US, the CPI for motor vehicles would have to fall by 17% to eliminate a post-pandemic divergence with its PPI equivalent – chart 5. A PPI pick-up may bear part of the adjustment but the CPI vehicles index could plausibly decline by 10%, implying a 0.9% drag on headline CPI. A smaller but still meaningful effect is likely elsewhere.

Chart 5

Chart 5 showing US Motor Vehicle Prices in CPI / PPI January 2019 = 100


*Own calculation using GDP weights.