People walking through airport, silhouette (focus on aeroplane)

As the first official day of the summer approaches, it finally feels like the world is getting back to normal. Many countries are now dropping Covid requirements and restrictions, such as testing, masking and quarantining. Tourists are definitely itching to get their holiday plans back on track. In fact, travel is forecasted to reach pre-pandemic levels this year in many regions of the world. In the last two years, countries around the world have lost billions of dollars due to the lack of tourists and many are launching campaigns to attract foreigners back to their favourite holiday destinations.

Earlier this week, the United States (U.S.) announced a five-year strategy to revive national travel and tourism, which is aimed at promoting the U.S. as a premier vacation destination. According to the Bloomberg article, US launches plan to bring back foreign tourists, before the pandemic, travel contributed about $240 billion to the U.S. economy, benefiting companies operating restaurants, hotels, attractions, shopping and more. Despite a lull in international travel, demand in the U.S. has picked up quite rapidly. Over the last five months, travellers have contributed to a trade surplus in the country, signalling an improving appetite for travel. Demand is likely to continue increasing over the summer as international tourists have yet to reach their pre-Covid numbers.

Pent-up demand has been seen across Europe as well. If April travel data is any indication of what’s to come, Europe is in for a busy summer. In April, popular tourist destinations have seen tourist numbers increase anywhere from two to tenfold. Travellers are also spending a lot during their holidays. In France, for instance, foreign travel spending was up 201%, compared to 2021, and up 477%, compared to 2020, as noted in the Bloomberg article, France Foreign Travel Spending Up 201% in April Y/Y. Another Bloomberg article, Number of tourists visiting Spain in April up nearly tenfold YoY, notes that in Spain, the 6.1 million tourists who visited the country in April spent close to what 7.14 million tourists spent back in 2019. It seems that higher prices for hotel rooms and plane tickets are not dissuading tourists from packing their bags, enjoying their holidays and doing some shopping and eating out too.

Japan has taken a more cautionary approach to its reopening plans. As of Friday, June 10th, the country will be accepting visa applications and allowing tourists to come into the country, but only if they are part of a guided tour and continue masking. They have been allowing up to 20,000 arrivals a day since June 1, and this daily cap includes business travellers, foreign students, and Japanese nationals. It will also include the newly allowed tourist arrivals. It will be interesting to see how many tourists will book holidays to Japan on these organized tours. One factor that could boost the attractiveness is the weak Japanese Yen. It is currently trading at a 20-year low, which could incentivize travellers to take advantage of lower than usual prices within the country.

China remains in an uncertain state. The country has been looking to ease border restrictions, especially after the two-month lockdown in Shanghai. While they loosened restrictions, parts of Beijing and Shanghai are already back in lockdown for a mass testing exercise, given the country’s zero Covid policy. We will be keeping a close eye as the situation emerges, although it remains unclear as to how things will progress over the summer.

Despite the Organisation for Economic Co-operation and Development (OECD) lowering its global growth outlook to 3% in 2022, down from the previous 4.5% forecast, summer travel does not seem to be a casualty of the slowdown. We believe that travel-exposed names could really benefit from the summer vacation tailwinds and keep performance on track despite the general economic slowdown.

Samsonite (SMSEY)

Samsonite has been one name that has benefitted from the global travel recovery and could further benefit from the reopening of the Asian regions. Sales for 2022 are on track to reach 80% of pre-Covid levels. The company is a well-established travel and lifestyle bag and luggage company with several brands under its umbrella. Some of these brands include Samsonite, Tumi, American Tourister, Gregory, and Lipault. The company’s exposure to different segments within the travel industry, as well as different geographies, makes it particularly attractive. In terms of business and leisure travel, which has been on the rise, they own Tumi and Samsonite, which cater to the more frequent, long-haul travellers. Gregory and High Sierra on the other hand, cater to the short-distance, outdoor-casual travellers who are looking to buy new gear for their road trips and backpacking adventures. As a result of these trends, sales in North America have been growing at a strong pace this year.

Asia is their second most important region in terms of revenues, accounting for about 34% of sales, just behind the Americas at 40%. However, the company’s sales in the Asian regions have been lagging, given the harsh lockdown measures that were in place over the last few months. Although more recently, news coming from Japan about the loosening of border restrictions for tourists and the slow reopening of several regions in China have given their Asian regional sales a boost. As China opened its inter-province travelling, sales have been improving, and with the broader reopening of the region, we remain confident that the company will be able to deliver strong sales in 2022 despite the slow start to the year.

L’Occitane (LCCTF)

Another one of our holdings that could benefit from tourists opening their wallets abroad is L’Occitane. The company owns many different brands in the cosmetics and beauty industry that appeal to diverse demographics. Their three top markets are China, the U.S., and Japan. Although there are still some uncertainties about the reopening situation in China, we expect the U.S., Japan and the rest of their geographies to make up for the slower growth in China. The company not only operates independently-owned boutiques, but it also has its products in major airports around the world at duty-free shops while also having a strong B2B distribution channel through which the company sells to airlines and hotels. With the global travel rebound, the company is looking to benefit not only from individual consumers’ spending during their trips but also from its B2B segment in which airlines and hotel chains will need to replenish their inventories to welcome travellers.

On the cost side, like most companies, L’Occitane has also been facing some expenditure inflation. However, the company has been able to swiftly manage its increased input costs. The pricing pressure that L’Occitane has been facing mainly stems from logistics and raw material costs. The group raised prices in all geographies during the month of April by 4-5%. This has been its largest price increase to date and the company expects it to be sufficient to maintain margins this year.

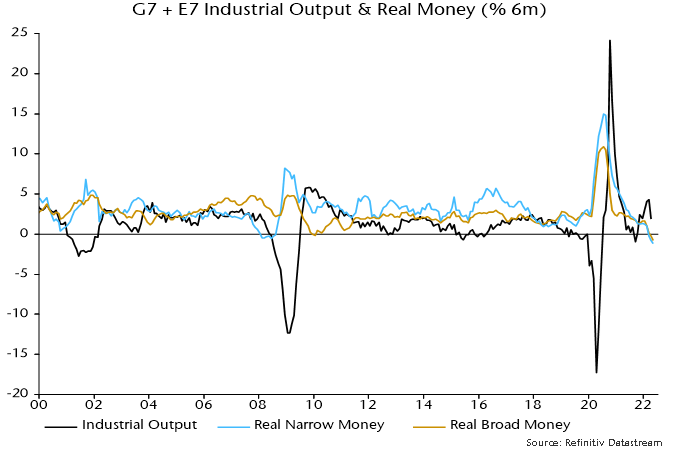
Global six-month real narrow money momentum – a key monetary leading indicator of the economy – is estimated to have moved deeper into negative territory in May, suggesting that a likely recession over the remainder of 2022 will extend into early 2023 – see chart 1.

Chart 1

Chart 1 showing G7 + E7 Industrial Output & Real Money (% 6m)

The May estimate is based on monetary data for countries accounting for a combined 65% weight in the G7 plus E7 aggregate tracked here, along with 93% CPI coverage. Missing numbers are assumed to have maintained stable rates of change.

Real money momentum of an estimated -1.2% (not annualised) compares with lows of 0.4% and -0.5% associated with the 2001 and 2008-09 recessions respectively.

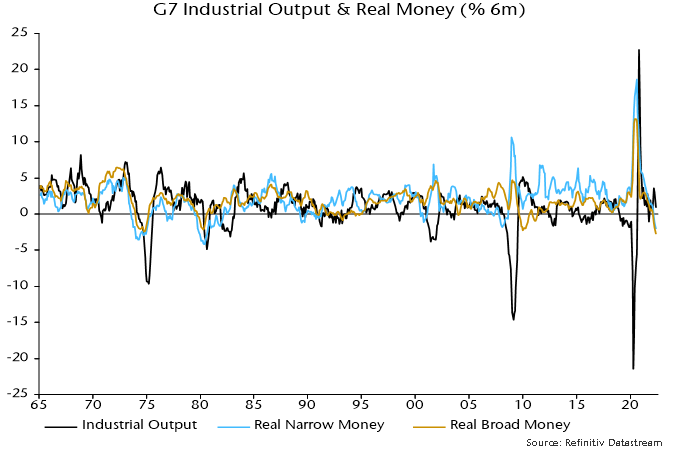
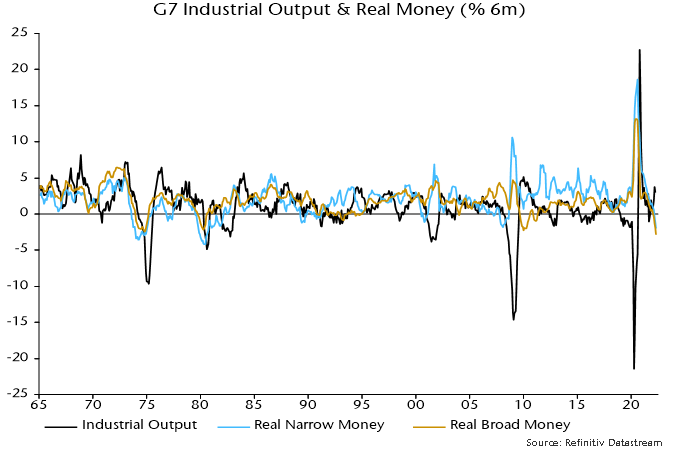
Chart 2 shows a longer-term history using G7-only data. The current rate of contraction of G7 real narrow money was reached only twice over the last 50+ years – in 1973 and 1979 before severe recessions. The rate of contraction of real broad money is faster than during those episodes.

Chart 2

Chart 2 showing G7 Industrial Output & Real Money (% 6m)

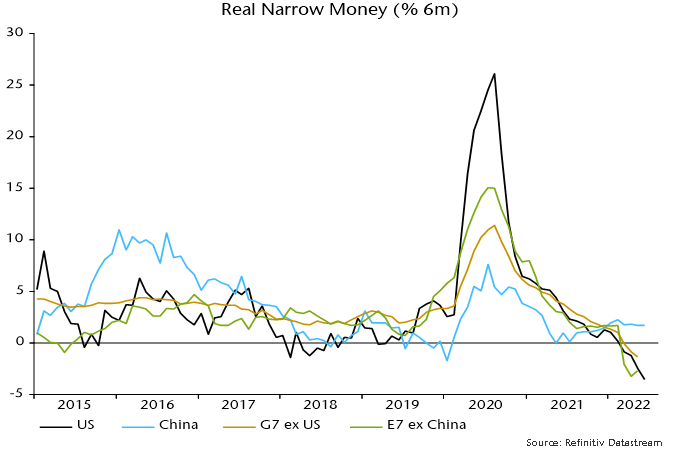
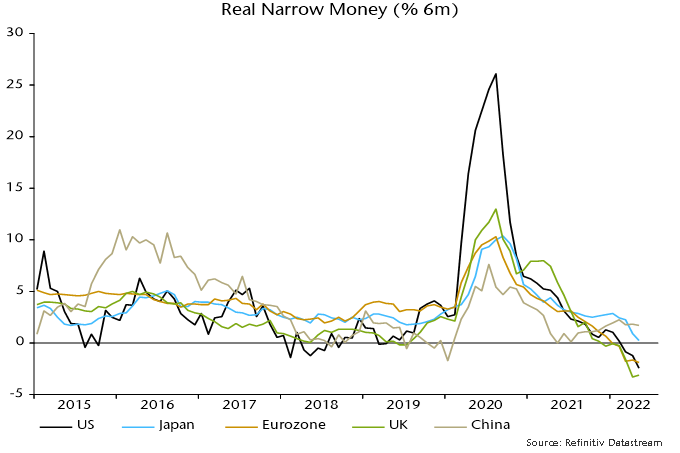
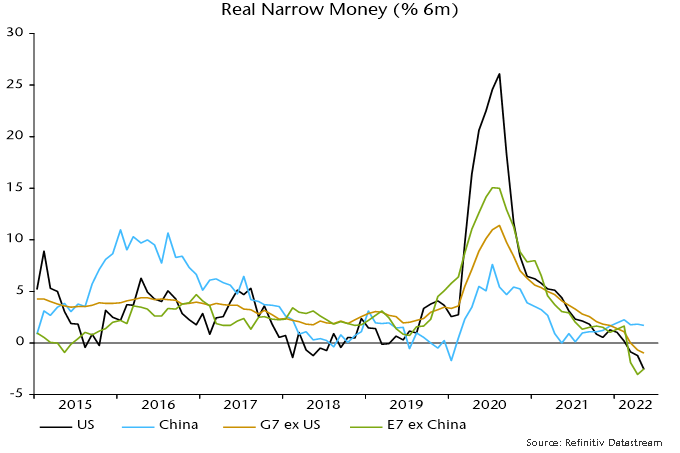
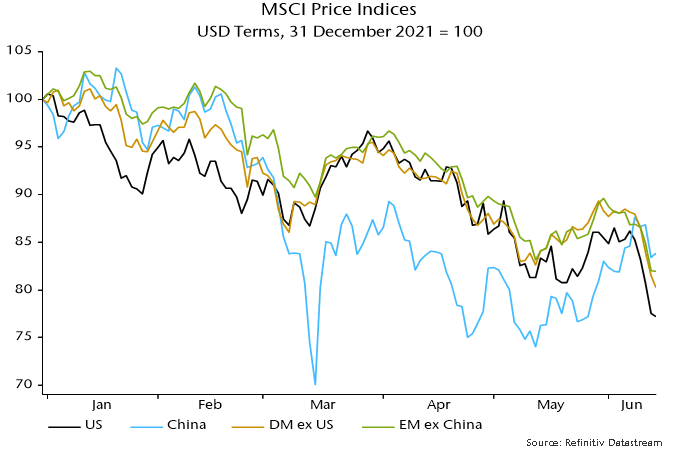
Global real narrow money weakness intensified in May despite stable growth in China, mainly because of faster US contraction – chart 3. China’s positive monetary divergence may explain recent better equity market performance, with the MSCI China index now outperforming global indices year-to-date – chart 4.

Chart 3

Chart 3 showing Real Narrow Money (% 6m)

Chart 4

Chart 4 showing MSCI Price Indices USD Terms, 31 December 2021 = 100

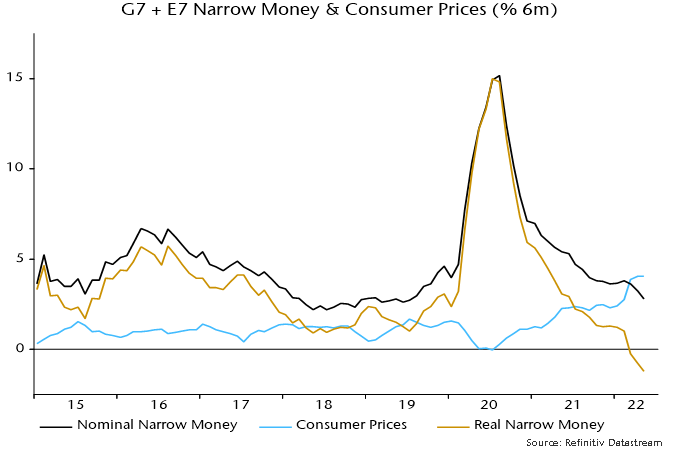
The fall in global six-month real money momentum in May was driven by a further slowdown in nominal money growth, with six-month CPI inflation stabilising after a January-April surge – chart 5.

Chart 5

Chart 5 showing G7 + E7 Narrow Money & Consumer Prices (% 6m)

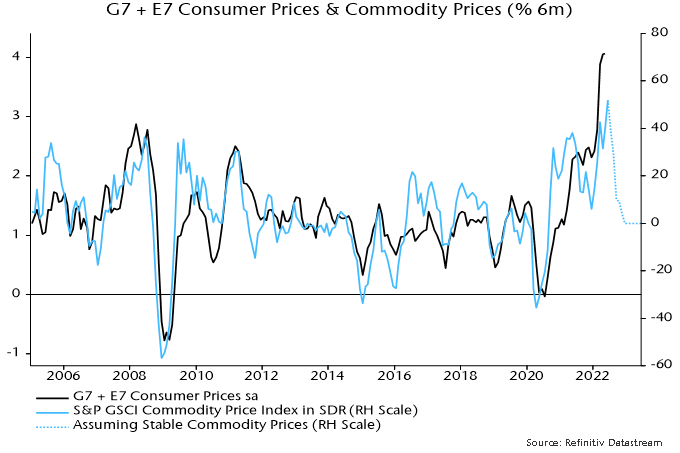
CPI momentum will almost certainly fall back in H2 – the relationship in chart 6 suggests that commodity prices would have to rise by a further 50% by December to prevent a decline.

Chart 6

Chart 6 showing G7 + E7 Consumer Prices & Commodity Prices (% 6m)

A CPI slowdown, however, could be offset by further loss of nominal money momentum – unless rising growth in China (22% weight in the G7 plus E7 aggregate) offsets likely weakness in the US / Europe.

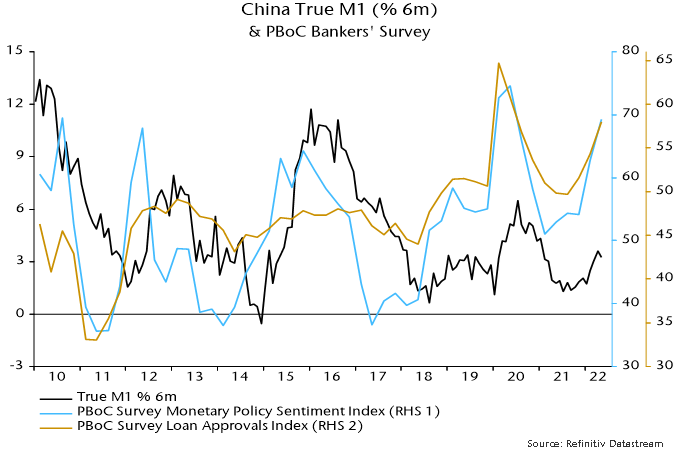
Chinese May money numbers give a moderately positive message for economic prospects, suggesting that recent policy easing is gaining traction. Assuming that pandemic disruption is contained, domestic demand is expected here to recover during H2 2022 and into 2023, partially shielding the economy from export weakness due to G7 recessions.

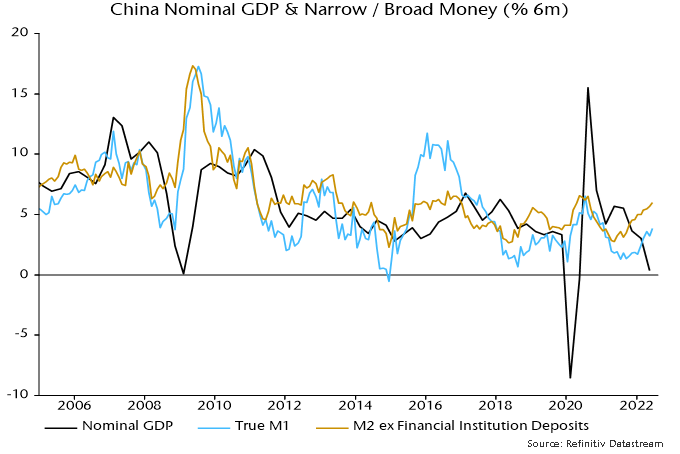
Six-month broad money growth rose further in May and is around levels reached during previous successful monetary / fiscal stimulus campaigns since the GFC – see chart 1.

Chart 1

Chart 1 showing China Nominal GDP & Narrow / Broad Money (% 6m)

Narrow money growth, however, continues to lag*, suggesting that improving monetary conditions will take longer than usual to feed through to the economy.

The likely explanation, of course, is that pandemic disruption is holding back demand both directly and via reduced consumer / business confidence, with restraint reflected in a preference to hold additional money in the form of time / savings deposits (for now) rather than ready-to-spend demand deposits.

Still, narrow money growth has recovered significantly since late 2021.

With Chinese CPI inflation contained within its post-GFC range, real as well as nominal money growth rates have improved – chart 2.

Chart 2

Chart 2 showing China GDP & Real Narrow / Broad Money (% 6m)

As an aside, the relative quiescence of Chinese CPI inflation blows apart US / European central bankers’ claims that current overshoots mainly reflect supply-side shocks. China has suffered the same shocks but pass-through to CPI inflation has been much smaller because of the PBoC’s monetary orthodoxy in 2020-21.

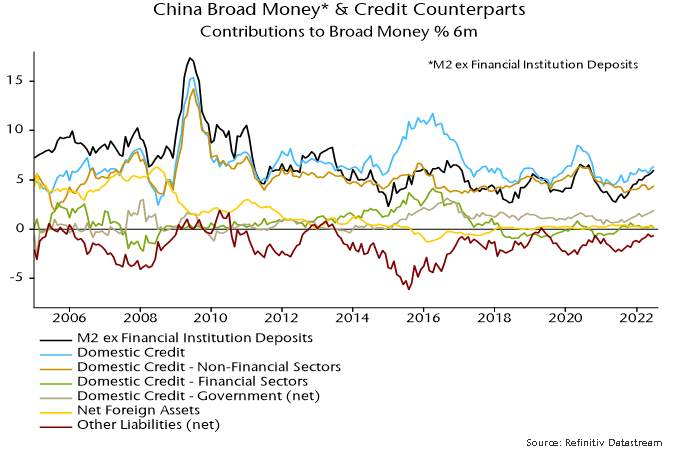
Information through April on the credit counterparts of broad money indicates that the recent growth pick-up has been driven by stronger net lending to government – consistent with expansionary fiscal policy – as well as banks increasing their reliance on monetary funding. Growth of lending to households and firms has moved sideways.

*”Narrow money “= “true” M1 = official M1 + household demand deposits. The May data point is estimated pending release (next week) of a sector breakdown of demand deposits.

A person checking stock market data on a mobile device.

“Intuition is linear; our imaginations are weak. Even the brightest of us only extrapolate from what we know now; for the most part, we’re afraid to really stretch.” – Ray Kurzweil

When it comes to investing, similar to technology, vision and imagination play a big role in achieving outsized outcomes. Ray Kurzweil was referring to the human imagination – or the lack of it – when we extrapolate linearly into a future with infinite possibilities. While human beings sometimes have difficulty grasping exponential change, there are also instances where we blindly extrapolate and exaggerate a recent trend indefinitely into the future. It’s easy to forget sometimes that the more things change, the more they stay the same.

It wasn’t that long ago that we were confined to the four walls of our homes, completely reliant on the internet economy to feed, clothe and entertain us. Much was made of the internet adoption of the future being fast forwarded back into the present. We were quick to pronounce the end of the brick and mortar economy. Turns out we were a bit too premature with this conclusion.

To understand why, we need to take a look at why the digital takeover did not quite live up to its promise. First, the pandemic led to large scale disruptions to a supply chain that is finely tuned to the needs of just-in-time inventory. It is no longer cheap to get your product from its factory in China to a warehouse/store near you. The cost to ship a container from China sky rocketed from a few thousand dollars pre pandemic to close to $15,000 today.

Second, the soaring cost of digital ads means the barriers to entry for a digital only brand/venture to succeed is much higher now. Many brands in the early 2010s were built on the back of cheap digital advertising. The cost of acquiring customers now is much higher and digital ads don’t quite make the impact they used to with their poor targeting and lower click through rates.

For example, the cost to advertise on Facebook has tripled in the last two years. At the same time, Apple’s latest privacy update has forced apps to comply with the Ad Tracking Transparency (ATT) framework, which requires advertisers to seek permission to track user activity. This makes it harder to track ad performance, leading companies to spend more for sub optimal results.

What this means is that a lot of digital-only brands and startups looking for new tricks to achieve growth have settled for an old trick – brick and mortar stores. It helps that the pandemic has led to plenty of empty store fronts to choose from. Landlords are now open to shorter leases and better terms, allowing digital native brands to experiment with a brick and mortar presence.

A classic example of a digital native brand thriving in this new world is Warby Parker. While Warby Parker is not new to physical stores, their big bet on brick and mortar is an admission of the fact that the adoption of online purchase of glasses has not fully lived up to expectations. Currently, their brick and mortar stores are more profitable than their website and the company expects most of the growth in 2022 to be driven by retail stores.

This trend has borne out in the larger economy. In 2021, U.S. brick and mortar sales overtook e-commerce for the first time ever. It remains to be seen if this is a sustainable trend, but clearly, brick and mortar is far from dead. At Global Alpha, we are cognizant of the fact that trends tend to get exaggerated to the extremes. The goal is to be mindful of these extreme swings and to look for mispriced opportunities when they arise.

Clicks Group (CLICKS SJ)

One of the brick and mortar champions within the emerging market universe is the Clicks Group based in South Africa. Clicks operates the largest retail pharmacy chain in South Africa, along with a health and beauty retail business. It also operates a wholesale distribution business and runs the Body Shop and GNC franchises in South Africa.

In a difficult environment marked by Covid and social unrest, Clicks continues to invest in its brick and mortar operations by opening close to 40+ stores every year. In spite of pandemic-led restrictions, its 800 stores have driven both top and bottom line growth.

Clicks interestingly uses the online channel as a more defensive strategy, letting them add and experiment with new categories and private label products. Our conversation with management informed us that South Africans prefer to go to shopping centres where most of the Clicks stores are located rather than shop online. They also value the privacy of shopping in a pharmacy rather than having items delivered home. Clicks illustrates how traditional retail and e-commerce can complement each other to drive sustainable growth. Irrespective of headlines, we continue to keep our ears to the ground to find great businesses.

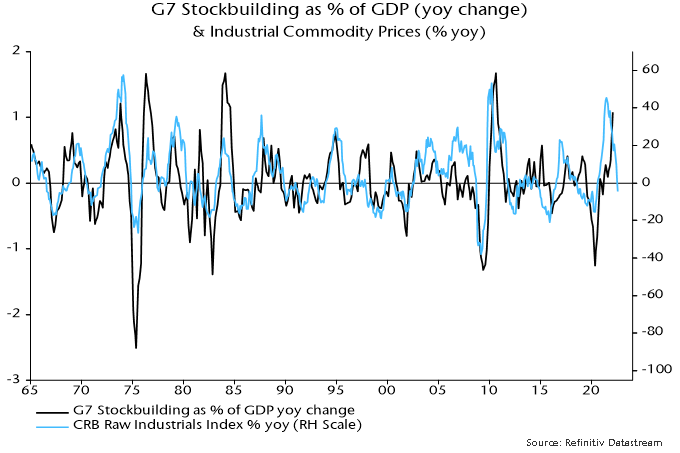
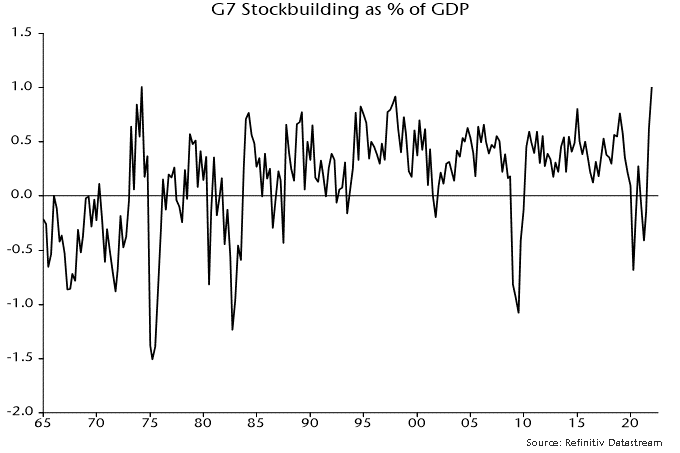
G7 GDP data confirm that stockbuilding gave an unusually large boost to growth in the year to Q1. Stockbuilding is almost certain to fall over coming quarters, implying that the growth impact will turn from positive to (probably large) negative. Prospective weakness in stockbuilding reinforces the recessionary signal from real money contraction.

Japanese and Eurozone GDP details released today showed “surprisingly” large increases in inventories in Q1, mirroring similar surges in the US, UK and Canada. For the G7 group, stockbuilding is estimated here to have reached 1.0% of GDP (real data).

GDP growth is related to the change in stockbuilding. G7 stockbuilding was negative in Q1 2021 – inventories fell by 0.1% of GDP. So stockbuilding as a share of GDP rose by 1.1 percentage points in the year to Q1 2022, i.e. stockbuilding “accounted for” 1.1 pp of GDP growth in the year to Q1 – see chart 1.

Chart 1

Chart 1 showing G7 Stockbuilding as % of GDP (yoy change)

Q: Why is stockbuilding almost certain to fall from its Q1 level?

A: Because its estimated 1.0% share of GDP in Q1 is a record in data extending back to the 1960s, matched only in Q2 1974 (which immediately preceded a severe recession).

Its average share over 1965-2019 was 0.2%. If the actual share were to fall to this level in Q1 2023, the contribution of stockbuilding to annual GDP growth would be -0.8 pp in that quarter, representing a huge -1.9 pp swing from Q1 2022.

The annual change in G7 stockbuilding as a share of GDP is used here to date lows in the stockbuilding cycle. The cycle has averaged 3 1/3 years historically and the last low was in Q2 2020, suggesting another trough in H2 2023.

The extreme Q1 reading is consistent with a cycle peak but there is a chance that the annual change in the stockbuilding share will rise even further in Q2, reflecting a positive base effect – inventories fell by 0.4% of GDP in Q2 2021.

The argument that the stockbuilding cycle is about to become a major drag on global growth does not, it should be emphasised, rely on a forecast that firms will reduce inventories from their current level, only that the rate of accumulation will slow. Stockbuilding is often still positive at cycle lows.

Following such extreme accumulation, however, a liquidation of inventories is certainly possible and would, of course, reinforce recessionary dynamics.

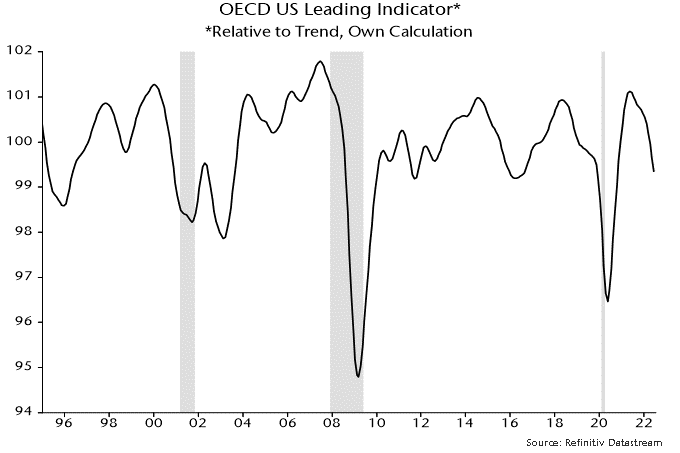
Recent economic data have been interpreted as supporting the view that global growth is showing “resilience” in the face of significant shocks, in turn suggesting scope for central banks to continue to dial up hawkishness.

This reading of the data is disputed here while monetary trends continue to signal a high probability of a recession by end-2022 followed by a sharp inflation drop in 2023-24. Central bankers ratcheting up interest rate expectations are as off-beam now as they were when engaging in outsized stimulus in 2020-21.

Additional April monetary data confirm that the six-month change in global real narrow money moved deeper into negative territory and has now undershot a low reached in June 2008 as the financial crisis and associated recession escalated – see chart 1.

Chart 1

Chart 1 showing G7 + E7 Industrial Output & Real Narrow Money (% 6m)

The comparison with June 2008 is relevant in other respects. The two-year Treasury yield surged from 1.35% to 3.05% between March and June as the oil price spiked above $140 and markets priced in significant Fed tightening. The next move in the Fed funds rate, then 2.0%, was an October cut, by which time the two-year was back below 1.5%.

The fall in global real money momentum in late 2021 / early 2022 reflected rising inflation. Nominal money weakness has been the driver more recently.

With Canada yet to report, three-month growth of G7 broad money is estimated to have fallen to 1.9% annualised in April – chart 2. Annual expansion is likely to have moved down to around 5% in May, close to the pre-pandemic average, based on weekly US data and a sizeable base effect.

Chart 2

Chart 2 showing G7 Broad Money

Annual broad money growth peaked in February 2021, suggesting that a fall in CPI inflation will start in 2023-24 rather than later this year, assuming a typical lead time of about two years. An “optimistic” view is that the transmission mechanism has been accelerated by supply-side shocks, implying an earlier but higher inflation peak and a faster subsequent slowdown.

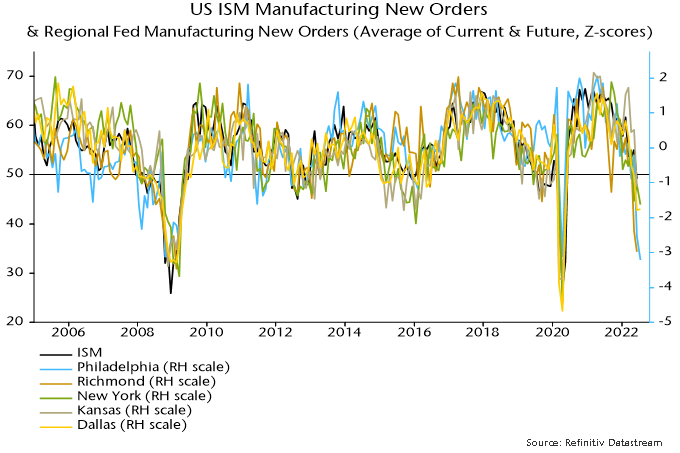
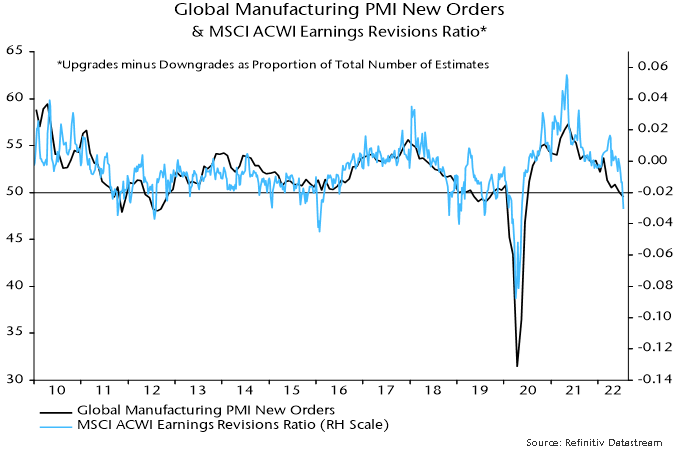
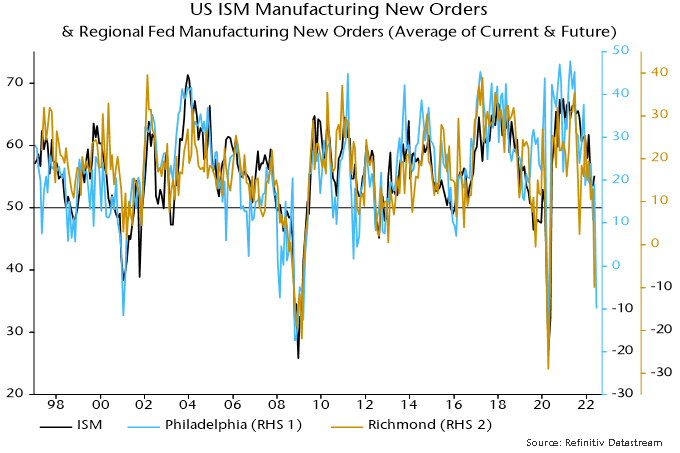
Recent news giving apparent support to the view that the global economy is displaying “resilience” includes May rises in new orders indices in the global PMI and US ISM manufacturing surveys. Both indices, however, are well down on three months earlier and the May recoveries were associated with further strength in stockbuilding – chart 3. A moderation of inventory accumulation – and likely eventual liquidation – will act as a major and sustained drag on order flow.

Chart 3

Chart 3 showing Global Manufacturing PMI Inventories Average of Finished Goods Inventories & Stocks of Purchases

US payrolls growth beat expectations in May but alternative ADP and household survey employment measures have slowed sharply over the latest three months – chart 4. Meanwhile, weaker labour market responses in the Conference Board consumer survey and a rise in involuntary part-time working suggest that a sideways move in the unemployment rate in May is the precursor to an upturn – chart 5.

Chart 4

Chart 4 showing US Private Jobs Measures (% 3m annualised)

Chart 5

Chart 5 showing US Unemployment Rate & Consumer Survey Labour Market Indicator / Involuntary Part-time Working
Elevated view of Makati, the business district of Metro Manila.

Since 2010, the Philippines has been growing at a rate of 6%, with controlled inflation (except in 2018 due to rice inventories) and reasonable macro indicators. From 2010 to 2016, President Benigno Aquino implemented some pro-market reforms, increasing the space for growth and spending, reducing corruption, and implying an increase in investment and foreign flows. In the period of the Aquino presidency, the most pro-market policies caused FDI inflows in most years (which had only been seen in the period between 2003 and 2007). The Philippines received its investment-grade in 2012, after which the country continued growing nicely, and with good macro indicators, it was mostly market friendly.
In 2016, Rodrigo Duterte assumed the presidency of the country. Although the Build! Build! Build! infrastructure program was an interesting initiative, there was no significant progress, and the handling of the contracts led to doubts among investors. The Public-Private Partnerships (PPP) investment initiatives created by President Aquino were better accepted by the foreign investor community.

The Duterte government was faced with a strong fight against drugs, problems surrounding international relations (especially with the U.S. in its first half), and faced increasing internal protests. All of the above caused foreign investors to divest from local stocks almost every year. According to the CLSA report, BBM is it, more than USD$5 billion was divested from the Philippines market in 2016-2021, causing foreign ownership of the index to drop from around 30% in 2012 to nearly 20% currently.

Although the macro indicators continued to show good dynamism and controlled inflation, there was a certain crisis of confidence in the Duterte administration, along with a series of track records of policies missteps, troublesome relationships with some western countries, and better opportunities in other markets. The Philippines has essentially been forgotten by the foreign investment community for the last six years.

In the recent presidential election, Ferdinand “Bongbong” Marcos was elected. There is a logical execution risk for his new term. Nevertheless, its comparable base is very low. With foreign investments mostly out of the country, there is plenty of room to improve international relations. However, the huge infrastructure gap in relation to other countries remains. Bongbong Marcos wants to continue with the Build! Build! Build! Program, but may frame it differently.

Although it is too early to say, he doesn’t seem as conflictive as the former president was with some local groups. Duterte had some conflicts with leading economic groups, one example being the shutdown of ABS-CBN, the country’s leading broadcaster. In short, Bongbong Marcos has to avoid internal conflict and taking sides in international relations (as Duterte did with China). In that scenario, considering its vast growth potential (the Philippines should continue growing around by 6% in the coming years), foreign investors should regain some confidence in the country.

Of course, the transition is not easy. Investors will be keen to see some initiatives that will lower the deficit/GDP ratio from levels of -8.6% in 2021 to at least normal levels of -3% during his mandate. There are also ongoing discussions for a tax reform. Although there is no official proposal yet, the reform is not intended to harm a particular sector or corporations. It is more of a blended tax increase among different products (for example, liquor, cigarettes, removal of some exemptions in VAT). If done properly, the probable tax increases should be seen positively by investors and present organized measures to reduce the current deficit.

All in all, if the country is able to promote more FDI, it will benefit its deficit and debt ratios. Likewise, one of the best ways to grow the economy without compromising debt indicators is with more foreign and domestic investments. This could be a catalyst to regain a better sentiment towards the country. Investors need a clear roadmap. In 2017, we saw a rally in the stock market when the Duterte administration was elaborating a tax reform in order to reduce the deficit.

Together with a roadmap to reduce the deficit and create a sound monetary policy, investors are expecting Macros to appoint credible cabinet members. The President recently announced that Central Bank Governor Benjamin E. Diokno would serve as the new finance minister, which is good news for the market. Moreover, he is expected to make sound economic pronouncements and pursue pro-business policies. In his campaign, he mentioned several market-friendly initiatives, such as:

  • Continue the Build-Build-Build initiative of the former administration and increase digital infrastructure.
  • Increase attention on the agricultural sector (although many former politicians have mentioned the same thing and few improvements have been made).
  • Increase investments in healthcare (sound opportunity as consumption).
  • Increase funding for tourism (could be a relevant catalyst for the mid-term, as explained before).

One of the themes that we often take into account in emerging markets is the consumption of the emerging middle class. We feel that in a mid-long term scenario, opportunities are massively driven by the increasing purchasing power of the emerging middle class, as well as people climbing the corporate ladder, therefore accessing better opportunities and quality of life.

While it will take time, the transformation of the Philippines is possible; take Chile for example. In the 2000s, the country had a GDP/capita of close to 11,000 USD, and in 2019, it was close to 25,000 USD. Indonesia is another example, with a population of nearly 250 million, the country enjoys great opportunities to increase the purchasing power of the emerging middle class, fostering its current 4,500 GDP/Capita. In order to be able to upgrade and increase consumption patterns, a stable and open macroeconomic scenario, certainty and foreign investments are required. Indonesia has undergone several transformations aimed at achieving better investor confidence.

As for the Philippines, hopefully this new government will be able to boost investors’ confidence. We feel the country should follow a similar pattern as Indonesia, with some lag. The mining sector is very relevant in Indonesia, but has been quiet in the Philippines. Although the country has one of the highest worldwide resources in gold and copper, a lack of investments and politics have clouded its development. Last year, the Duterte administration lifted a nine-year ban on new mines, which is likely to slightly improve the scenario, but foreign capital is needed. The country can enjoy relevant opportunities in the mining sector if things are managed correctly, following a similar path that Indonesia is currently developing.

In terms of drivers of growth, the Philippines is one of the world’s biggest suppliers of labour. Remittances are around USD$35 billion per year, accounting for close to 8% of the GDP, as per the CLSA report, Back on the Road. Revenues have been growing at a rate of 4-5% per year, and they are expected to continue doing so. Moreover, the country enjoys the world’s second position in business process outsourcing (after India), accounting for USD$25-30 billion per year, around 7% of the GDP, growing at similar levels to remittances.

Tourism is another source of revenue the country must increase. Rich in natural beauty, tourism in the Philippines represents only 2-3% of GDP, a far cry from what tourism represents for nearby Thailand and Malaysia. If things are done well, the country could be another reopening player. In the first quarter of 2022 GDP increased by 8.3%, and the banking sector loan growth continues to pick up according to Bloomberg data. In February and March 2022, they were up 8.9% and 8.8% year-over-year, respectively. There are many catalysts for the Philippines to perform well. In the last six years, the country hasn’t driven foreign investor attention, remaining an undiscovered country with plenty of potential to unlock value.

We are currently overweight in the Philippines. Our investment in the country is in Puregold Price Club Inc. (Puregold)

Puregold Price Club Inc. (PGOLD PM)

Puregold is a multi-format consumer retailer in the Philippines. The company operates under the two phimain brands: Puregold and S&R. Puregold includes hypermarkets and supermarket discounters, mainly serving lower income classes, with the average ticket size of PHP 0.9k. S&R operates 20 warehouse stores based on annual membership fees and primarily targets customers in the middle to upper income classes, with an average ticket size of PHP 4.1k.

The top three formal grocery retailers account for 40-45% of the market. S&M Retail (owned by the country’s richest family, Sy) holds 20% of the market share and is also the leading mall operator. Puregold is the second=largest grocery retailer, with a 15% market share. Robinsons Retail accounts for 5-10% of the grocery market and is also engaged in department and specialty stores, hardware stores, and malls. Puregold is the only pure grocery operator among the largest players. The grocery industry is expected to grow in line with the nominal GDP, at 9-11% annually.

The company enjoys many strengths. Their multi-format strategy provides more flexibility and optionality. Covering all income segments makes Puregold a more defensive retail player and enables the company to benefit from improvements in the spending power of all income groups. Puregold has a strong balance sheet, generating plenty of free cash flow with almost no debt. Their stores have strong unit economics. Additionally, Puregold is a well-recognized brand with a perception of the best value among consumers, coupled with a large loyalty program that enhances customer loyalty.

In terms of opportunities, the company is well-positioned for the Philippines’ growth due to its lower-priced merchandise. The consolidation of mom-and-pop stores and small chains is also a driver for growth considering its strong track record of integrating acquired grocery chains. Moreover, a rise in the private label mix has an ongoing positive contribution to margin expansion (from <1% currently to at least 10-20% in the medium term).

Recent UK monetary trends are consistent with a medium-term return of inflation to target, implying that the Bank of England should hold policy even though current inflationary pressures will be slow to fade and the consensus will claim that it is “behind the curve”.

The alternative would be to exacerbate a severe squeeze on real money balances that – on the view here – already guarantees a GDP recession.

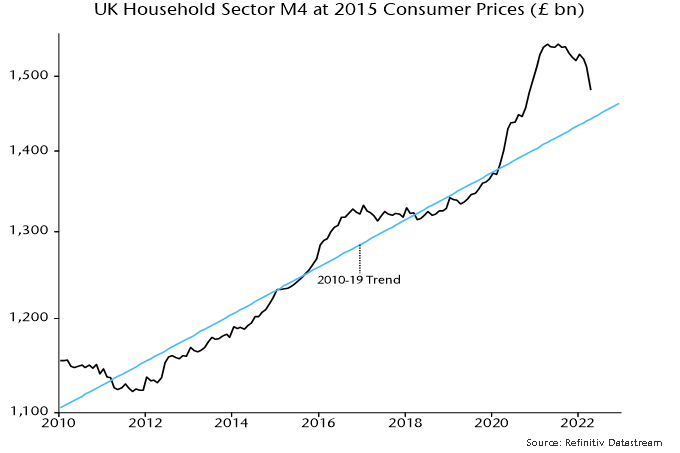
Satisfactory inflation performance in the five years before the pandemic was a consequence of low and reasonably stable money growth. Three-month expansion of the preferred broad aggregate here, non-financial M4*, averaged 4.4% annualised, mostly fluctuating between 2% and 7% – see chart 1.

Chart 1

Chart 1 showing UK Narrow / Broad Money & Bank Lending (% 3m annualised)

The covid shock arguably warranted policy action to move money growth temporarily to the top of this range. Instead, the Bank’s grotesquely miscalibrated QE programme drove three-month growth to 31% annualised in May 2020. A subsequent sharp slowdown was followed by a rise to a second peak of 15% in January 2021 following an incomprehensible decision to extend QE in November 2020.

Three-month growth, however, has been back inside the pre-pandemic range since July last year – it was 4.2% annualised in April.

Monetary trends have yet to reflect fully recent policy tightening. The April-only numbers hint at further weakness: non-financial M4 rose by only 0.2% on the month, while non-financial M1 was flat.

The latest three-month increase of 4.2% annualised may overstate underlying growth because of retail investors switching out of mutual funds into bank and building society deposits in response to recent market losses. A broader savings measure including National Savings, foreign currency deposits and retail mutual funds grew by an estimated 2.9% annualised in the three months to April**.

A further rise in consumer price momentum, meanwhile, has intensified the squeeze on real money balances. Non-financial M4 and M1 fell by 3.4% and 3.3% (not annualised) respectively in the six months to April – chart 2.

Chart 2

Chart 2 showing UK GDP & Real Money (% 6m)

Although three-month money growth has been running at a target-consistent pace for several quarters, the usual “long and variable lag” suggests that a normalisation of inflation may be delayed until late 2023 or 2024.

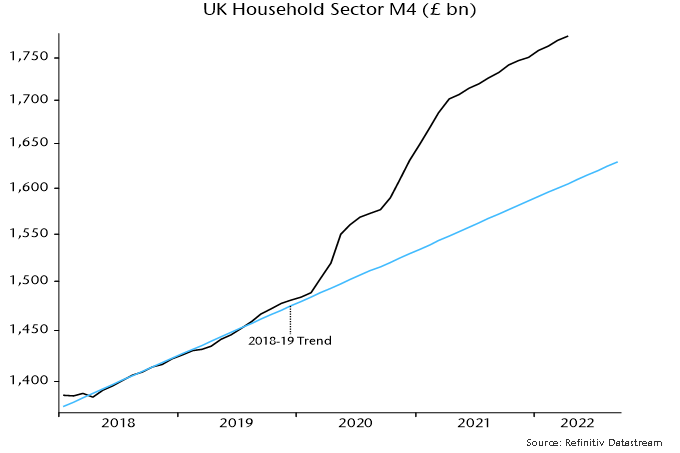
Economists were last week debating whether Chancellor Sunak’s latest cost of living support package would add to inflationary pressures. The net cost of £10 billion equates to only 0.4% of non-financial M4, i.e. the package won’t shift the dial on monetary trends and, by extension, inflation prospects even if fully financed via the banking system (unlikely).

*M4 holdings of the household sector and private non-financial corporations.
 **This assumes zero net purchases of retail mutual funds in April, following net sales in February and March.

Incoming monetary data continue to give an ominous message for near-term global economic prospects while suggesting major inflation relief in 2023-24.

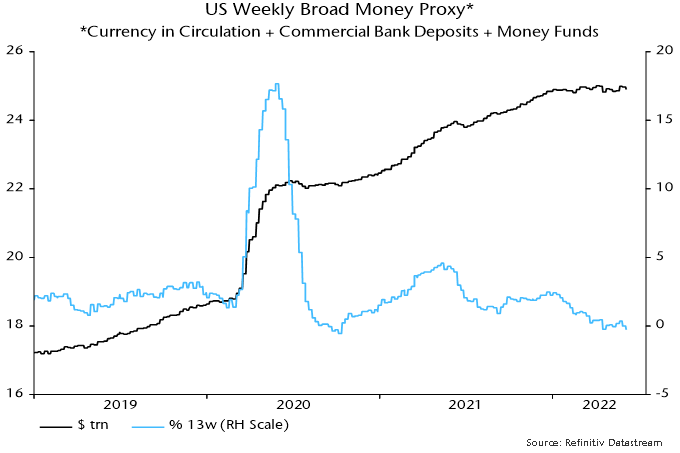
Fed numbers released on Tuesday confirm that the US broad money aggregate tracked here* fell month-on-month in April, resulting in the three-month change turning marginally negative. Weekly data on currency in circulation, commercial bank deposits and money funds suggest another decline in May.

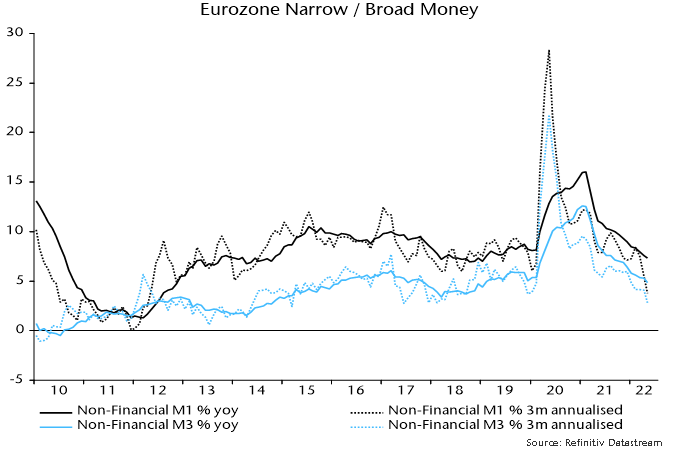
Monthly growth in Eurozone broad money**, meanwhile, was today reported to have fallen to 0.1% in April, pulling three-month expansion down to 3.7% annualised – see chart 1.

Chart 1

Chart 1 showing Eurozone Narrow / Broad Money & Bank Lending (% 3m annualised)

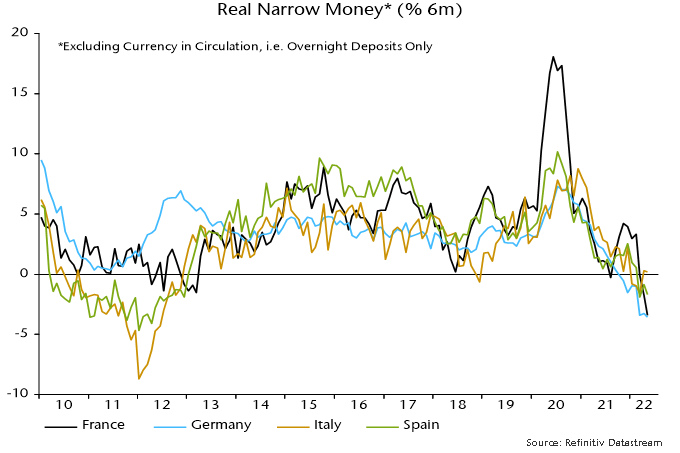
Three-month growth rates of narrow and broad money are now below pre-pandemic averages (i.e. over 2015-19). The ECB should wait to see if money growth rebounds before hiking rates but appears to be set on hawkish autopilot, with potentially disastrous consequences.

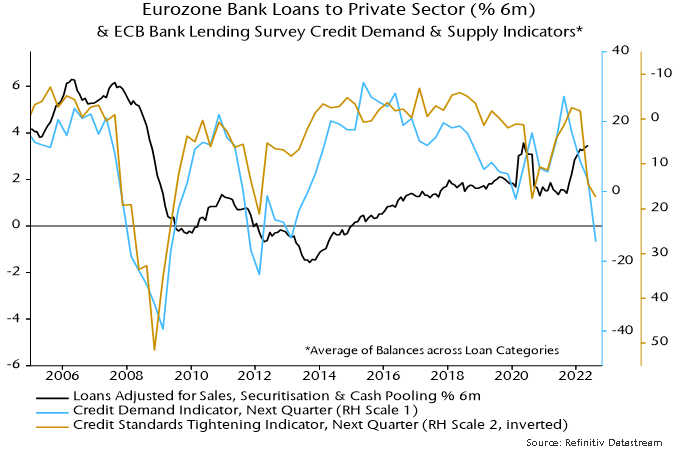
Three-month growth of loans to households and non-financial corporations remains solid but is below its peak and expected here to slow further as demand for inventory financing falls off and higher mortgage rates curb housing credit.

The slower expansion of broad money than lending mainly reflects a fall in banks’ net external assets – the counterpart of a basic balance of payments deficit – and an increase in their capital reserves. The Ukraine conflict is likely to have boosted capital outflows while causing banks to become more risk-averse. ECB purchases of government securities remained substantial in the three months to April, at the equivalent of 0.7% of broad money, or 2.7% at an annualised rate. Further monetary weakness is likely as this support ends.

The slump in US and Eurozone nominal money growth implies a severe squeeze on real money balances, given current high inflation – consumer prices rose by 9.9% and 10.9% annualised respectively in the three months to April.

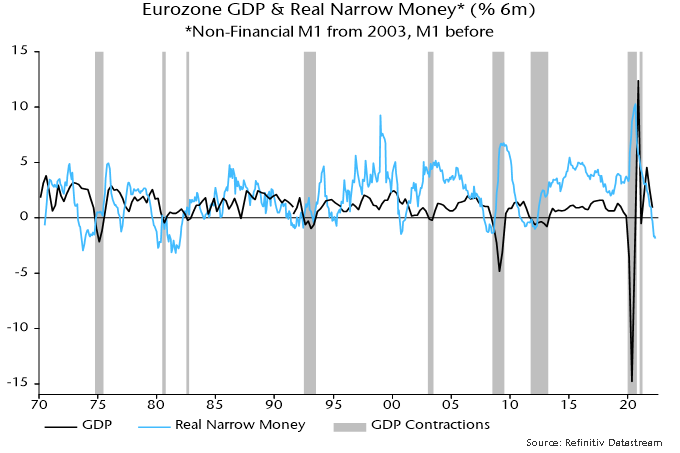
The current six-month rate of contraction of Eurozone real narrow money was exceeded only in 1973-74 and the early 1980s. Smaller declines in 1991, 2007 and 2011 also foreshadowed recessions – chart 2. There is stiff competition for the prize of worst recent official forecast but the March ECB staff projection that Eurozone GDP would grow by 4% annualised in Q2 / Q3 is a strong contender.

Chart 2

Chart 2 showing Eurozone GDP & Real Narrow Money* (% 6m) *Non-Financial M1 from 2003, M1 before

*”M2+” = M2 + large time deposits at commercial banks + institutional money funds
**Non-financial M3

Stressed businessman feeling desperate on crisis stock market, investment concept.

Investors with a total return objective have historically been served well by the fixed income component of portfolios, such as a portfolio benchmarked to the FTSE Canada Universe Bond Index (the Universe Bond Index), which has delivered a reliable return experience and valuable diversification to more volatile equity investments.

The experience today for investors such asendowments, foundations, target benefit plans and capital accumulation investors has been vastly different with double-digit negative fixed income returns year-to-date to May 20, 2022. This has been the result of the combination of high duration (sensitivity to changes in interest rates) and significant increase in interest rates.

This article investigates how investors found themselves in this duration trap and what options are available to limit future downside experience.

Increased Interest Rate Sensitivity

With the multi-decade decline in fixed income yields investors had become accustomed to the implications for lower longer-term fixed income returns. However, as yields declined, governments and companies took the opportunity to significantly lengthen their bond maturities when issuing new debt. In doing so, they have contributed to the increase in the Universe Bond Index duration and associated increased sensitivity to changes in interest rates.

While it made sense for borrowers to seize the opportunity to reduce their borrowing costs and lock in certainty by extending the lending period, there were few compelling benefits for investors with a total return objective to own these securities, especially in a lower yield environment.

It is a different situation for investors with liability-related objectives, such as defined benefit pension plans. The resulting dynamics significantly increased the risk of negative returns in a rising interest rate environment. The math is simple: if a fixed income portfolio has a yield of 2% and the duration is 8 years, and interest rates across the yield curve rise 1%, then the portfolio value would be expected decline by 6% (not considering the merits of active management).

Desensitized

The initial response to lower yields was characterized by a “hunt for yield,” which included the consideration of a core plus fixed income component that incorporated an allocation to strategies such as high yield and emerging market debt, and in some cases dedicated allocations to higher yielding assets.

Lower yields also triggered the decision by investors to look beyond fixed income and introduce allocations to less-liquid private markets, such as commercial real estate and infrastructure. Taken together, while this has witnessed a general reduction to domestic fixed income, in many cases fixed income still represents a sizable portion of total assets.

Investors have also had to deal with the desensitization to rising interest rates. For many years “experts” have predicted a rising interest rate environment that did not unfold. The volume of such predictions has led to many investors dropping their guard with respect to the ensuing risk.

Investors are currently experiencing some of the toughest fixed income markets in history, which combined with challenging equity markets, has seen the value of total portfolio assets significantly reduce from recent highs following the strong post-pandemic returns.

Avoiding the Duration Trap

There is still uncertainty with respect to interest rates, so what can be done to limit further downside performance from fixed income?

There are several potential considerations:

  1. Absolute Return Focus. Fixed income strategies with an absolute return focus, where the investment manager has greater flexibility. The manager is afforded greater flexibility with respect to the duration range, the ability to adopt both long and short positions in securities, incorporate higher yielding below investment grade securities, or a combination of these. Some of these strategies have managed to broadly maintain a fixed portfolio’s capital value while the Universe Bond Index has experienced double-digit declines.
  2. Total Return Objective. An alternative to 1) above is to work with your fixed income investment manager to determine a target return considering current yield opportunities. Under this approach, the extent to which there is a willingness to experience some level of downside risk will influence the longer-term total return potential.

    For smaller-sized investors, the total return objective could be achieved by allowing the fixed income manager to invest opportunistically across a range of pooled funds, such as short-term, universe, and higher yielding funds.
  3. Higher Yielding Strategies. The addition of higher yielding strategies (or increase to existing allocations) will by their nature have a lower duration compared to the Universe Bond Index, thereby reducing interest rate sensitivity. However, many of these strategies are still susceptible to negative returns as experienced year-to-date to May 20, 2022, with high yield and emerging market debt indices both declining significantly.

    Careful review of potential strategies will be required to appreciate the extent of the downside protection and diversification qualities. For example, Canadian commercial mortgage strategies in general have declined much less than universe bonds so far in 2022, although consideration would also need to be given to the less-liquid nature of these strategies.
  4. Private Market Strategies. The addition of private market strategies (or increase to existing allocations) such as commercial real estate and infrastructure offer alternative and stable sources of income, as well as providing diversification to equities and fixed income. However, investors need to be comfortable with the less-liquid nature of these assets, since they are valued on a much less frequent basis compared to public market investments.

Start the Conversation

The increased duration of the Universe Bond Index has created an environment where investors are experiencing some of the toughest fixed income markets ever witnessed. Uncertainty remains with respect to interest rates, but there are several considerations for investors to help manage the downside risk from fixed income investments. Start the conversation with your consultant or investment manager to see how your assets can be better protected.