Solar power plant with Shanghai skyline.

“In the land of the blind, the one-eyed man is king.”

Desiderius Erasmus‘s Adagia (1500)


Summary

  • While global liquidity remains poor, EM countries are dealing with a more manageable inflation problem than in DM. Money numbers also point to a better economic outlook for EM.  
  • Interestingly, earnings revisions for EM vs DM are crossing over in favour of the former.
  • These factors combined with a wide valuation gap that has driven poor relative returns over the past decade support a brighter outlook for prospective returns in EM.
  • EM equities were flat over the month, which belies a turbulent period where Sino-US tensions ratcheted up following US House Speaker Pelosi’s trip to Taiwan.
  • Excessive global monetary tightening risks an economic hard landing, with global equity markets pulling back on US Fed Governor Powell’s remarks at the Jackson Hole in late August that the Fed would “keep at it” despite signs of peaking inflation in the US.
  • Pessimism in China remains overdone in our view, real money trends are positive and economic indicators are jumping higher, while valuations remain compelling.  
  • Stronger energy and commodities prices supported stocks in the GCC, Brazil and South Africa, where the portfolio is underweight.
  • Stocks in Europe were broadly flat for the month despite skyrocketing natural gas prices. European leaders face the challenge of boosting ex-Russian gas supplies. There are significant bottlenecks i.e. it will take several years to build regasification plants that will support importation of LNG supplies. Power shortages threaten heavy industries in Eastern Europe, with secondary effects likely to flow through to consumer goods companies in the region.

Portfolio Activity

  • Trading over the period reflects our view that defensive and high quality exposure should be favoured in this environment, while poor sentiment in China presents an opportunity to increase exposure.
  • Trimmed exposure to Thailand on deteriorating money numbers, including taking some profits in oil company PTT Exploration and Production.
  • Trimmed Varun Beverages following a very strong run of performance, allowing us to add to Indian hospital group Max Healthcare through a secondary offering.
  • We have added Qatar National Bank – expected boost from the football World Cup, with another leg of growth via expansion of the gas fields and exports to Europe and Asia.

Sino-US tensions

Speaker Pelosi’s Trip

  • China’s measured response to Nancy Pelosi’s trip reflected a desire to avoid any action that may encourage US retaliation and escalation towards conflict over Taiwan. Presidents Xi and Biden were in direct contact in the days leading up to the trip.
  • Disincentives to a dispute over Taiwan are clear i.e. an amphibious invasion of the heavily armed island by China would come at a great cost and invite US intervention along with a heavy sanctions regime more severe than what we have seen imposed upon Russia.
  • Risks to the semiconductor supply chain as an outcome of the invasion or blockade of Taiwan would be incredibly painful for the global economy.
  • No more so than for China, which would inevitably be cut off from access to essential imports that are at the foundation of its advanced technologies. China had a taste of this when the Trump administration crippled Huawei with sanctions that denied the company access to key technologies.
  • China has thrown over $100 billion at developing semiconductor self-sufficiency but has failed to materially narrow the chipmaking gap between it and the West.
  • While extremely costly (likely many multiples of what the CHIPS Act proposes), the West will be able to establish self-sufficiency and cement a significant tech edge over China.
  • While Taiwan is a leader in semiconductor manufacturing, with c.92% share of advanced semi manufacturing, it is linked into a complex global supply chain. To illustrate: “[e]ach segment of the semiconductor supply chain has, on average, 25 countries involved in the direct supply chain, and 23 countries involved in supporting market functions. In fact, a semiconductor process could cross international borders approximately 70 or more times before finally making it to the end customer.” (Accenture report, 2020)
  • While seizure of Taiwan would give China access to Taiwan’s semiconductor assets, it would not necessarily bring it closer to self-sufficiency given that it would lead to it being cut off from the wider supply chain. Not only this, but the immense technical complexity of chip production (involving hundreds of steps and where a few specs of dust or silicon impurity can derail the entire process) requires a level of know-how and experience developed over decades, and is not something where the reins can simply be passed on to new (and compliant) management.
  •  This is an issue we are monitoring closely and factor into our framework of macroeconomic analysis that produces our country rankings which captures the forecast direction of political risk and also long term governance scores.

Is China approaching a turning point?

  • China’s economy continues to stabilise. Corporate financing conditions continue to ease, reflecting the acceleration in money growth over the past few months.
  • Manufacturing indicators are jumping higher, auto sales are surging, and home sales are no weaker than in the US. While caution over the state of the property market is warranted, the “classical” property bust is one precipitated by a tightening of credit conditions. We currently see the opposite in China today.
  • While we are not expecting China to enter a boom, conditions are better than what market sentiment suggests.

Congress, stimulus and “the mother of all reopenings?”

  • The CCP’s Politburo announced that the 20th Party Congress will take place on October 16. Could this be a catalyst for Chinese stocks?
  • It is likely Covid-zero measures will remain tight in the lead up to Congress, with stability the priority as Xi looks to cement his place alongside Mao and Deng as one of the three towering CCP figures of the party’s century in power, and secure an unprecedented third term.
  • Beijing reiterated its commitment to avoid “excessive stimulus” in the interests of promoting sustainable growth, making the prospect of the government meeting its GDP growth target of 5.5% remote.
  • The government announced a modest 19-point stimulus package including 300 billion yuan ($43.7 billion) for policy and development financial tools. While positive, the real boost will come from a relaxation of Covid policy.
  • There is cause for some optimism, with news suggesting that the approval of a domestically-produced mRNA vaccine candidate is not far off. CLSA has reported that Chinese pharma group CSPC has the candidate most likely to be approved, with preliminary data suggesting a low level of side effects versus international peers, high efficacy, and relatively high storage temperatures. The expectation is for further efficacy data to be released in October before final approval in November.
  • In any case, we think it is unlikely that restrictions will be relaxed in the short term (3-6 months). In Chengdu this month it took just 156 cases for officials to lockdown a city of 21 million people.
  • Our view is that while there are some signs of policy shift – i.e. President Xi’s first foreign trip since the beginning of the pandemic to Kazakhstan will take place in mid-September – zero-Covid is a signature policy for Xi. There are also fears that China’s healthcare system will struggle to cope with a massive influx of patients on any loosening. This makes it more likely that a shift away from this policy will be gradual (likely boosted by a new vaccine rollout).
  • With this in mind, our approach is to continue adding to our China overweight as a whole, but without going overweight cyclicals in this market until we begin to see more of an acceleration in the economy.

China is the “Saudi Arabia of renewable energy”

China Dominance of the Solar Supply Chain

Source: US Department of Energy, 2022.

Dentist medical tools - gloved hand pointing to computer displaying X-ray of teeth and jaw

Since the outbreak of Covid-19 in 2020, we have discussed the impact the pandemic has had on our lives, businesses and markets worldwide in several commentaries. The dental industry, like the whole healthcare sector, was no exception, with massive disruptions taking place, especially in the early months when patients were kept from attending routine check-ups.

Fortunately, the importance of the dental practice was well understood, and dentists have been allowed to resume operations with a set of strict protocols. However, delays caused by the pandemic left many people behind in their dental care. The stress and anxiety experienced during endless lockdowns had people grinding their teeth, further aggravating oral health issues. A friendly reminder that a good rule of thumb is to see a dentist twice a year.

During economic downturns, when consumer sentiment weakens, patients might decide to delay elective procedures. However, demand for essential health treatment remains relatively stable. We find that some healthcare companies present attractive investment opportunities, regardless of the macro environment. As the saying goes, teeth are always in style. A good example of such an opportunity is Dentium, a Korean dental implant manufacturer, and one of the top holdings of our Emerging Markets strategy.

In early-summer of 2000, Jung Sung-Min, a practicing dentist running a clinic in South Korea, established Dentium, a small manufacturer of dental implants and related instruments. Little did he expect that over the next two decades, the company would scale up successfully and capture a significant market share to end up ranking as the second largest in South Korea, and the sixth largest worldwide. Although no longer involved in day-to-day operations after stepping down as CEO and Chairman, the founder remains the largest shareholder of the company.

Dentium’s growth strategy to become a global total dental solutions provider is based on ongoing product innovations and expansion overseas. Clinical data accumulated over the years validates the high quality and solid performance of its products. The company has developed a comprehensive product lineup, expanding to digital dental equipment, including CBCT (cone-beam computed tomography), 3D printers, and CAD/CAM (computer-aided-design and computer-aided-manufacturing) systems. Dentium aims to foster package sales of its solutions, spanning from diagnosis to prosthesis procedures.

Although Dentium faces fierce competition from domestic peers, the company has steadily expanded its market share in South Korea, focusing on penetrating primarily newly opened clinics. Once its equipment is installed, recurring orders of dental implants ensure revenue stickiness, growth visibility and margin expansion. With manufacturing facilities located in South Korea, China, Vietnam, and the United States (U.S.), Dentium has established a global footprint. However, China is not only the largest market for the company, accounting for more than half of revenue, but it is also expected to remain the main growth driver in the medium-to-long term. At the same time, we believe that Dentium’s business in India, the Middle East and Southeast Asia will continue growing faster than the industry average.

The dental implant market globally is expected to exceed US $8 billion by 2028, from US $4.8 billion in 2021, implying a compounded annual growth rate of 7.6%. China, with the number of implants placed per 10,000 people equivalent to only one-tenth of the global average, will likely grow at least twice as fast. South Korea has one of the highest penetration rates of dental implants, is expected to grow at a low-to-mid-single digit annually. The global dental implant market is drifting towards an oligopolistic structure, with the seven largest companies (spearheaded by Straumann and Danaher) accounting for over 80% of sales.

In most regions, Dentium caters primarily to the value segment of the market, while providing products of equivalent quality to global industry leaders, but at more attractive price points. Combined with its rich expertise, strong reputation, consistent execution, and adequate capacity, Dentium’s success in developing countries makes total sense. However, the management team shows no signs of complacency and has set in motion an ambitious plan to become a top 3 operator globally in the next 8 to 10 years, ensuring a growth rate of around 15-20% per annum over this period. Operating leverage and growing efficiencies provide a decent uplift to margins. Thus, the operating margin of 30-35% is not only sustainable, but has some upside and compares very favourably to the 17-20% range recorded in the past.

Like many other businesses with a substantial footprint in China, Dentium faces risks primarily of a regulatory nature. The recent announcement made by the National Healthcare Security Administration of China removes lots of uncertainty and solidifies our investment thesis. Aiming to cut elevated prices at public hospitals (which apparently are higher than the average level of private sector) and educate patients, the Chinese government agency defined a set of rules and procedures to ensure central procurement and price controls at public dental clinics. Although this regulation will inevitably impact the general price level of dental implants in the private sector, Dentium caters primarily to private clinics and is expected to benefit at the expense of its U.S. and European peers, as its pricing is more attractive and highly competitive.

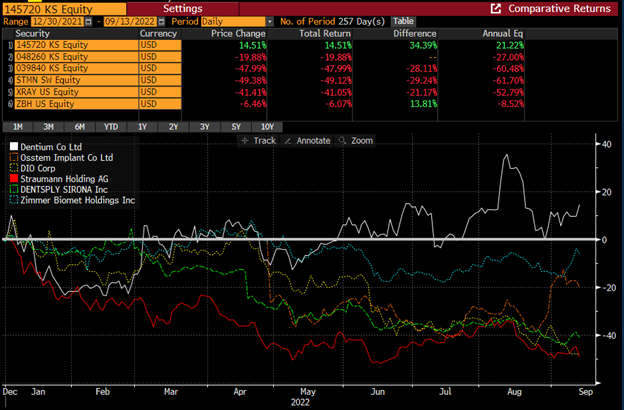
Despite having a highly attractive investment case, the company has huge room for improvement in terms of handling their investor relations. At the same time, it is not widely known among foreign investors, partially because it is not covered by any of the big brokerage firms. However, Dentium’s stock performance has been an outlier this year, outperforming its peers year to date.

Chart showing Dentium’s stock performance
Source: Bloomberg

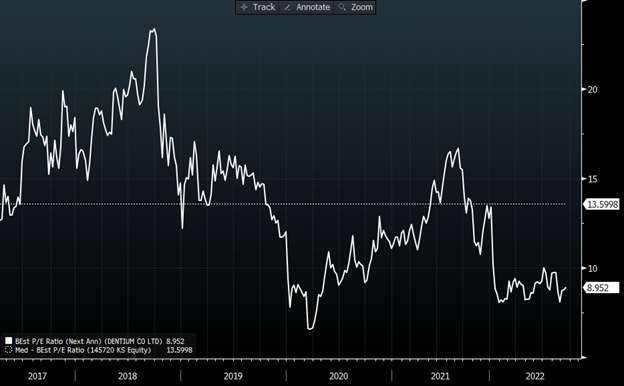
Despite its outperformance, Dentium still trades at an attractive valuation relative to its historical levels…

Chart showing that Dentium still trades at an attractive valuation relative to its historical levels
Source: Bloomberg

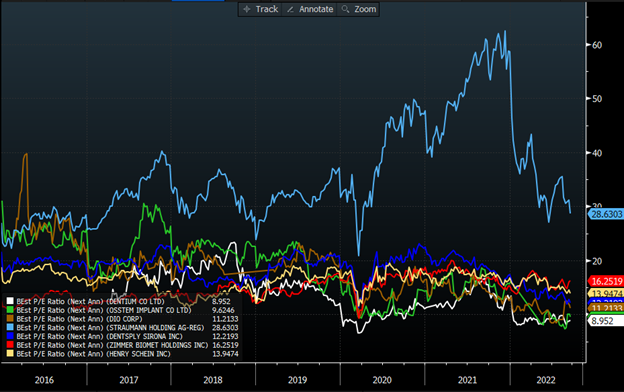
…as well as relative to its peers.

Chart showing that Dentium still trades at an attractive valuation relative to its peers
Source: Bloomberg

Warren Stoddart, Connor, Clark & Lunn Financial Group’s President and CEO recently joined Rosemont CEO Chas Burkhart as a guest on the Global Investment Leaders podcast. Warren shares his thoughts on: CC&L Financial Group’s evolution over the past four decades, growing the business to a $100 billion global firm, and what is coming up next for the firm.

In the episode, Warren reflects on the changes to the business over the years that have led to CC&L Financial Group becoming one of the largest employee-owned asset management firms in Canada. He notes that when he first started in the business, there were a number of employee-owned firms of substantial size. One by one, all either failed or were acquired. Chas and Warren discuss the many challenges to maintaining growth in an employee-led firm, in particular, succession planning, both in CC&L Financial Group and within its affiliates.

“We know the business is larger, more complex and requires more specialized knowledge in particular areas,” said Warren. “There are going to be a larger number of leaders in the next generation of the business than there were in this one. And they are going to be focused on different areas— marketing and product development was something that were almost an afterthought 20 years ago, and it’s a big part of what we do today.”

Part of the complexity comes from the growth in private markets, alternatives, global assets and global clients: 15 years ago, almost all of CC&L Financial Group’s revenues and assets came from Canadian pension funds investing in Canadian equities. Around that time, the firm made its first foray into private markets with a 150MW hydro project in BC.

Today, CC&L Financial Group’s revenues are almost evenly split between public markets, private markets, high net worth, investment products, and the returns on the investments the partners make as principals on its own balance sheets. In addition, global equities assets have surpassed CC&L Financial Group’s Canadian equities assets, demonstrating the growth and reach of the business, as well as the value of the multi-boutique affiliate structure.

“One of the secrets to our success is being very focused on establishing cultural and structural alignment of interests with our partners and within all parts of our organization,” says Warren.

Listen to the full episode of the Global Investment Leaders podcast featuring Warren Stoddart by clicking the play button below.

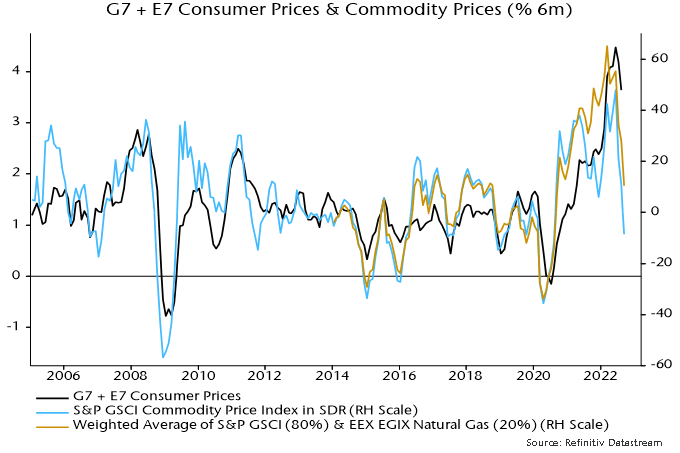
Global six-month consumer price inflation peaked in June and fell further in August, reflecting pass-through of lower oil prices and a small decline in core momentum. Current commodity prices suggest a sizeable further drop into Q4 – see chart 1*. 

Chart 1

Chart 1 showing G7 + E7 Consumer Prices & Commodity Prices (% 6m)

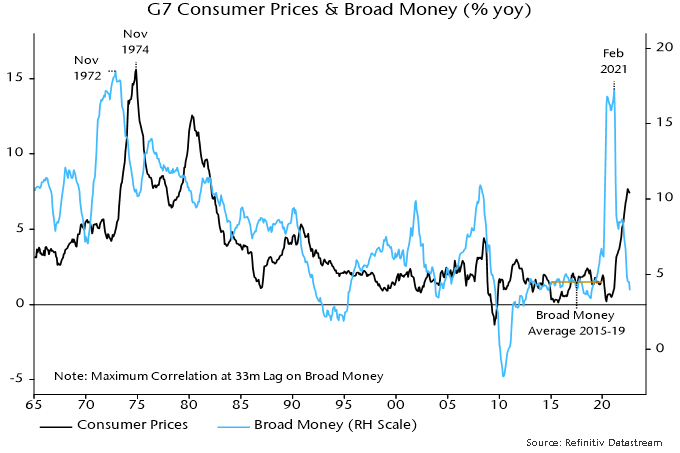
Annual as well as six-month CPI inflation probably peaked in June, with the peak occurring within the expected time band following a major top in annual broad money growth in February 2021 – money trends lead inflation by two to three years, according to the monetarist rule of thumb. 

G7 annual broad money growth is estimated to have fallen further to below 4% in August, widening an undershoot of its 4.5% average in the five years before the pandemic – chart 2. The suggestion is that G7 inflation rates will be back at or below target around end-2024, if not before. 

Chart 2

Chart 2 showing G7 Consumer Prices & Broad Money (% yoy)

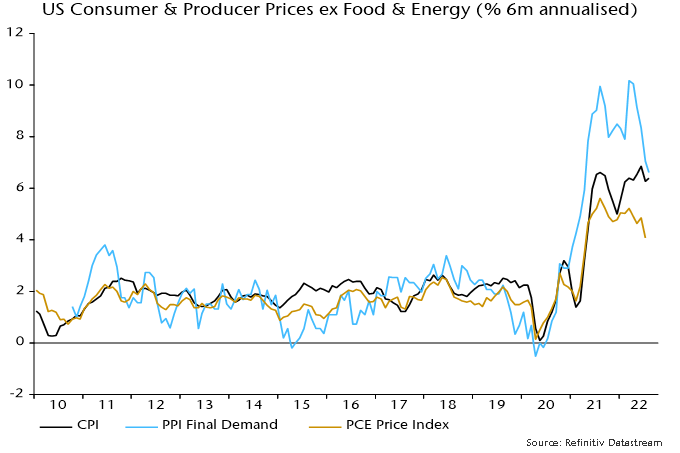
Markets were spooked by last week’s news of a hefty monthly rise in US core CPI in August but six-month momentum was little changed and below a June peak, while PPI pressures continue to ease – chart 3. 

Chart 3

Chart 3 showing US Consumer Producer Prices ex Food & Energy (% 6m annualised)

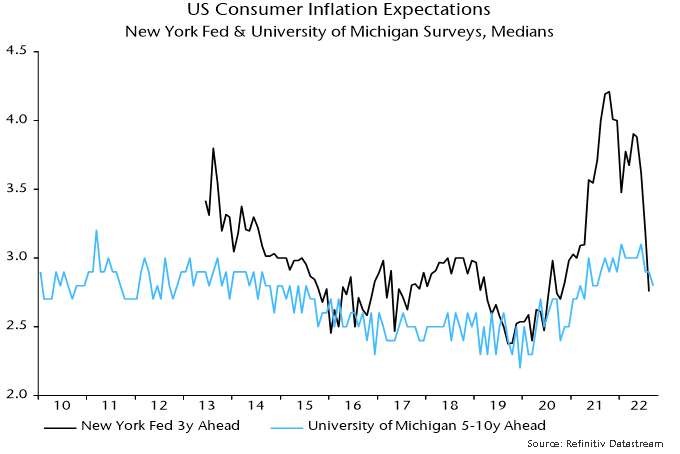
Central bankers are supposedly focused on preventing high inflation from becoming embedded in expectations. The view here has been that expectations were unlikely to become “unanchored” against a backdrop of weak money growth. The latest consumer surveys by the New York Fed and University of Michigan show longer-term inflation expectations back within 2010s ranges – chart 4. 

Chart 4

Chart 4 showing US Consumer Inflation Expectations New York Fed & University of Michigan Surveys, Medians

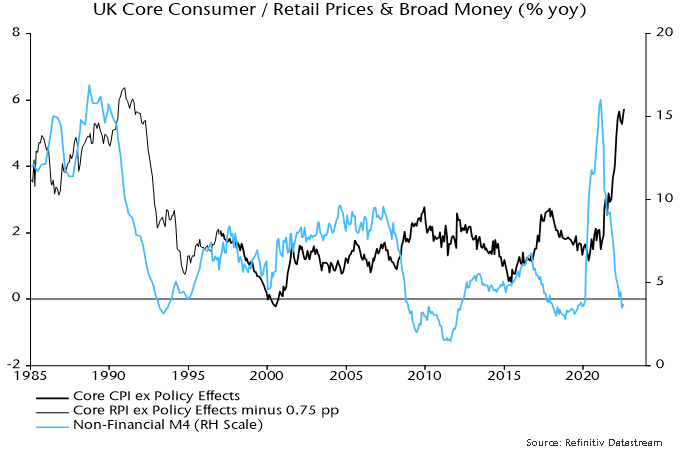
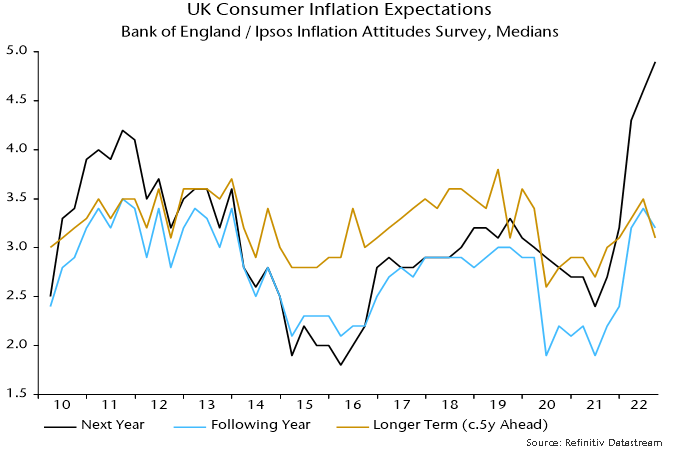
UK annual core CPI inflation made a marginal new high in August but money trends mirror the global picture and are signalling a 2023-24 collapse – chart 5. The latest Bank of England / Ipsos inflation attitudes survey, meanwhile, reported a fall in consumer longer-term inflation expectations, which have remained within the 2010s range – chart 6. 

Chart 5

Chart 5 showing UK Core Consumer / Retail Prices & Broad Money (% yoy)

Chart 6

Chart 6 showing UK Consumer Inflation Expectations Bank of England / Ipsos Inflation Attitudes Survey, Medians

The apparent anchoring of longer-term US / UK expectations suggests that wage pressures will dissipate rapidly as current inflation rates fall sharply in 2023. 

*The GSCI commodity price index uses US prices for the natural gas component; the series shown by the gold line in the chart incorporates an adjustment for European prices.

Following on our last commentary featuring Samsonite (1910 HK), more travel statistics were released confirming the increase in travel. July data shows that Europe, South America and the United States (U.S.) travel spending now exceeds the previous peak of July 2019.

Hotels in Europe saw their revenues per available room (RevPAR) in July grow 78% year-on-year, exceeding July 2019 by 19%. Occupancy rates are still below 2019 by above 5%, but average prices are 25% higher.

Meliá Hotels (MEL SM)

One holding that is very exposed to the European and Caribbean travel market is Meliá Hotels. Meliá is one a leading European hotel groups; it owns and/or manages more than 316 hotels and resorts in 33 countries, mainly in America and Europe, for a total of over 83,772 rooms, 11,854 of which are owned. Of the rooms, 63% are in Europe, 30% in the Caribbean, and 7% in Asia, which is the main reason for future room growth. Resorts account for 60% of hotels (i.e., 100% leisure), with the other 40% are urban, of which half are bleisure (business and leisure) in cities like London, Paris, Rome and Madrid.

Covid has been a huge challenge for companies, particularly in the travel and hospitality business. An important item we look at before investing in any company is the strength of the balance sheet. We want a strong balance sheet with little debt, even if it may appear as not the optimal capital structure. In times of stress, however, that strong balance sheet creates opportunities.  

Let’s contrast two world-class companies in the travel sector — Meliá and Carnival Cruise Line (CCL US):

 Meliá12/201912/2021
Number of hotels326316
Company owned4337
Total rooms83,77883,772
Number of shares outstanding (million)229.7220.5
Total net debt (excl. leases) €M5551,244
Stock price€7.86€6.06 (31/08/2022)
 Carnival Cruise Line11/201911/2021
Number of ships in service105105
Capacity per day248,790248,790
Number of shares outstanding (million)6901123
Total net debt (excl. leases) $M US10,98424,087
Stock price$45.08$9.54 (31/08/2022)
Source: Global Alpha

We can see that Meliá has the same number of rooms and less shares outstanding than at the end of 2019.  The debt, although higher, is still manageable, especially considering that the over 11,000 rooms Meliá owns could be sold and the company could eliminate most or all of the debt outstanding.  As a result, Meliá’s earnings per share, which were €0.64 in 2018, should be higher in 2024.

Meliá’s stock price, although down 23% since the end of 2019, has rebounded 121% since March 18, 2020, and should continue to rebound as results improve.

Carnival Cruise, on the other hand, had to more than double the number of shares outstanding and take on very expensive debt.  As a result, earnings per share, which were $4.49 in 2019, may never reach that level again.  Its stock price has gone down 81% since the end of 2019 and has only rebounded 2.5% since March 18, 2020, most likely a permanent loss of capital.

As investors, we are looking at per share growth. We think like business owners. If we owned the whole business, we would look to grow profits. When we buy shares, we become co-owner of the business and look for the sales and profits attached to each share we own.

Let’s look at this concept of growth per share. Every business is cyclical to a certain extent. What we want is higher highs and higher lows, and we want to avoid a permanent loss of capital.

Brunswick Corp (BC US)

A company we have followed for the last 20+ years and own in our U.S. small cap fund is Brunswick Corp.  Founded in 1845, the company has been manufacturing many recreational products over the years, from pool tables to bowling alleys, before focusing on boats, such as Boston Whaler, Lund or SeaRay and Mercury marine engines.

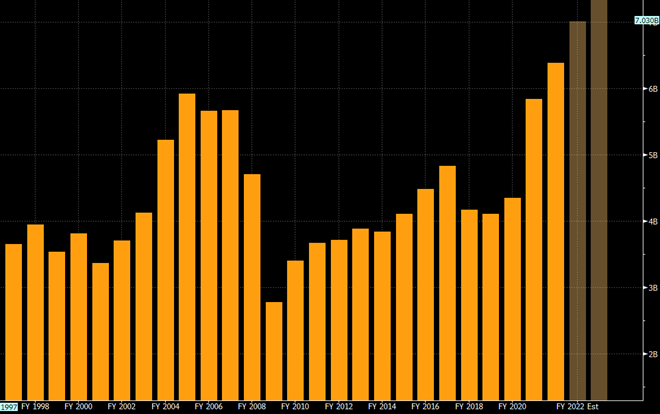
Source: Bloomberg

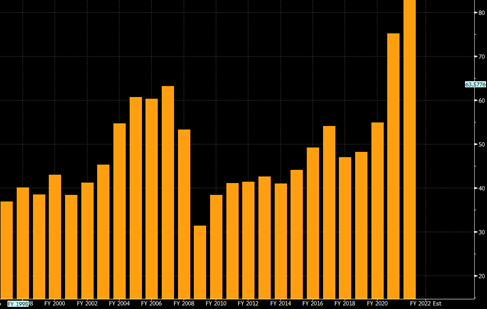
Looking at sales figures above, we can see that total sales have only increased slightly since FY2006.

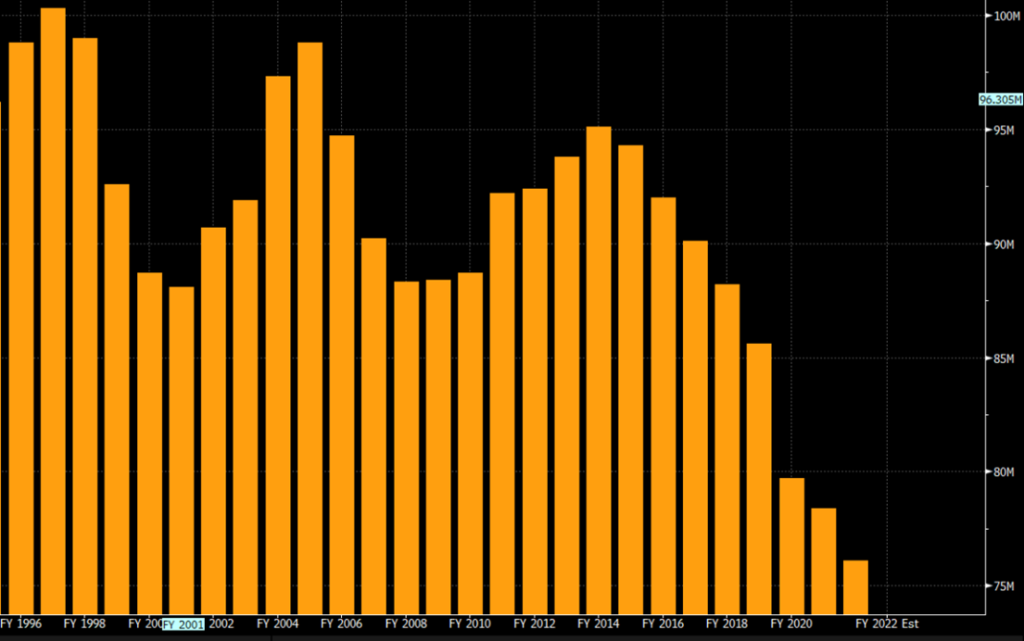
However, shares outstanding have decreased as a result of strong free cash flow used to reduce the number of shares.

Source: Bloomberg

As a result, revenue per share has also increased.

Source: Bloomberg

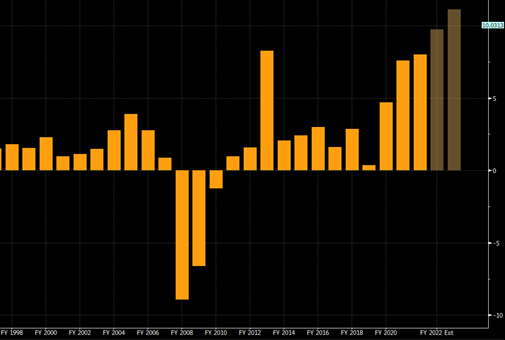
And so have earnings per share.

Source: Bloomberg

And despite the global financial crisis of 2008 and the Covid pandemic of 2020, owning the shares has been rewarding investors.

Source: Bloomberg

UK monetary trends continue to argue against Bank of England policy tightening. 

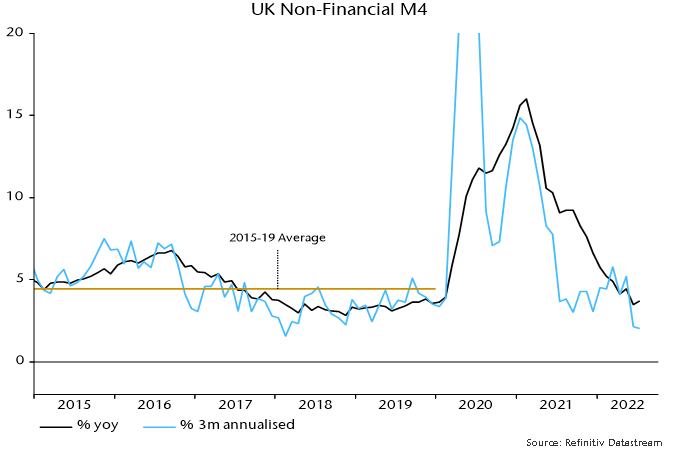
Annual growth of non-financial M4 – comprising money holdings of households and private non-financial firms – was 3.7% in July, below a 4.4% average in the five years preceding the pandemic. The aggregate expanded at an annualised rate of only 2.0% in the latest three months – see chart 1. 

Chart 1

Chart 1 showing UK Non-Financial M4

Growth of the Bank’s preferred broad money measure, M4ex, is higher, at 4.8% in the year to July and 4.9% annualised in the latest three months. This aggregate includes money holdings of financial companies, which have been rising strongly but are of little relevance for near-term demand prospects. 

Excessive money growth in 2020-21 boosted demand and “accommodated” price pressures due to various supply shocks, resulting in current high inflation. Is there still a monetary overhang from that period, warranting further policy tightening despite recent slow money growth? 

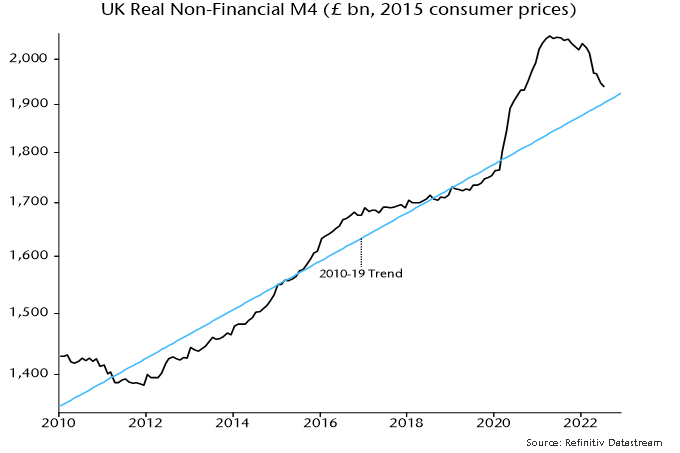
Expressed in real terms relative to consumer prices, non-financial M4 is almost back to its pre-pandemic trend – chart 2. The suggestion is that the monetary excess has already been largely “absorbed” by higher prices. 

Chart 2

Chart 2 showing UK Real Non-Financial M4 (£ bn, 2015 consumer prices)

In the absence of an overhang, the recent pace of money growth, if sustained, should be consistent with inflation returning to target within the two to three year horizon relevant for policy. Further tightening risks unnecessary economic pain and an eventual undershoot. 

Are the Truss government’s plans for large-scale fiscal loosening inflationary, warranting offsetting monetary policy action? 

Whether energy subsidies, tax cuts  etc. will prove inflationary depends on how they are financed. The banking system is likely to provide at least part of the funding, implying a first-round boost to broad money. 

A renewed rise in annual non-financial M4 growth to more than 6% would be inconsistent with medium-term inflation normalisation, requiring offsetting Bank action. 

Such a scenario, however, is far from guaranteed. Money growth was arguably on course to fall to a dangerously low level, reflecting planned Bank QT of £80 billion a year (equivalent to 3.4% of the current level of non-financial M4), a slowdown in mortgage lending and external outflows due to an expanded balance of payments deficit. 

A boost from monetary financing of fiscal loosening may offset such negative influences without pushing money growth significantly higher. 

A sensible approach, therefore, would be for the Bank to wait to assess the monetary consequences before deciding whether fiscal plans require a policy response. The current MPC membership, of course, has no understanding of or interest in monetary analysis. 

The Keynesian consensus view is that fiscal expansion necessarily implies a higher level of demand that the Bank cannot allow. The monetarist response is that, unless it leads to faster money growth, fiscal loosening will push up market interest rates and “crowd out” private spending. Surging gilt yields suggest that this scenario is already playing out. The Bank should avoid piling on the pain.

Since publishing our inaugural Responsible Investment report last year, NS Partners has continued to make progress in this ever-evolving world of responsible investment. Over the past twelve months, we have seen an increased interest in how we address Environmental, Social and Governance (ESG) factors in our investment process from clients and investee companies. It is clear that these factors represent a central tenet in the investment landscape and, as an asset manager with a fiduciary duty to our clients, NS Partners is committed to continue making progress on our own responsible investment processes.

In October 2021, NS Partners began utilizing third-party ESG data from MSCI, which has broadened our sources of ESG information and enhanced the depth of our analysis capabilities for our portfolios. NS Partners recognizes the limitations that surround third-party ESG data, such as the low correlation across various third-party vendors’ ESG scores and ratings. We will continue to carry out our own internal research to capture a more complete picture of companies’ ESG risks and opportunities and ensure the materiality of the factors that are integrated into our company analysis.

In this report, we are pleased to share highlights and accomplishments with respect to our ESG approach. 

Task Force on Climate-related Financial Disclosures

We are extremely pleased to announce that, in summer 2022, NS Partners have become official supporters of the Task Force on Climate-related Financial Disclosures (TCFD) recommendations. Established by the Financial Stability Board, the TCFD provides disclosure recommendations designed to help companies provide better information to support informed capital allocation. The recommendations are structured around four themes: governance, strategy, risk management, and metrics and targets. As supporters of the TCFD, NS Partners will publish its own TCFD-aligned disclosure, which will describe our approach to identifying, assessing and managing climate-related risk in our investment process. Additionally, we will continue to engage with the companies in which we invest to encourage further adoption of the TCFD recommendations.

Portfolio Carbon Footprint

NS Partners monitors the carbon footprints of our portfolios on a quarterly basis, we are consistently below our respective benchmarks in terms of weighted average carbon intensity.

Chart 1: Portfolio vs Benchmark Weighted Average Carbon Intensity

Proxy Voting

At NS Partners we continue to use proxy voting as an important means to influence responsible conduct at investee companies. As stewards of our client’s capital, we have a fiduciary duty to vote proxies in the best interest of our clients. We use our voting rights as a route to engage with issuers and give a voice to our views.

Over the past year, NS Partners has voted 4,456 proxy votes and voted against management’s recommendation on 9% of the resolutions. Details regarding these votes are summarized in the table below.

Table 1: Proxy Vote Results


Proxy Voting Engagements

In addition to exercising our votes we reach out to companies to engage on proposals that do not align with our voting policy, seeking to better understand the issues raised and enter into a constructive dialogue with investee companies.

The Home Depot

In May 2022, NS Partners engaged with The Home Depot prior to the company’s annual general meeting regarding a shareholder proposal calling for the company to report on its efforts to eliminate deforestation in its supply chain. Although the company shared that its Wood Purchasing Policy discloses its policies and partnerships for managing deforestation in its supply chain, we noted that the company does not disclose the proportion of wood sourced from certified well managed forests. NS Partners felt that shareholders would benefit from additional information on the company’s efforts and would allow them to better assess how the company is managing risks in its supply chain. The proposal passed with a majority of shareholders supporting a report on its strategy to manage its supply chain’s impact on deforestation.

Honeywell International Inc.

In April 2022, NS Partners voted in favor of a shareholder proposal calling for the company to report on how the company’s lobbying activities and the lobbying activities of trade groups and other organizations the company belongs to align with the Paris Climate Agreement goals. Although Honeywell International had recently published a climate lobbying report, NS Partners supported the proposal on the basis that shareholders may benefit from a more comprehensive evaluation of the climate lobbying being conducted on the company’s behalf.

Engagement Examples

Engagement continues to be a key part of NS Partners’ approach to ESG and Responsible Investment, it is an opportunity to create positive change at investee companies.

Climate Action 100+

NS Partners continues to progress with our participation in Climate Action 100+, an investor initiative to ensure the world’s largest corporate greenhouse gas emitters take necessary action on climate change. As part of this initiative, NS Partners has signed on to participate in the collaborative engagement with holding Lockheed Martin. The group has engaged in calls with Lockheed Martin throughout 2021 and 2022. In the most recent engagement in June 2022, the group discussed Lockheed Martin’s climate-related goals and targets. Specifically, the group discussed the efficacy of joining an initiative such as the Science-based Targets Initiative (SBTI) to guide their emissions goals and targets. Lockheed Martin shared concerns in joining the initiative, as they would be committing to set targets on their Scope 3 emissions. Given the end-users of Lockheed Martin’s products, the company argued that they have little control over the use of their products. NS Partners plans to continue to monitor and engage on the company’s progress on these issues.
Russia

Following the Russian invasion of the Ukraine in February this year, many companies ceased operations in Russia in response. There were a small number of companies that continued to operate in Russia despite the widespread condemnation and sanctions imposed. We reached out to a number of these companies to understand their position on continuing to conduct business in Russia and whether they were considering any plans to exit these businesses. We received a low response level from the emerging market companies we sought to engage with; however, the European companies were more willing to have a dialogue. Pharmaceutical companies Roche Holding and AstraZeneca have ceased to recruit new patients into trials in Russia but will continue to provide life-saving drugs in-line with International Humanitarian Law, which is a position we can appreciate. Building materials company, Sika, has scaled back operations and is considering its options for the small division that continues to operate in Russia. We will seek to engage with the company again on the outcome of such considerations. French construction company, Vinci, owns stakes in two motorway concessions in Russia, these are a negligible portion of their capital employed and as such the company appear less willing to address investor concerns. We will seek to re-engage with the company to assess progress. Finally, consumer staples giant, Nestle, did not wish to comment on the details while they assess their options, and as such, NS will request an update from the company in the coming months.

Governance Summary 

Chart 2: Average Female Board of Directors


Chart 3: Average Board Independence


Chart 4: Percentage of Issuers with a Separate Chair/CEO

MSCI ESG Profile

As referenced earlier, NS Partners recently subscribed to MSCI’s ESG data. From an ESG integration standpoint, this data has enhanced the resources available to our investment team as part of their bottom-up stock analysis. Our investment team uses this third-party data to complement our own in-house ESG research.

The ratings of our portfolios are higher or in-line than the benchmark in all but one case. The NS Partners Global fund holds an off-benchmark position in the NS Partners Emerging Market Fund which reduces the overall rating to one notch below its benchmark. In addition, our ESG Rating is above the respective benchmarks across our portfolios, again with the exception of the NS Partners Global Equity fund. Also of note is the larger proportion on ESG ‘leaders’ in all our portfolios versus their benchmarks. 

Table 2: ESG Ratings


Chart 5: Weighted Average ESG Score


Chart 6: ESG Ratings Distribution


Businesswoman wearing a mask checking the boarding time at a digital timetable at the airport terminal.

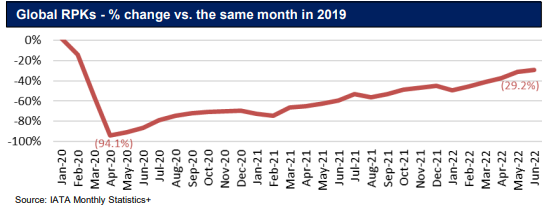
Have you been on vacation this summer? It seems everyone is travelling again. Indeed, travel activities have dramatically increased in most regions, except China, as shown by the data conducted by Global Revenue-Passenger Kilometers (RPKs: multiplying the number of paying passengers by the distance travelled).


In previous commentaries, we’ve shared updates on travel-related stocks, such as Melia Hotel (MEL SM) and Autogrill (AGL IM). Both are long-term holdings and niche market leaders. This week, we would like to profile Samsonite, a relatively new holding initiated in November 2020. Although listed in Hong Kong, it is a truly international company present in over 100 countries.

Samsonite International S.A. (1910 HK)

Business Overview

  • Founded in 1910 in Denver, Colorado by the Shwayder Brothers, Samsonite is the world’s largest travel luggage company.
  • It owns many brands, including Samsonite, Tumi, American Tourister, Gregory, High Sierra, Kamiliant, ebags, Lipault, and Hartmann.
  • Before 2012, its business was mainly focused on the Samsonite brand, travel luggage and the wholesale channel. Today, it has a more balanced business with multiple brands through multiple distribution channels.

Target market

Competition

  • A very fragmented market. Other top players are VF Corp, ACE, Delsey, Rimowa, and VIP Industries.
  • Samsonite dominates in most markets, except in India and Japan.

Competitive advantages

  • Samsonite has 17% market share in the global luggage market.
  • Strong brand recognition.
  • A wide range of brands, from mid- to high-end.

Management

  • Kyle Francis Gendreau is the CEO of Samsonite, previously CFO. He joined the company in 2007.
  • Timothy Charles Parker, a turnaround veteran, has been the Chairman since 2011. He owns 3.9% of the company.

ESG

  • Samsonite provides very comprehensive annual ESG reporting.
  • Carbon emission reduction targets: to cut carbon intensity by 15% from 2017 to 2025; to power all operations with 100% renewable energy by 2025.
  • Six out of eight board directors are independent, and one woman sits on the board.

Growth strategy

  • Product: new product innovation.
  • Distribution: focus on Tumi’s international expansion and e-commerce growth.

Recent developments

  • Last week, Samsonite reported very strong 1H earnings, with net sales up 59% year-over-year, driven by North America, Latin America, and Europe.
  • Ample liquidity of US$1.4 billion.
  • It expects a stronger recovery over the rest of 2022, especially from Asia, with price increases and cost savings to help profitability even further.

Cyclical equity market sectors have recouped part of their H1 underperformance of defensive sectors but monetary and cycle considerations suggest further weakness ahead. 

MSCI divides the 11 GICS sectors into cyclical and defensive baskets, the former comprising materials, industrials, consumer discretionary, financials, real estate, IT and communication services, and the latter consumer staples, health care, utilities and energy. 

The analysis here additionally separates the “tech” sectors of IT and communication services from other cyclical sectors on the grounds that they correlate differently with macro factors. Similarly, energy has distinct characteristics warranting separate consideration from other defensive sectors. 

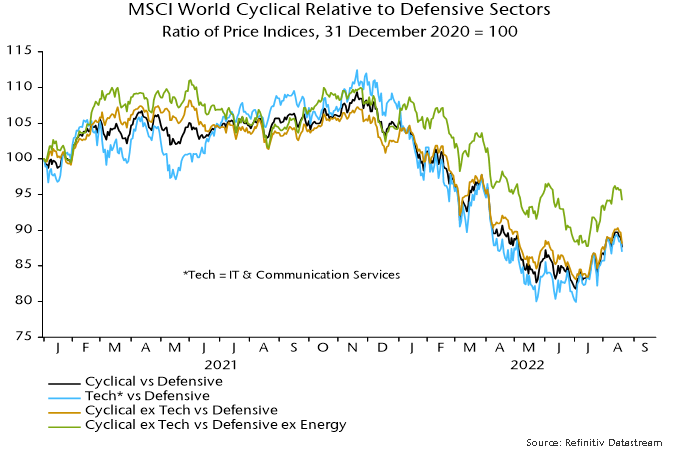
Chart 1 shows various measures of cyclical sector relative price performance, all of which staged significant recoveries from July into late last week. 

Chart 1

Chart 1 showing MSCI World Cyclical Relative to Defensive Sectors Ratio of Price Indices, 31 December 2020 = 100

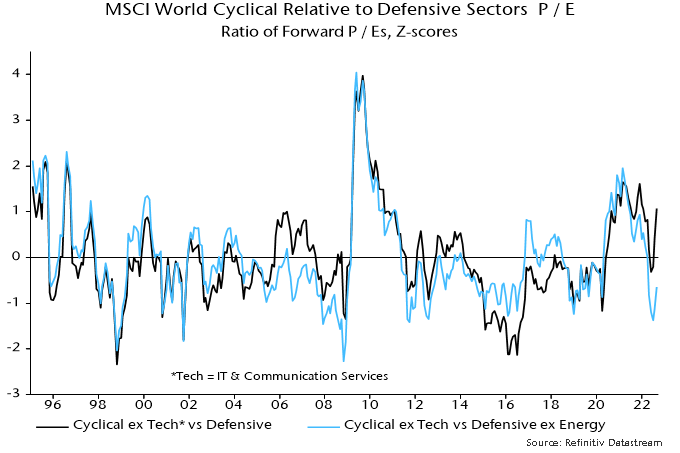
Is there a valuation case for cyclical sectors following their H1 underperformance? Chart 2 shows that the forward P/E of non-tech cyclical sectors relative to the defensive sectors basket is above its long-term average, suggesting overvaluation. 

Chart 2

Chart 2 showing MSCI World Cyclical Relative to Defensive Sectors P / E Ratio of Forward P / Es, Z-scores

The overshoot, however, reflects current / expected high earnings in energy. Excluding energy from the defensive basket, the P/E relative was 1.4 standard deviations below average at the recent low, although the gap has since halved. 

The suggestion that non-tech cyclical sectors offer value, however, depends on current earnings forecasts proving reliable. With the global economy entering recession, downgrades are multiplying and are likely to be larger on average in cyclical sectors. The P/E relative, in other words, could normalise via earnings rather than a cyclical relative price recovery. 

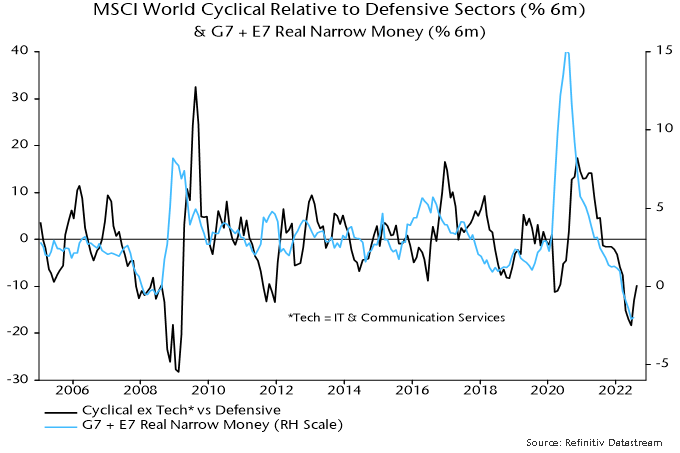
Global monetary trends continue to suggest cyclical weakness. Six-month real narrow money momentum usually moves ahead of major swings in relative price momentum but remains stuck at a multi-decade low – chart 3. 

Chart 3

Chart 3 showing MSCI World Cyclical Relative to Defensive Sectors (% 6m) & G7 + E7 Real Narrow Money (% 6m)

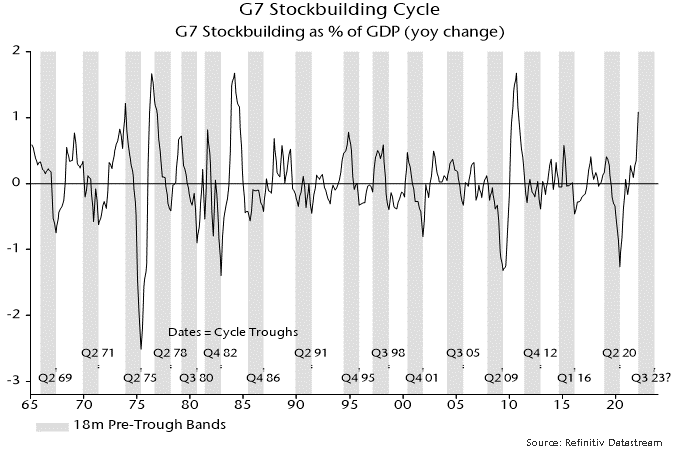
Cyclical relative performance also correlates with the stockbuilding cycle, which, according to the assessment here, is entering a downswing that is unlikely to bottom before mid-2023. Chart 4 shows a long-term history of the cycle, with shaded areas marking 18-month windows preceding prior lows. 

Chart 4

Chart 4 showing G7 Stockbuilding Cycle G7 Stockbuilding as % of GDP (yoy change)

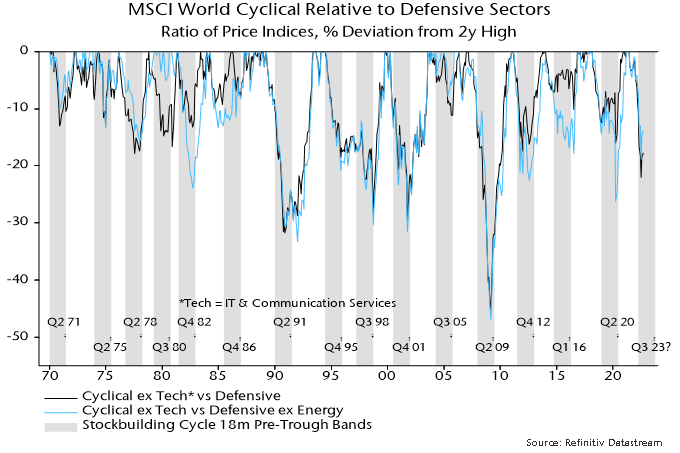
Chart 5 reproduces the shading in chart 4, superimposing the drawdown from a rolling two-year high of the non-tech cyclical / defensive sector price relative (including and excluding energy). Historically, the price relative has usually bottomed late in the downswing, or even after the trough. 

Chart 5

Chart 5 showing MSCI World Cyclical to Defensive Sectors Ratio of Price Indices, % Deviation from 2y High

Cyclical sectors also underperformed sharply at the start of downswings in 2000 and 2011. Minor recoveries ensued followed by a second bout of weakness as the cycle moved towards the trough. 

A major relative price low in July so soon after the cycle peak would be unprecedented.

The weak absolute returns in the period reflect a very challenging investment environment for our strategy. Our focus on African and Asian companies and through-the-cycle underwriting process puts us at a cyclical disadvantage when food and oil prices experience sharp and sustained inflation. The consumer basket in our markets is over-indexed to those basic commodities, and the fiscal and balance of payment dynamics of most developing countries (where we exclusively invest) are inversely correlated to commodity prices.

While we invest in companies rather than countries, our portfolio construction process is primarily top-down driven and aims to produce a healthy mix of factors including country, sector, market capitalisation and valuation. The strategy will always be geared to domestic themes and entrepreneurial businesses which naturally results in the portfolio being under-indexed to straight commodity plays or interest rate sensitive large state-owned banks. Nevertheless, we generally do not try to make oversized single sector bets, as we have the luxury of picking exceptional businesses across a wide geography without heeding to any particular index.

As active and long-term investors, portfolio turnover comes from three sources:

  1. Positive thesis: a new buy or an increase in investment in an existing portfolio company, or an exit or reduce in an investment that reached a level that we deem to be full value
  2. Break in thesis: an exit on a break in thesis on a company due to high forecast error. These forecast errors typically come about when we underestimate competitive intensity, did not anticipate adverse regulations, or don’t agree with capital allocation decisions by management teams. Note that in these situations, the decision is typically to exit the investment, rather than reduce
  3. Change in environment: an exit or a reduce due to a change in the macroeconomic environment that overwhelms the positive attributes of the business we underwrote for a longer period than we think is tolerable  

Year-to-date, the majority of our decisions can be classed under the last point. The macro environment in Egypt and Pakistan has materially worsened after the Russian invasion of Ukraine and as a result we exited two companies in the former and one company in the latter, and right sized our portfolio in both countries. We also selectively reduced exposure in Kenya in response to the same changes in the macroeconomic environment. As a result, cash has experienced the largest percentage increase in the portfolio.

More recently, we started to selectively put cash to work, focusing on companies we previously shunned on valuations and portfolio companies that have de-rated to levels that make them attractive for re-investment. All of those investments are in Asia as we still believe certain countries there will prove more resilient compared to their peers in Africa and other markets we invest in.

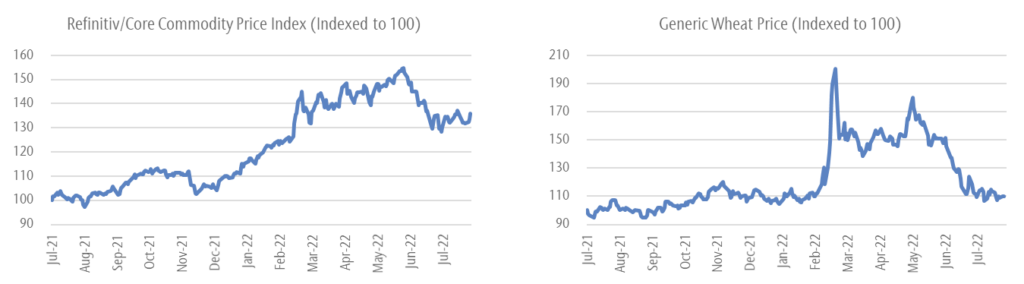
As global recessionary fears grow, we see a silver lining emerging in the form of softer commodity prices, which if sustained, will provide much-needed relief to developing market economies. Unless a recession proves deep, we think lower commodity prices will be a net positive to those countries. Moreover, we believe many of our portfolio companies will be resilient through a recession given the nature of the products and services they sell and/or the type of customer they target; supported by very healthy balance sheets and potential margin expansion they can experience if commodity prices continue to come off.

Figure 1: commodity prices

Chart of Refinitiv/Core Commodity Price Index. Chart of Generic Wheat Price.
Source: Bloomberg

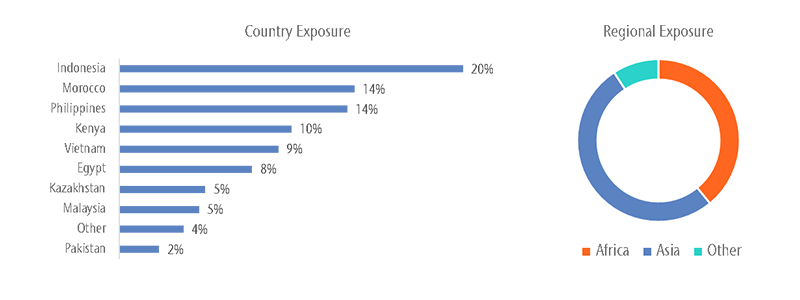
Figure 2: country and region exposure

Country Exposure. Indonesia: 20%. Morocco: 14%. Philippines: 14%. Kenya: 10%. Vietnam: 9%. Egypt: 8%. Kazakhstan: 5%. Malaysia: 5%. Other: 4%. Pakistan: 2%.  Regional Exposure chart showing Asia with approximately 50%, Africa with approximately 40%, and Other with approximately 10%.
Source: Vergent Asset Management


Figure 3: portfolio ownership type

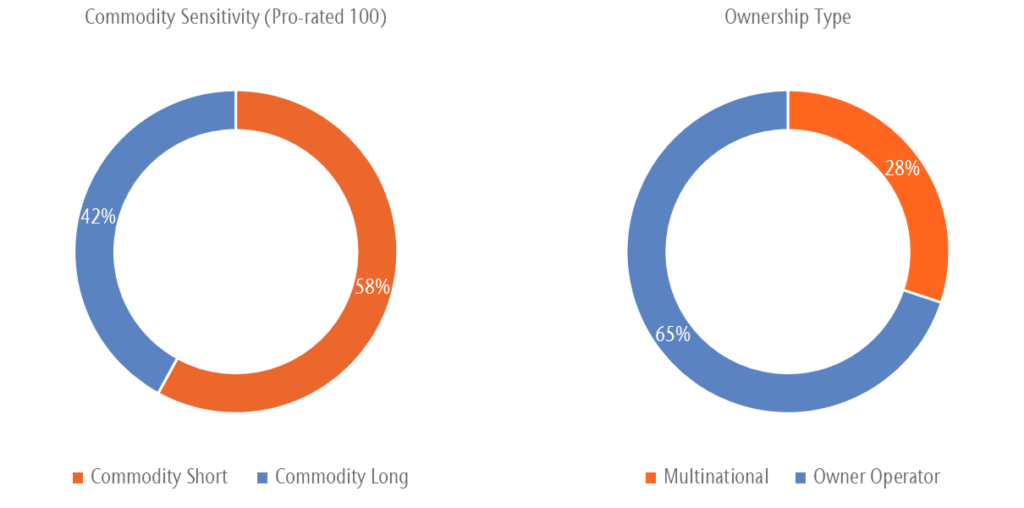
Commodity Sensitivity (Pro-rated 100). Commodity Short: 58%. Commodity Long: 42%. Ownership Type. Multinational: 28%. Owner Operator: 65%.
Source: Vergent Asset Management

Figure 4: sector exposure

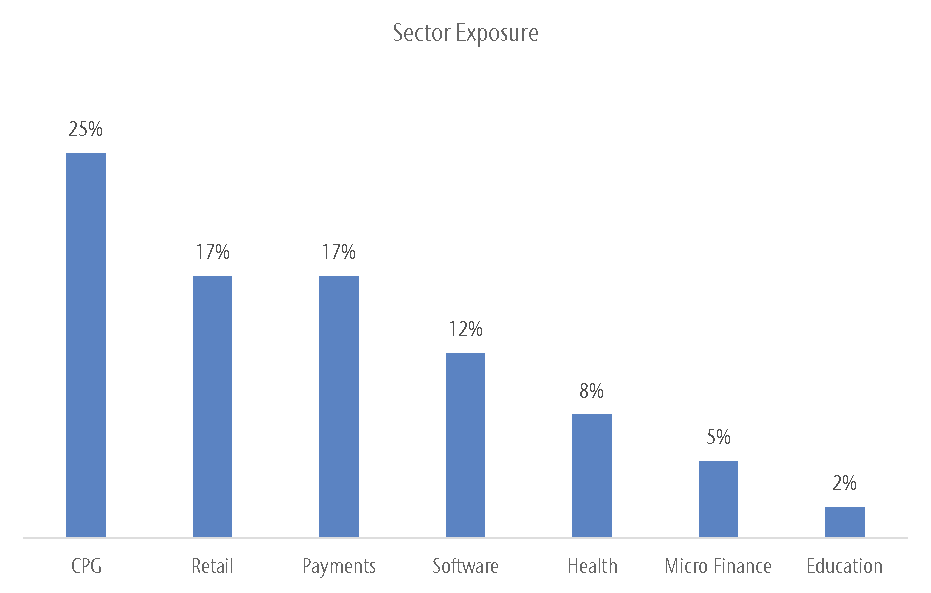
Sector Exposure. CPG: 25%. Retail: 17%. Payments: 17%. Software: 12%. Health: 8%. Micro Finance: 5%. Education: 2%.
Source: Vergent Asset Management

To support our investment decisions in this difficult environment, our team has visited four countries in the last two months, with a focus on portfolio companies rather than new idea generation.

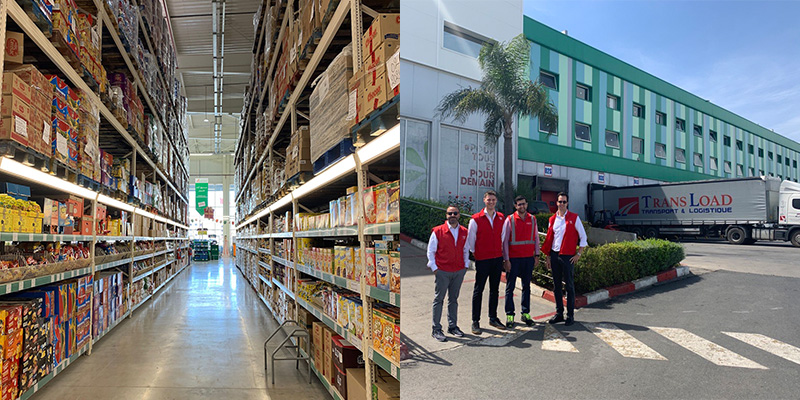
Our first trip was to Morocco where we visited LabelVie, the leading grocery retailer in Morocco and a core holding in the portfolio. Our bullish view on LabelVie as the long-term winner in Morocco’s grocery market was reinforced after our trip. The company operates in a market dominated by traditional trade (+85% of the market) and a limited set of modern chained competitors. Morocco is a country with supportive demographics, solid balance of payments fundamentals, and a self-sufficient export-oriented agricultural economy which we think is always supportive for the development of the grocery retail industry.

We are most excited by Atacadão, the company’s cash & carry format, which targets traditional retail and professional buyers. The business sells bulk-packaged fast-moving consumer goods at the lowest price in the market (examples are cereals, rice, sugar, edible oils, beverages, laundry detergents, etc.). With Atacadão, LabelVie is enabling traditional trade rather than competing with it, a much less capital-intensive growth strategy. In some respects, Atacadão is disintermediating the antiquated, highly complex, and multi-layered fast-moving consumer goods (FMCG) distribution system that exist in many of the countries where we invest. These systems produces many negative externalities including inflation and wastage, which end up in higher consumer prices and lower retail margins.

After a few years of experimenting with the format, management seems to have cracked the code on Atacadão and is now looking to double store count to 26 within three years. Atacadão’s stores are approximately 30k square feet in size, carry around 4k SKUs, and are designed to maximise natural lighting to lower energy usage and keep operating costs down. The stores are strategically located near large catchment areas with supportive infrastructure to enable easy access to and from store. Each store has two sets of checkout aisles dedicated to professional buyers (cardholders, of which there are +35,000 today) or walk-in customers who are typically community shoppers.

This dual checkout system provides the company with a tremendous data asset, which they use to direct promotions or generate insights to brands (note that brands lose the data in the traditional distribution model). Uniquely, both national and global brands like Coca-Cola and Unilever deliver their products directly to Atacadão stores, reducing logistics investments and freeing existing warehouses and distribution centres for their other fast-growing retail format, Carrefour.

The Carrefour banner is another part of the LabelVie story that is delivering strong growth and gaining share in the modern grocery retail market in Morocco. The store’s focus on fresh produce, bakery, FMCG, and alcoholic beverages to generate footfall and utilise a price matching strategy with discounters to bring in shoppers from all income levels.

LabelVie’s key strength today is the ability to leverage its multi-brand platform to negotiate favourable terms with suppliers which it then transfers to shoppers (by lowering price) and shareholders (by increasing margins or subsidising store capex). We also had the privilege of spending time with the group’s new CEO, Naoual Benamar, a Procter & Gamble veteran whose appointment marks a new era for the company. Naoual spent the past three years at LabelVie before taking over from the founding CEO Zouhair Bennani, who continues to serve as Chairman.

Overall, we think the market is behind the curve on valuing the potential of Atacadão and Carrefour and see LabelVie as a multi-year secular growth story.

Figure 5: inside an Atacadão store (left) and Vergent team with LabelVie management (right)

Source: Vergent Asset Management

Our next trip was to Almaty, Kazakhstan where we spent nearly a week trying to learn everything we can about Kaspi.kz, a portfolio company that we discussed in detail in previous letters. We saw firsthand just how entrenched Kaspi is in the daily lives of Kazakh consumers and businesses. Whether it was a street performer, a small bakery, a Zara store in an upmarket mall or a McDonalds in a residential neighborhood, Kaspi consistently ranked as the most popular payments method for consumers. Kaspi’s operational excellence, hyperlocal strategy, obsessive focus on customer experience through Net Promoter Scores (NPS), and understanding of how incentives drive behaviour allowed them to build an unrivaled two-sided proprietary payments ecosystem so powerful that it even leapfrogged Visa and MasterCard – two of the largest and most well-funded payment networks in the world.

Kaspi is constantly looking at ways to drive value within its ecosystem. One example is in Marketplace, where Kaspi ranks as the leading online marketplace in Kazakhstan and where payments services sit neatly alongside BNPL, logistics and advertising products, all of which drive GMV growth and increase monetization.

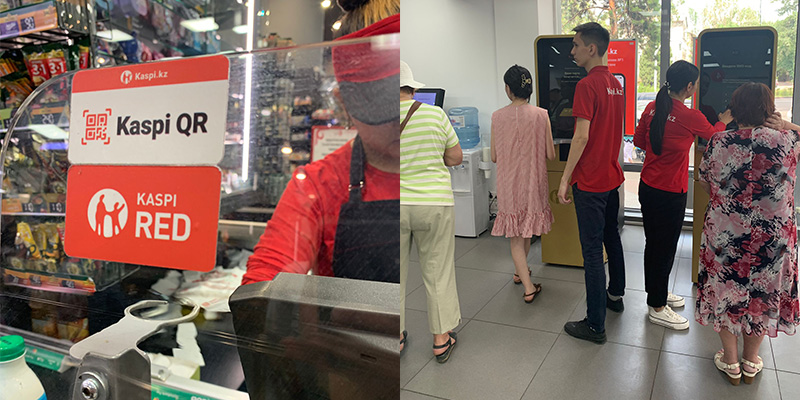
Even in an offline environment, Kaspi leverages its merchant acquiring asset and consumer app to generate sales to merchants in-store through targeted promotions and sales activities, creating more opportunities for buyers and sellers to transact. We were fortunate to spend time with members of the senior management team who reiterated how the company is centered on its NPS score, which not only drives new product ideas but also serves as the primary KPI for management compensation. This was most evident during one of our unaccompanied visits to a Kaspi branch, where we were delighted to receive an Apple Store-like customer experience, with staff happily assisting us in navigating the very futuristic (and Kazakh/Russian language only) ATM.

We also had the privilege of spending two hours with Kaspi’s CEO Mikael Lomtadze at his office in Almaty, where we got to hear the Kaspi story from the man credited with turning the company from a failing corporate bank into the super-app of today. It is rare to get audience with Lomtadze and so we took the opportunity to ask him tough questions to which we believe we received candid and thoughtful answers. In this meeting, it became evident that Mikael’s clear vision and operational execution which focuses on customer experience, technology, and big profit pools are very much responsible for Kaspi’s success.

Kazakhstan remains in a political bind due to its proximity and links to Russia, as well as the evolving and fluid domestic political scene which we covered in the last letter. This complicates the bottom up thesis on Kaspi, but by no means breaks it. We believe the market fails to properly appreciate that Kaspi has entered a sweet spot where every product launched will have an unusually high rate of success because it is released into a scaled and highly engaged ecosystem with multiple virtuous cycles running simultaneously. We still firmly believe that the risk-reward on Kaspi sets up the strategy for significant upside down the line.

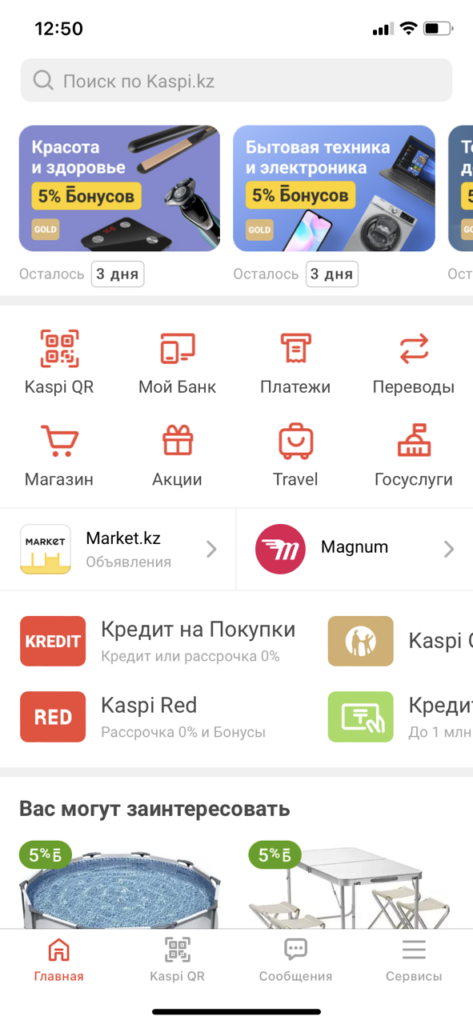
Figure 6: Kaspi QR code in retail and a photo from our visit to a Kaspi branch

Source: Vergent Asset Management

Figure 7: Kaspi.Kz app interface

Source: Vergent Asset Management, Kaspi.kz

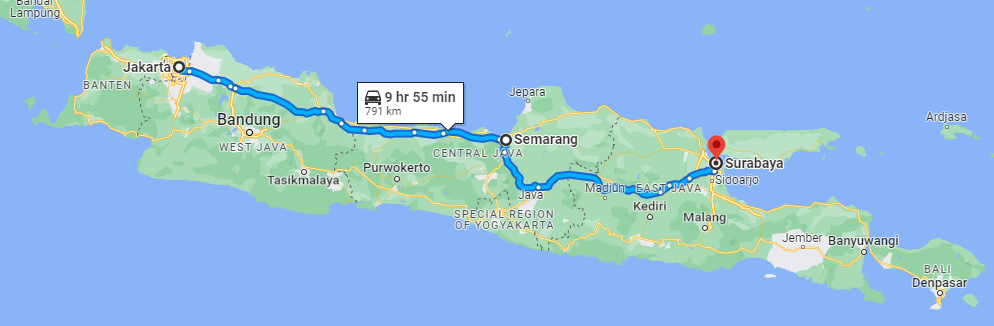
Later in the month, we made our way to Indonesia where we spent four days between Jakarta, Semarang, and Surabaya.

Figure 8: journey from Jakarta to Surabaya via Semarang

Google map showing the driving distance between Jakarta and Surabaya (791 km = about 9 hours & 55 minutes).
Source: Google Maps

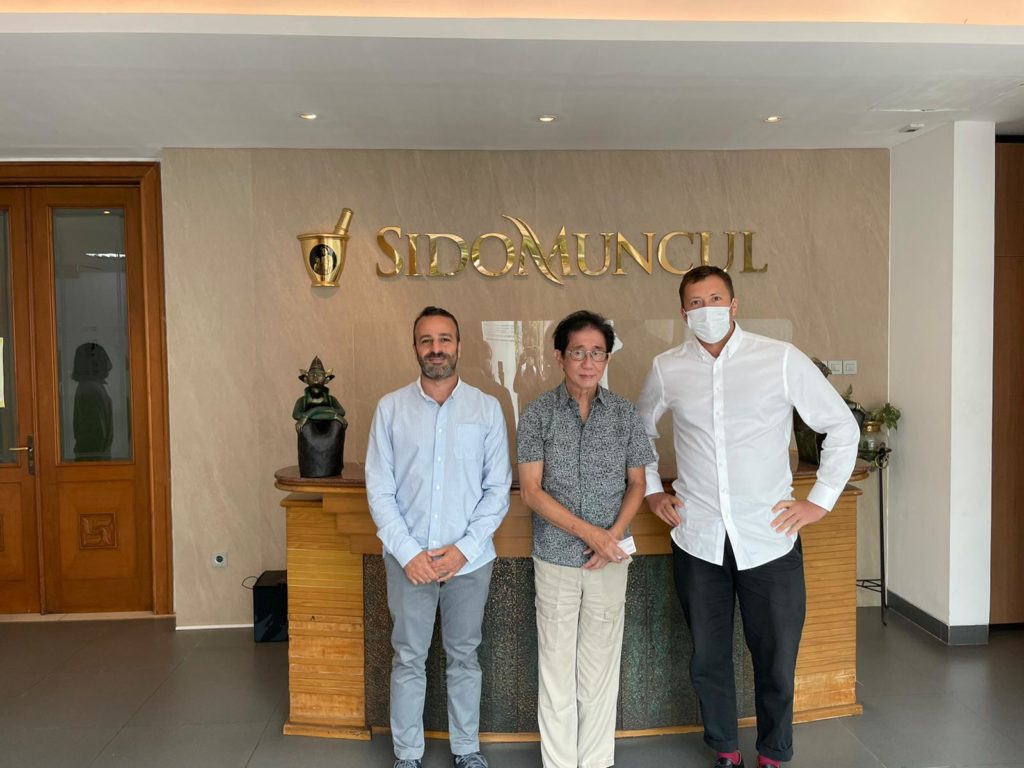
We met with several companies including Sido Muncul, a business we have written about extensively in the past. While we had previously visited with the company, this was the first trip to their manufacturing facilities in Semarang, in Central Java.

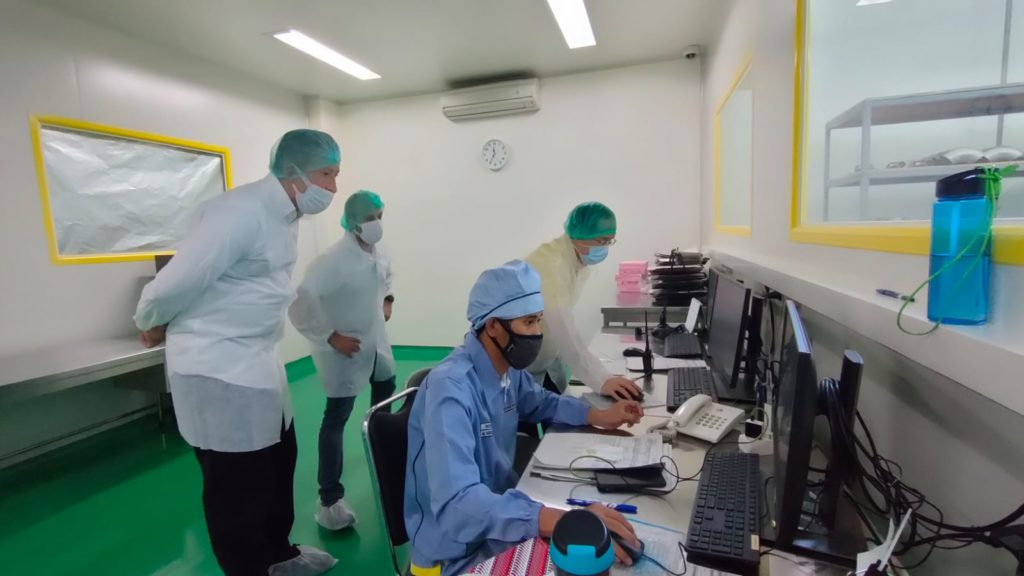
What stood out as soon we entered the Sido Muncul campus was the tranquil atmosphere. The facility is set among lush greenery and the scent of herbs used in production gave the place more of a yoga retreat vibe than a manufacturing facility. We were surprised to see the extent of technological advancement of the manufacturing process, given that the reins are still held by the founding family and that the primary formulation dates back to a recipe first recorded by the founding grandmother in the 1940s.

The company’s new facilities all run off a single dashboard and the German-made machinery does the rest. Production efficiency is critical to optimising yields, which leads to higher per ton values, more sales, and higher margins. While the Tolak Angin brand remains the biggest moat of the company in our view, the complications of sustainably sourcing over 900 herbs from local farmers, scaled manufacturing process, and wide distribution reach reinforce Sido’s dominance in the market. With margins that exceed Coca-Cola’s, Sido is a cash machine that still manages to grow in the low to mid-teens. Investors have long called Sido a single product company, and to a large extent it is. However, our view is this single product is extremely valuable and has a much longer growth runway than the market gives it credit for.

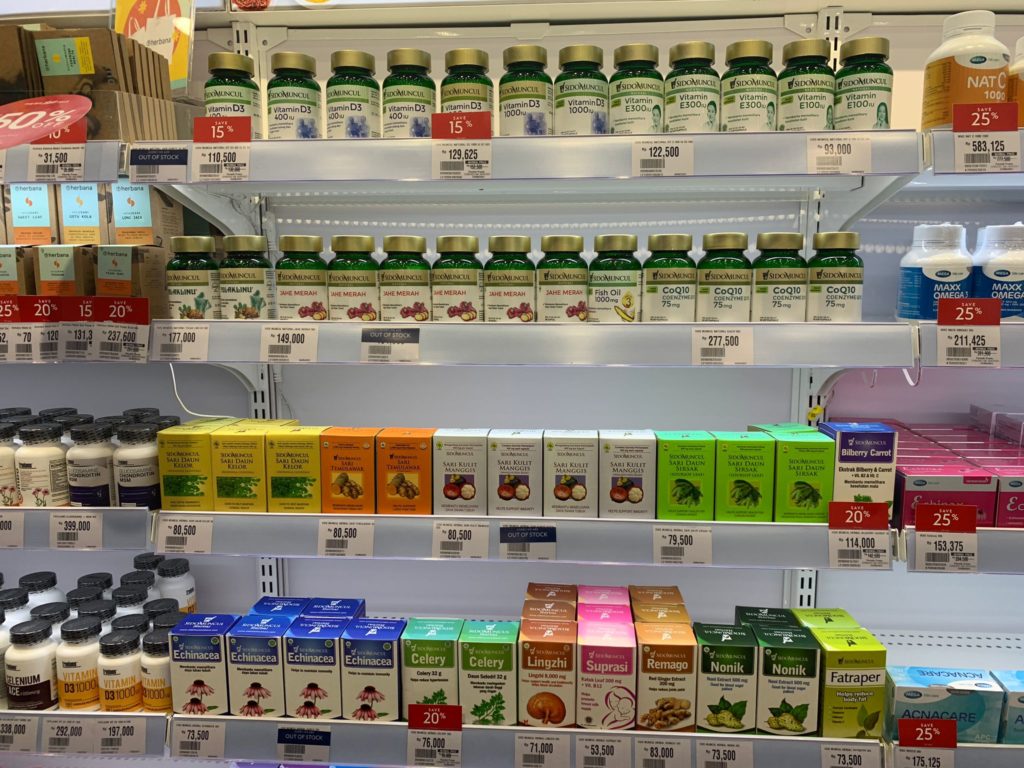
In addition, management’s focus on innovation and new product development can support growth beyond Tolak Angin; our channel checks in retail showed that Sido is becoming a force to be reckoned with in the supplements and vitamins category. Those new products will take time to contribute given the growth of the core Tolak Angin product but are all positive steps that reinforce brand value and set up premiumisation routes for years to come.

We also came away impressed with Sido’s sustainability initiatives:  herbal waste now produces ~40% of the plant’s energy requirements and investment in solar panels is visible on plant rooftops. For a traditional herbal medicine company, Sido is progressive and modern. As a consumer company, it stands out due to its low input FX requirements, limited global raw material exposure, and strong pricing power.

Figure 9: Vergent team touring parts of the plant with Sido’s Head of Manufacturing

Source: Vergent Asset Management, Sido Muncul

Figure 10: photo op with Mr. Irwan Hidayat, major shareholder and 3rd generation of the founding family of Sido Muncul

Source: Vergent Asset Management, Sido Muncul

Figure 11: Sido supplement and vitamin products in retail

Source: Vergent Asset Management

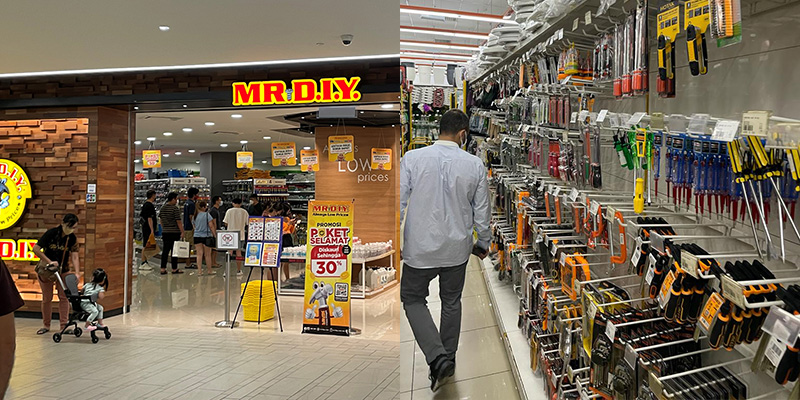
Our final stop was in Malaysia where we spent time with Mr DIY’s management team in Kuala Lumpur. MR.DIY is a leading multi-price point retailer with 947 stores across Malaysia. Given its name, many market participants describe it and benchmark it as a home improvement retailer. We are puzzled by that confusion as the store format, average ticket size, and pricing strategy all point to MR.DIY being more of a dollar store or fixed low-price retailer (similar to  Dollar General, Family Dollar, and Dollarama). The MR.DIY store is typically about 10k square feet in size, carries 18k SKUs of fast moving non-grocery items with a focus on home, garden, hardware, and electrical. Like LabelVie, MR.DIY seems to have gotten the formula down: low prices, assortment, and locational convenience underpin their customer proposition and their attractive unit economics (payback periods of around 2 years).

The company is data-driven and uses a scientific approach to inventory management, which leads to an iterative and more efficient process over time. The company rewards its staff by distributing the excess of targeted level of margin per store. This incentive program naturally drives efficiencies and allows for more margin to be invested back into low prices. Staff are collectively incentivized to keep the stores in tip top shape. Online risk appears to be low due to the nascence of the e-commerce infrastructure at the price point that Mr.DIY clears at. The experience of Dollarama in Canada suggests that the online threat can be managed and we think Malaysia is years behind Canada in terms e-commerce penetration. Consumers may shop for electronics online, but will buy low value daily items from MR.DIY or competing store that can offer similar value. Furthermore, it is easy to see how one would leave the store buying much more than initially planned. The plethora of ‘things you didn’t know you needed until you saw them’ at very low prices is astounding.

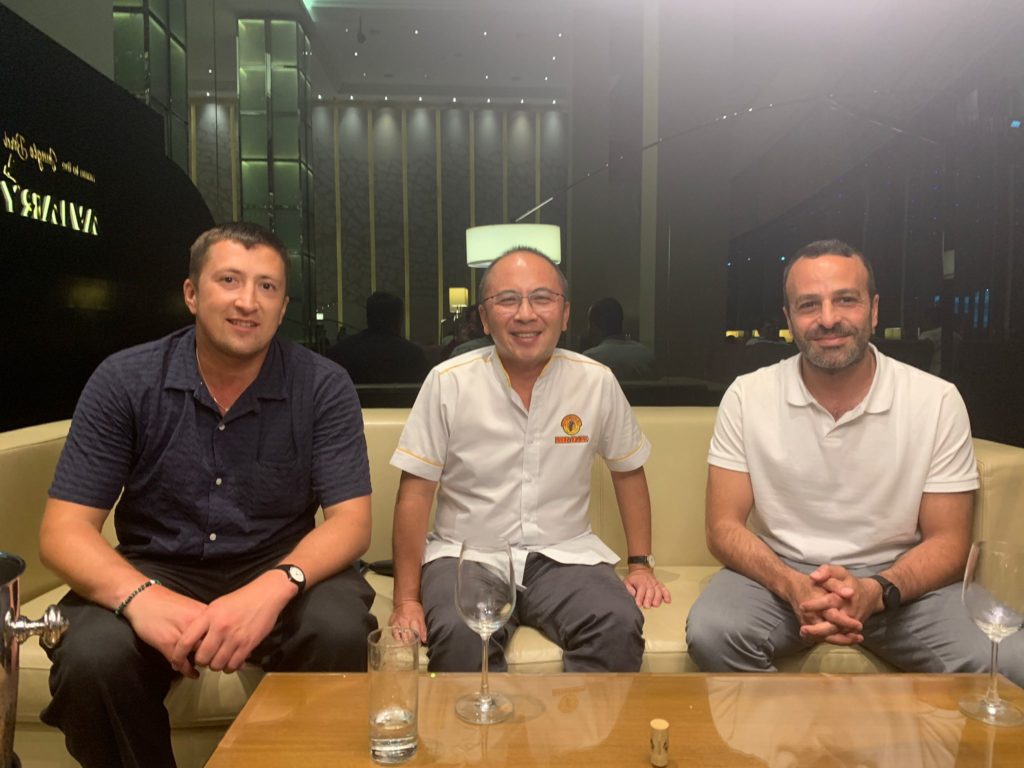
On the ground, we observed how busy the stores are and the wide range of customers they serve, including families, young couples, and tradesmen depending on the time of the day and the location of the store. To our surprise, we saw many copycat stores that use the MR.DIY colour scheme as we drove outside Kuala Lumpur, a positive signal for the brand in our view. Like many of our portfolio companies, MR.DIY is majority founder/operator owned. Unlike all of our companies however, the founder, Mr Tan Yu Ye (YY), rarely meets investors and instead the company’s CEO Adrian Ong is given corporate and finance responsibilities while YY focuses on operations. Adrian owns 0.6% of MR.DIY (~$25 million) and is a former private equity executive who has a very good handle on the numbers and the business. This split of responsibilities is unusual but not necessarily bad for the business as each individual focuses on their areas of strength. Our investment thesis on MR.DIY was reinforced by what we observed on the ground and the strong unit economics of the business, which we will receive a boost from the reopening of Malaysia’s economy and the easing of global supply chain stresses in recent months.

Figure 12:  Front of a busy MR.DIY store in Kuala Lumpur (left) and our team inspecting the aisles (right)

Source: Vergent Asset Management

Figure 13: Vergent team with Mr. Adrian Ong, CEO of MR.DIY

Source: Vergent Asset Management

As markets adjust to the new economic realities, we see a strong opportunity set emerging for the strategy. We believe that choppy and volatile markets offer fertile ground for fundamental stock pickers. A few of our portfolio companies also stand to benefit from this environment as their competition weakens and their bargaining position strengthens. While risks are elevated, valuations in certain areas are starting to more than bake in these risks and we are gradually and selectively rebuilding exposure in our favourite businesses.

Vergent Asset Management LLP