CALGARY, AB, May 23, 2025 – Oakcreek Golf & Turf LP (“Oakcreek”), a leading distributor of Toro commercial turf equipment, today announced the acquisition of L.L. Johnson Distributing Company, Inc. (“LL Johnson”) and Midwest Turf & Irrigation (“Midwest Turf”), which together represent substantially all of the assets of Pattlen Enterprises, Inc. Terms of the transaction were not disclosed.
For 50 years, LL Johnson in Denver, Colorado and Midwest Turf in Omaha, Nebraska, have been recognized as leading distributors of commercial turf maintenance and irrigation equipment, systems and parts to customers located across the US Rockies and Midwest. They are distributors of Toro equipment, along with a broad selection of equipment and solutions from other leading manufacturers. These products serve a variety of end markets including golf courses, sports complexes and stadiums, municipalities and other commercial and residential uses.
“We are excited to welcome LL Johnson and Midwest Turf into the Oakcreek family,” said Patrick Nolan, CEO of Oakcreek Golf & Turf LP. “Their industry knowledge, customer relationships, and talented team are a perfect fit with our long-term vision of becoming a best-in-class distributor to our OEM partners. Together, we look forward to delivering even greater value to our customers.”
“I’m very pleased to see our business, built over many decades by an exceptional team, being acquired by Oakcreek,” Jim Johnson, CEO of Pattlen Enterprises, Inc. said. “Oakcreek’s customer-first mentality aligns perfectly with our own. I’m confident that this partnership will lead to continued success for the decades ahead.”
Simon Gélinas, Managing Director at Banyan Capital Partners, said, “Jim has built a wonderful business in LL Johnson and Midwest Turf and we are privileged to support the next phase of its journey. Banyan is committed to building industry leaders and we believe this is an ideal fit.”
LL Johnson and Midwest Turf will continue to operate under their existing names, ensuring a smooth transition for employees, customers and partners. The integration process is expected to be completed over the coming months, with a focus on maintaining continuity and strengthening our collective offering.
About Pattlen Enterprises, Inc.
Pattlen Enterprises, Inc. is a full-service distributor of Toro commercial equipment, comprising two entities: LL Johnson in Denver, Colorado and Midwest Turf in Omaha, Nebraska.
Denver-based LL Johnson (formerly named Barteldes Seed Company) was founded by Leonard and Patt Johnson in 1976. Soon after, Omaha-based Midwest Turf & Irrigation (formerly Midwest Toro) was added in the fall of 1980. These two distributorships then combined under the corporate name of Pattlen Enterprises. In 2005, Leonard’s son James purchased the company.
About Oakcreek Golf & Turf LP
Oakcreek Golf & Turf LP is Western Canada’s full-service distributor of Toro Commercial Turf Care Equipment, Toro Golf Irrigation Equipment, Yamaha Golf Cars and Kässbohrer (PistenBully) snow grooming equipment. Oakcreek’s head office is in Calgary, Alberta and has facilities across Western Canada. In 2017, Oakcreek expanded its coverage into the southwestern United States with the acquisition of Simpson Norton Corporation, based in Phoenix, Arizona. Oakcreek is owned by Banyan Capital Partners, a Canadian private equity firm, and its senior management team. www.oakcreekgolf.com
About Banyan Capital Partners
Founded in 1998 and under current management since 2008, Banyan Capital Partners is a Canadian-based private equity firm that makes equity investments in middle-market businesses throughout North America. Through a long-term investment approach, Banyan has developed into one of Canada’s leading middle-market private equity firms with an established track record of success in providing full or partial liquidity to founders, families and entrepreneurs and helping them take their business to the next level. For more information, please visit banyancapitalpartners.com.
Banyan is part of Connor, Clark & Lunn Financial Group Ltd., an independent, employee-owned, multi-boutique asset management firm with over 40 years of history and offices across Canada and in the US, the UK and India. Collectively managing over CAD142 billion in assets, CC&L Financial Group and its affiliate firms offer a diverse range of traditional and alternative investment products and solutions to institutional, high-net-worth and retail clients. For more information, please visit cclgroup.com.
Media Contact
Banyan Capital Partners
Simon Gélinas
Managing Director
Banyan Capital Partners
(416) 291-0029
[email protected]


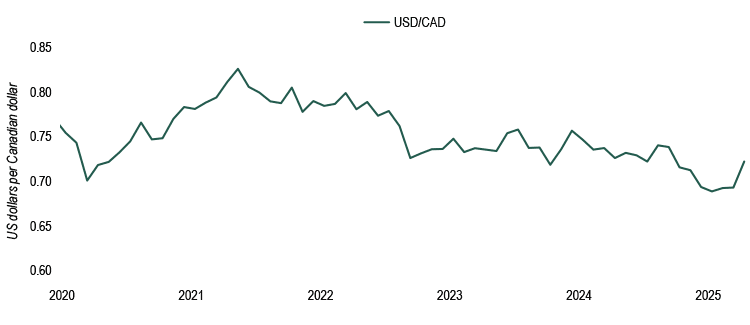
 Source: Bank of Canada
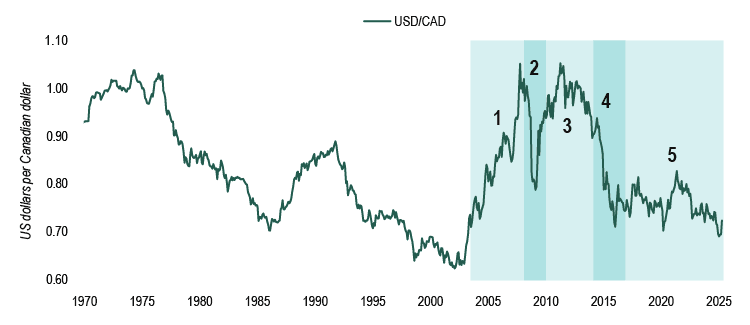