Chinese money / credit trends remain weak but could be at a turning point.

Six-month rates of change of broad money and total social financing have stabilised above June lows – see chart 1. (Broad money here refers to M2 excluding money holdings of financial institutions, which are volatile and less informative about economic prospects.)

Chart 1

Chart 1 showing China Nominal GDP & Money / Social Financing (% 6m)

Narrow money is contracting at a record pace but has been distorted by regulatory changes in April that have reduced the attractiveness of demand deposits, resulting in enterprises shifting into time deposits and money substitutes while repaying some short-term bank borrowing. (The “true M1” measure shown adds household demand deposits to the published M1 aggregate to align with international monetary convention.)

Chart 2 compares six-month rates of change of the raw narrow money series and two adjusted measures. The first assumes that the share of demand deposits in total bank deposits of non-financial enterprises would have remained at its March level in the absence of the regulatory changes. The second additionally adds the inflow to instant-access wealth management products (WMPs) since end-March (data sourced from CICC), on the assumption that this represents a transfer from demand deposits. Six-month momentum of the latter measure was similar in July to the series low reached at end-2014.

Chart 2

Chart 2 showing China Narrow Money (% 6m)

A key reason for expecting money / credit reacceleration is that the yen rally has relieved pressure on the RMB, easing monetary conditions directly and opening up space for further PBoC policy action. The balance of payments turnaround is confirmed by a swing in the banking system’s net f/x transactions, including forwards, from sales of $58 billion in July to purchases of $10 billion in August. This series captures covert intervention via state banks (h/t Brad Setser) and an August reversal had been suggested by a sharp narrowing of the forward discount on the offshore RMB, which has remained lower so far in September – chart 3.

Chart 3

Chart 3 showing China Net F/x Settlement by Banks Adjusted for Forwards ($ bn) & Forward Premium / Discount on Offshore RMB (%)

Actual and expected monetary easing has been reflected in a further steepening of the yield curve, which has correlated with, and sometimes led, money momentum historically – chart 4.

Chart 4

Chart 4 showing China Broad Money (% 6m) & Yield Curve Slope

An easing of Chinese monetary conditions coupled with the start of a Fed rate-cutting cycle could have a powerful monetary impact in Hong Kong, where six-month momentum of local-currency M1 recently returned to positive territory, having reached its weakest level since the Asian crisis in October 2022 – chart 5.

Chart 5

Chart 5 showing China & Hong Kong Narrow Money (% 6m)

White electric cars charging on a city street.

After delaying the inevitable, it’s finally time to upgrade the family car. Now you’re wondering whether to switch to an electric vehicle (EV) or plug in hybrid (PHEV) or stick to the traditional internal combustion engine (ICE) vehicle?

The answer varies by region. In key markets like China, Europe and the United States, the penetration for new EV or hybrid sales ranges from 10.4% to 51%. China leads with over twice the penetration levels of Europe and five times that of the US.

Figure 1 – Global plug-in sales in key markets

GACM_COMM_2024-09-19_Chart01

Source: Autodata, CPCA, CAAM, KBA, CCFA, OFV, Macquarie Research, August 2024; *Sales in France, Germany, UK, Italy, Norway, and Sweden comprise around 80% of the total European sales


A survey conducted by McKinsey found that 49% of current EV owners in Europe and 46% in the US are likely to switch back to an ICE vehicle due to the lack of public infrastructure and the high total ownership cost. In China, only 28% of current EV owners are considering switching back.

Chinese citizens have made their decision and it’s clear to us where the trend is heading. As of July 2024, China has surpassed the 50% mark for new vehicles purchases being EV or hybrids. Some might find it surprising considering the penetration was closer to 10% during early 2021, according to Macquarie Research.

Figure 2 – China vehicles sales volume

GACM_COMM_2024-09-19_Chart02

Source: Macquarie Research


The penetration trend is attributed to government support. The Chinese government unveiled a 520B yuan ($72.3B) package of tax breaks over 4 years for EVs. From 2024-2025 all new EVs purchased will be tax-exempt and during 2026-2027 the tax exemption will be reduced by half.

A company well position to benefit from the transition from ICE vehicles to EV or PHEV in China is Hongfa Technology (600885 CH). Hongfa is the largest relay manufacturer, with 40% share of the global market in the high volt direct current (HVDC) segment (70% in its domestic market). Hongfa supplies HVDC relays to most major EV original equipment manufacturers, including Tesla, Volkswagen and BYD.

Unlike ICE vehicles that adopt 12-48V electrical systems, EVs typically operate at over 200V requiring greater reliability, insulation, durability under high voltage, large currents, high temperatures and the ability to extinguish electric arcs.

A typical EV requires 5-8 units of HVDC relay including 2 main relays, 1 pre-charge relay, 2 normal charging relays, 2 fast-charging relays (not required for PHEV) and 1 auxiliary relay. Average content per vehicle ranges from RMB750-1,250 for battery electric vehicles (BEV) and RMB500-850 for PHEV.
Figure 3 – HVDC relay in electric vehicles

GACM_COMM_2024-09-19_Chart03

Source: Hongfa Technologies, BofA Global Research


 The growing demand for relays is driven by three factors:

  1. EVs require a higher content per vehicles when it comes to relays.
  2. EVs require special relays to handle the arcs, which has a higher price point.
  3. EV manufacturers transitioning from 400V to 800V infrastructure (+30% relays vs 400V).

The competitive advantage comes from three main factors:

  1. Lowest cost manufacturer due to scale and vertical integration.
  2. High quality, with a customer complaint rate of ceramic high-voltage DC relays being less than 0.5 ppm.
  3. Stickiness, as relays approved for car builds are not interchangeable due to third-party verified regulations. Hongfa works with EV makers during the design phase, 3 to 5 years before launch.

We believe the company will greatly benefit from the transition to EVs and is well-positioned to thrive within its market, given its leading position, high-quality products and growing demand for HVDC relays.

Palacio de Bellas Artes building in Mexico City's downtown at twilight.

The recent push by Mexico’s ruling Morena Party to undermine the country’s judiciary is a perfect example of why relying on company fundamentals alone in emerging markets can leave investors exposed to being whipsawed by macro factors.

We covered election risks across EM In July – Political risks in EM spike as Indian, South African and Mexican elections surprise – and flagged that outgoing president AMLO and president-elect Claudia Sheinbaum threaten to undermine Mexico’s institutional quality through a series of regressive reforms. The most damaging of these is the proposal to overhaul the country’s judicial system through having all judges elected by popular vote, along with relaxing the term limits and age/experience hurdles for Supreme Court justices.

As the Financial Times put it in September (FT: Mexico’s retrograde path on the rule of law):

Mexico is barrelling ahead with one of the world’s most radical shake-ups of a legal system, alarming investors and citizens alike. In his final month in office, President Andrés Manuel López Obrador is using his coalition’s congressional supermajority to ram through constitutional changes to change the entire supreme court and several thousand state, federal and appeal court judges with replacements elected by popular vote. Candidates for some posts will need only a law degree, five years of undefined “legal experience” and a letter of recommendation from anyone in order to run.

 Lawmakers have been on strike in recent months protesting the move, but to no avail. In September, Morena wielded supermajorities in both the lower house and Senate to push the reform through, which will see thousands of judicial positions up for election over the next three years. Rather than officials working their way up the legal hierarchy, the judiciary will now be exposed to the corruption, bribery and intimidation of Mexico’s cartels, according to critics.

Snatching defeat from the jaws of victory

Mexico should be in prime position to benefit from supply chain reshoring following the pandemic and ratcheting-up of the Sino-US dispute. Indeed, FDI (much of it from China – Why Chinese Companies Are Investing Billions in Mexico – The New York Times (nytimes.com) was pouring into the country to pursue a bright trade story. We saw this in the sharp appreciation of the Mexican peso and a bull market in Mexican equities through 2023 (MSCI Mexico up 42% in USD terms) with the market a favourite among foreign investors.

US imports from Mexico have outpaced imports from the rest of the world
US imports, index Jan. 2017 = 100

US and world imports from Mexico from 2017 to 2024 based on data from GBM Nearshoring Barometer.

Source: GBM Nearshoring Barometer, August 2024.


Mexico a favourite for foreign equity investors through 2023

Global Emerging Markets active versus passive country allocations from 2022 to 2024 based on data from EPFR.

Source: EPFR


 Sentiment soured on deterioration in the political outlook as Morena’s dominant performance in Mexican elections in June emboldened the party to pursue a series of regressive policies. As we noted in June:

Investors fear that a strengthened mandate will allow Sheinbaum (or even an outgoing AMLO) to undermine judicial independence and pursue plans to eliminate autonomous government agencies overseeing telecoms, energy and access to information, as well as weaken electoral supervisory bodies.

Currency overvaluation correcting in Mexico and Brazil
Real broad effective exchange rates, % deviation from 5y ma

Real broad effective exchange rates deviation in percentage from 2015 to 2014 based on data from NS Partners and LSEG Datastream.

Source: NS Partners and LSEG Datastream


From being one of the consensus overweights among EM investors last year, Mexican equities have been hammered in 2024. MSCI Mexico is down 21% in USD terms to mid-September, while the broader index is up 7%.

MSCI Mexico and MSCI Index based on data from Bloomberg.

Source: Bloomberg


Losing the FDI beauty pageant

As one trade official explained to us on a recent research trip in India, competing for FDI is a beauty contest where participants must maximise their appeal relative to their competition to attract those seeking to deploy capital. China’s retrogressive turn to favour state-owned enterprises rather than the entrepreneurs that fuelled its economy’s meteoric rise is a golden opportunity for ambitious leaders in other emerging markets to step up and attract capital and supercharge development. We are seeing this across ASEAN and in India, eastern Europe and the GCC.

But none have Mexico’s advantage of geographic proximity to an economic juggernaut in the US. President-elect Sheinbaum has talked up Mexico’s nearshoring potential and support for private investment in recent months. However, the rhetoric belies an agenda to undermine Mexico’s institutions, which has unnerved key trade partners and investors.

Nothing scares investors and compromises progress up the development ladder more than attacks on key institutions such as the judiciary. In August, the US Chamber of Commerce warned the Mexican government that the reforms would be likely jeopardise trade relations:

 “The U.S. Chamber of Commerce respectfully calls on the sovereign Government of Mexico to continue deliberations with the private sector, academics and legal experts on the package of reforms the new Mexican Congress intends to consider in September. This dialogue is essential to ensure that the proposed reforms contribute to strengthening the rule of law and conditions for economic growth in Mexico.

 Given our longstanding commitment to Mexico’s growth and prosperity, the U.S. business community is an important stakeholder in the reform process. American companies represent by far the largest source of foreign direct investment in Mexico and provide good jobs to millions of Mexicans. Whether operating in the U.S., Mexico or anywhere else in the world, American businesses depend on respect for the rule of law as the foundation of a vibrant investment climate, sustainable development, and job creation.

 While there is a broad consensus about the need to strengthen Mexico’s judicial system, we strongly believe that certain constitutional and legal reforms currently proposed by the Mexican government – in particular, the judicial reform and the proposed elimination of independent regulatory agencies – risk undermining the rule of law and the guarantees of protection for business operations in Mexico, including the minimum standard of treatment under the U.S.-Mexico-Canada Agreement. The reforms also put at risk Mexico’s obligations under other international treaties to provide all with the right to a competent, independent, and impartial judicial system.

 Further deliberation to address these concerns is needed to avoid jeopardizing the incoming Mexican government’s ability to generate shared prosperity and to tap into the potential of nearshoring to strengthen the country’s economic growth and development.”

Macro matters – downgrading Mexico

Our process involves scoring the level of team conviction for every emerging market each month and includes an assessment of the direction of travel for politics in the short run and institutional quality in the long run. The trajectory is negative on both counts, and we think souring sentiment could have some way to run.

We have been underweight and defensively positioned in Mexico for well over a year, on a view that a slowing US economy would be an economic drag for Mexico. The deteriorating political backdrop flows through to a downgrade of our conviction rating for Mexico, and consequently a reduction in exposure. The market is already trading at a significant valuation discount to the 10-year average, but we think it can get cheaper still.

Portfolio activity

We sold our defensive staple Walmex last month, in favour of shale oil producer Vista Energy. While listed in Mexico, Vista is actually an Argentinian company boasting a growing production profile. Its shale assets in the Vaca Muerta (Spanish for Dead Cow) geologic formation are some of the best in the world. In contrast to Mexico, there are also some signs that the political backdrop in Argentina is improving under libertarian president Javier Milei, including efforts to deregulate the oil and gas sector which could provide an additional tailwind for Vista.

The race is on

As Mexico falters, we expect competition to reap the fruits of reshoring to heat up. ASEAN, the GCC and India are all banging on the door for foreign investment flows. Political stability, as well as safeguarding and improving institutional quality, will be the keys to success.

Monetary considerations argue that the ECB’s latest inflation forecast, like earlier projections, will be undershot.

Annual growth of broad money – as measured by non-financial M3 – returned to its pre-pandemic (i.e. 2015-19) average of 4.8% in October 2022. Allowing for a typical two-year lead, this suggested that annual CPI inflation would return to about 2% in late 2024 – see chart 1. The August reading was 2.1% (ECB seasonally-adjusted measure).

Chart 1

Chart 1 showing Eurozone Consumer Prices & Broad Money (% yoy)

The ECB staff forecast in December 2022 was more pessimistic, projecting annual inflation of 3.3% in Q4 2024. The forecast for that quarter was still up at 2.9% in June 2023 after natural gas prices had collapsed.

Annual broad money growth continued to plunge in 2023, reaching a low just above zero in November, since recovering to a paltry 2.5%. Simplistic monetarism, therefore, suggests that inflation will move below target in 2025 and remain there into 2026 – chart 2.

Chart 2

Chart 2 showing Eurozone Consumer Prices & Broad Money (% yoy)

The September 2024 ECB staff forecast, by contrast, shows inflation rising in Q4 and remaining above 2% until Q4 2025.

The monetarist relationship, taken at face value, implies a period of annual price deflation in H2 2025 / H1 2026. The judgement here is to downplay this possibility and regard the current monetary signal as directional rather than giving strong guidance about levels.

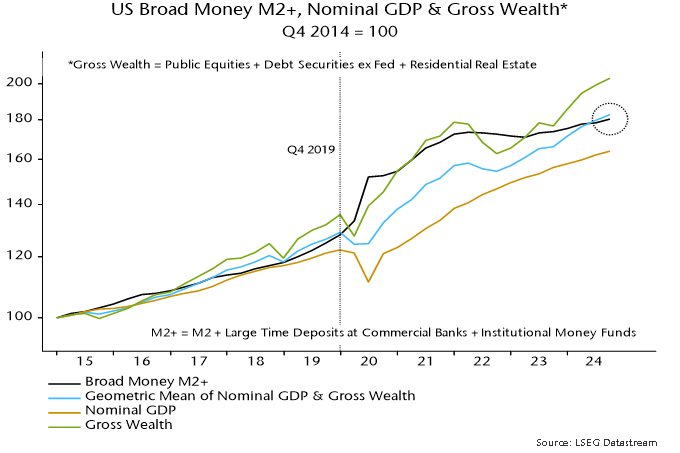
It is possible that the stock of money is still above an “equilibrium” level relative to nominal GDP. The current ratio is below its 2000-19 trend but in line with the 2010-19 trend, and higher than at end-2019 – chart 3. There may still be “excess” money to act as a deflation cushion.

Chart 3

Chart 3 showing Eurozone Broad Money* as % of Nominal GDP *Non-Financial M3

The forecast of a target undershoot requires services inflation – an annual 4.2% in August – to break lower. The price expectations balance in the EU services survey has displayed a (loose) leading relationship with annual services inflation historically, with the current reading consistent with a move down to about 2.5% in H1 2025 – chart 4.

Chart 4

Chart 4 showing Eurozone Services CPI (% yoy) & EU Commission Services Survey Price Expectations Balance

Engineer checking and walking through a stack of industrial pipes at a construction site.

Decarbonization continues in parts of the world, although there is a long way to go. Ongoing use of coal amid rising energy demand somewhat negates the transition to natural gas and/or the implementation of carbon capture technologies. On average, coal-fired power plants emit about 2.2 to 2.5 tons of CO2 per megawatt-hour (MWh) of electricity produced. By contrast, natural gas-fired power plants emit about 0.4 to 0.5 tons of CO2 per MWh.

But the good news is that we are making strides in other areas. Consider green steel.

Traditional steelmaking emits approximately 3 billion tons of CO2, mostly from smelting which turns iron ore into steel. This process is very energy intensive and is a top-3 CO2 emitter, with electricity production at number one and cement number two. However, metallurgical processes to turn iron ore into steel are now converting from traditional furnace smelters, which emit 2 tons of CO2, to low-energy Electric Arc Furnaces (EAF), which emit 0.5 tons per ton of steel.

Historically, new metallurgical processes have been difficult to scale. Fortunately, the steel industry, as it moves towards greener production methods, has been borrowing proven technology from its aluminum counterparts. EAF today play a crucial role in the global steel industry, with around 2,500 to 3,000 units in operation and a combined capacity of approximately 500 to 600 million tons per year. The share of EAFs in global steel production is around 5% and growing, reflecting their expanding importance in the industry and in a (slowly) decarbonizing world.

Major steel-producing regions like North America, Europe, China, and India are enhancing their EAF capacities to improve sustainability and reduce carbon emissions. Recent EAF investments include Nucor, $2.7 billion for 3 million tons of steel in 2024, and Steel Dynamics, $1.9 billion for 3 million tons in 2024. Cleveland Cliff, Arcelor and Gerdau are also transforming to EAF.

Transforming the entire supply chain will produce green steel, which represents a transformative shift in the steel industry towards significantly reduced CO2 emissions and more sustainable practices. Key technologies in this greening process include hydrogen-based steelmaking, EAFs powered by renewable energy, and advanced methods like molten oxide electrolysis. While there are challenges, including high costs and technical feasibility, green steel holds promise for a more sustainable future in steel production.

One company benefiting from EAF is Australian-based iron ore producer Champion Minerals (CIA:AU). By acquiring a distressed Canadian asset from Cleveland Cliff in 2017, Champion revitalized the asset towards producing over 12 million tons of iron ore per year. This North American asset represents the main value of the company, as it has received over USD$4.8 billion of investments over the years from past and present owners. Its products receive a premium to market, justified by the quality of its iron ore.

Champion has multiple catalysts on the horizon. For example, they are adding transportation links to help reach nameplate production of 16 million tons, and start-up of its EAF material processing facility will soon commence. As well, any further steel tariffs on Chinese steel will help bolster demand for its production, particularly among the new EAF North American steel mills. Indeed, Champion expects its exports to China to decrease from 70% to 30% in the coming years as the firm switches to markets closer to home.

This client diversification has many positive implications for Champion, and savings on cross-ocean transit costs are worth the EAF investment alone. It is important to note that all the electricity used in Champion Minerals operations are from hydropower except for the mobile fleet. It is therefore a definite leader in green steel branding.

There are other methods of reducing CO2 emissions while producing steel. We own a small position in Aperam (Apam.NA), which produces steel from its facilities in Brazil, Belgium and France. Aperam was spun out of ArcelorMittal at the start of 2011. Their Brazilian facility uses charcoal from a series of eucalyptus forests owned and managed by the group, rather than coking coal. Their European facilities use EAF furnaces fed with scrap.

(EAF requires scrap steel, as it is does not work well with high contaminant iron ore. Producers of iron ore have adjusted and are now producing high-quality ore, as well as metal bars instead of contaminated iron powder.)

We are also exposed to EAF in other commodities, specifically copper. The copper market is 10 times smaller than steel, so CO2 headlines have been less prolific. Yet copper CO2 emissions are still fairly elevated, at 3 tons of CO2 per ton.

Aurubis AG (NDA.GY) is a leading global provider of non-ferrous metals, particularly copper, and it operates several key assets and facilities across the globe. The company’s assets include smelting and refining facilities in Germany, Bulgaria and Finland. The Helsinki and Luebeck facility are flash smelting furnaces, which emit around 1.5 to 2.5 tons of CO2 per ton of copper produced. This is lower compared to traditional furnaces. Aurubis also operates EAF facilities at different production sites.

Aurubis has leading recycling operations in Europe, especially for copper, and it is developing the copper recycling market in North America. The company recently opened a new smelting facility in Richmond, British Columbia.

The days of complete green steel are likely years away, but they are within view. We continue to follow developments in these areas so as to participate in important decarbonization investment themes going forward.

The “double dip” downturn in global manufacturing continued last month.

Global manufacturing PMI new orders fell steeply from a peak in May 2021 to a trough in December 2022 (first dip), with a subsequent recovery ending in May 2024. The second dip was confirmed by a sharp fall to below 50 in July, with the index unchanged in August – see chart 1.

Chart 1

Chart 1 showing Global Manufacturing PMI New Orders & G7 + E7 National Survey New Orders / Output Expectations

As the chart shows, an alternative global indicator based on national surveys weakened further last month.

The alternative indicator implies a shorter interim recovery between the two dips than the PMI, starting from May 2023 and ending in January 2024. These timings align better with turning points in global six-month real narrow money momentum (low in June 2022, high in December 2022) – chart 2.

Chart 2

Chart 2 showing G7 + E7 National Survey New Orders / Output Expectations & Real Narrow Money (% 6m)

The September 2023 low in real money momentum suggests that the double dip will bottom out by end-2024.

A key issue is whether manufacturing weakness will now transfer to services.

Services indicators remain mixed. The global services PMI new business index regained its May high last month and is close to the pre-pandemic average – chart 3.

Chart 3

Chart 3 showing Global PMI New Orders / Business

Order backlogs, however, fell further and are well below the corresponding average, as they are in manufacturing – chart 4. The decline suggests that current output is running above the (increased) level of incoming demand.

Chart 4

Chart 4 showing Global PMI Backlogs of Work

Accordingly, services firms are curbing hiring, with the sector employment index falling sharply in August and almost as weak as in manufacturing – chart 5.

Chart 5

Chart 5 showing Global PMI Employment

Rises in the global services PMI activity and new business indices last month partly reflected further strength in US components. The corresponding measures in the US ISM services survey are weaker, however, especially relative to pre-pandemic averages – chart 6.

Chart 6

Chart 6 showing US Services PMI Business Activity

The PMI surveys continue to support the expectation here of rapid easing of services price pressures and likely inflation undershoots by H1 2025. Output price indices for consumer goods and services remain close to their 2015-19 averages, a period when G7 annual core CPI inflation averaged 1.6% – chart 7.

Chart 7

Chart 7 showing Global Consumer Goods / Services PMI Output Prices

Image rendering of Loblaw's Maple Leaf Gardens

Crestpoint Real Estate Investments Ltd. (Crestpoint) today announced the acquisition of a 50% interest in a three-building portfolio (the Portfolio) from Loblaw Properties Limited and Shoppers Realty Inc. The acquisition transaction was completed as part of a 50/50 joint venture with an affiliate of Choice Properties Real Estate Investment Trust (Choice Properties).

The Portfolio consists of one distribution center and two retail properties. The distribution center is a 711,000 sq. ft. dual load distribution facility located in Mississauga, Ontario. The two retail assets include a 150,000 sq. ft. Real Canadian Superstore in Winnipeg, Manitoba and a strata title interest in the lower floors of 60 Carlton Street in Toronto, Ontario, formerly Maple Leaf Gardens. Originally constructed in 1931, this iconic building was the home arena of the Toronto Maple Leafs until 1999, but now houses 95,000 sq. ft. of retail space including a flagship Loblaws grocery store, an LCBO outlet, a Joe Fresh location and 150 underground parking spaces. Toronto Metropolitan University will retain its ownership of the top level of the property which houses the Mattamy Athletic Centre.

The Portfolio is 100% leased for 15+ years and is backed by Loblaw’s and Shoppers’ investment grade credit parent company, Loblaw Companies Limited. Crestpoint, on behalf of the Crestpoint Core Plus Real Estate Strategy (its open-end fund), entered into this joint venture transaction with Choice Properties (TSX: CHP.UN), Canada’s largest REIT with over 700 properties valued at $16.7 billion and a market cap of ~$10.6 billion.

The closing of this acquisition brings Crestpoint’s total assets under management to $10.4 billion and 38.3 million square feet.

About Crestpoint

Crestpoint Real Estate Investments Ltd. is a commercial real estate investment manager dedicated to providing investors with direct access to a diversified portfolio of commercial real estate assets. Crestpoint is part of the Connor, Clark & Lunn Financial Group, a multi-boutique asset management company that provides investment management products and services to institutional and high net-worth clients. With offices in Canada, the US, the UK and India, Connor, Clark & Lunn Financial Group and its affiliates collectively manage approximately $133 billion in assets. For more information, please visit: www.crestpoint.ca.

Contact

Elizabeth Steele
Director, Client Relations
Crestpoint Real Estate Investments Ltd.
(416) 304-8743
[email protected]

Smiling Asian woman using her smartphone near a window with blinds in living room at home.

When global investors think of opportunities in Taiwan, the first thought that often comes to mind is its technology sector, particularly its world-leading semiconductor cluster. This tendency is understandable given that the semiconductor industry is a cornerstone of Taiwan’s economy, directly contributing more than 15% to the nation’s GDP. The relevance of the country’s semiconductor capabilities extends far beyond its borders. Taiwan produces over 60% of the world’s semiconductors, and more than 90% of the most advanced, leading-edge integrated circuits. Most of these advanced chips are manufactured by a single company – Taiwan Semiconductor Manufacturing Corporation (TSMC) – giving it a critical role in the global technology supply chain. From smartphones to most advanced AI accelerators, most of the tech advancements we see today would not be possible without the world leading foundry. Jensen Huang of Nvidia has repeatedly praised the indispensable role of TSMC in driving global innovation.

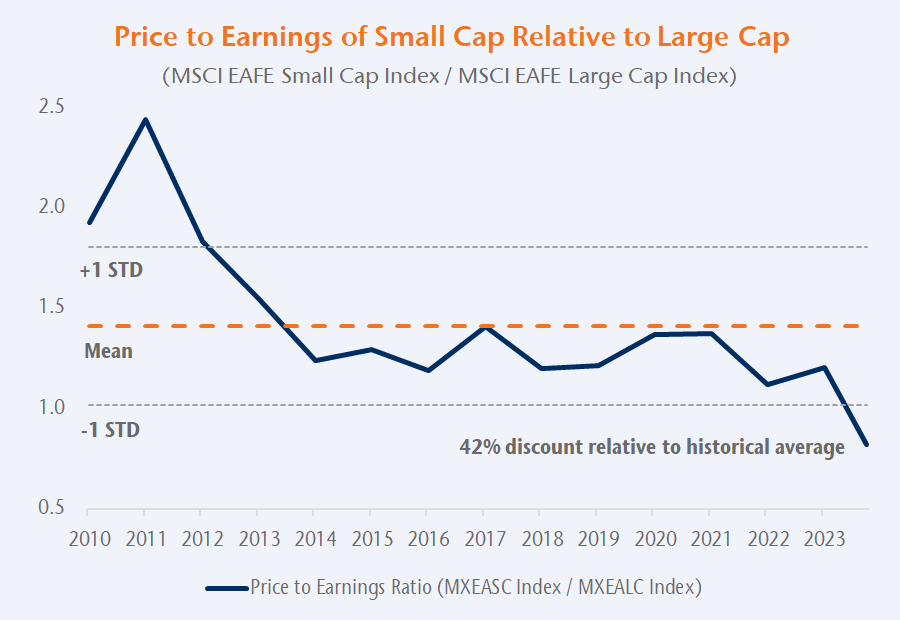
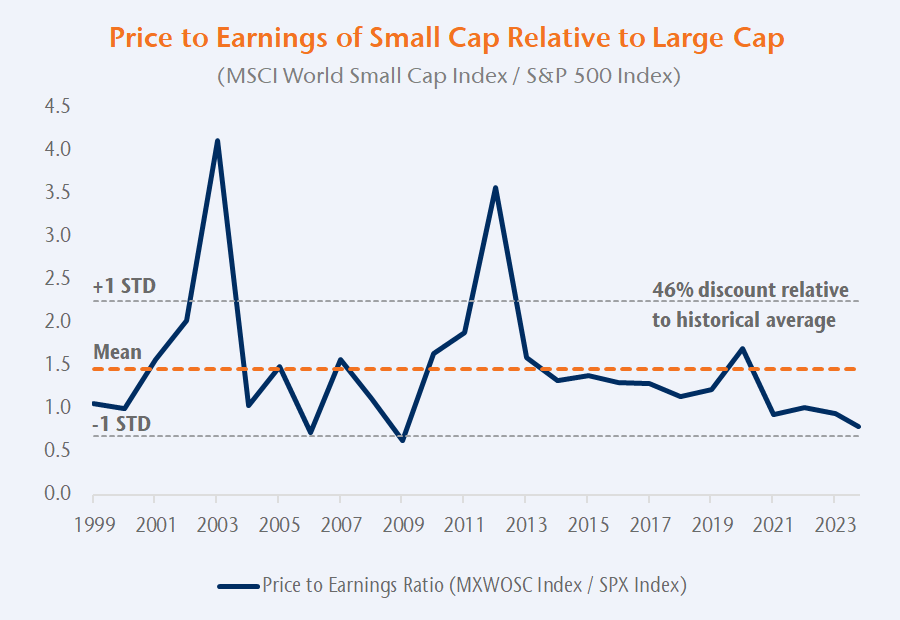
TSMC’s dominance has a significant influence on decisions of investors in emerging markets (EM). As of July 2024, TSMC accounted for 9.3% of the MSCI EM Index, while Taiwan as a whole made up 18.5%. Such concentration can pose challenges for investors who are trying to diversify their portfolios. Being heavily exposed to a single, cyclical company, even one as dominant as TSMC, can increase risk, especially during periods of high market volatility. This is where the benefits of small-cap equities come into play.

We believe that small-cap stocks offer a unique mix of growth potential and diversification. While the MSCI EM Index is heavily weighted toward large-cap tech giants like TSMC, Tencent, Samsung, Alibaba and SK Hynix, the MSCI EM Small Cap Index provides a more balanced exposure. As of July 2024, no single constituent represented more than 0.5% of the total weight. More than 350 companies from Taiwan accounted for 21.4% of the MSCI EM Small Cap Index. This broad distribution reduces the risk associated with any single company, making small-cap equities an attractive choice for those looking to diversify while still tapping into Taiwan’s economic strengths.

Nien Made is a perfect example of the opportunities available in Taiwan beyond the technology sector. Founded in 1974, Nien Made has become one of the world’s largest manufacturers of window coverings, including blinds, shutters and shades. The company has successfully harnessed Taiwan’s advanced manufacturing and commitment to innovation to maintain its global competitive edge. Nien Made has invested heavily in production automation, allowing the company to achieve significant cost efficiencies while upholding the highest quality standards. Nien Made has developed proprietary machines used in its production process, further enhancing its operational efficiency and product consistency. Another key factor in Nien Made’s success is its high level of vertical integration, with 90% of window covering components produced in-house.

Nien Made’s success is also driven by its strong portfolio of brands, each recognized for quality and innovation in the window coverings industry. The company’s flagship brands, including Norman and Veneta, cater to diverse market segments ranging from premium, custom-made products sold primarily through professional designers to more affordable, ready-made options available at big-box retailers like Home Depot and Walmart. These brands have helped Nien Made establish a significant presence in markets across North America, Europe and Asia. Operations outside of Taiwan account for more than 95% of Nien Made’s business, underscoring its global reach.

Innovation is a core element of Nien Made’s growth strategy. The company continuously invests in research and development to enhance its product offering and improve production efficiency. Nien Made has been a pioneer in developing motorized window coverings catering to the growing demand for smart home solutions. These products offer the convenience of automation while preserving the familiar look of traditional window coverings. One of Nien Made’s most significant innovations is the development of cordless window coverings. This initiative was driven by new US regulations aimed at improving child safety by eliminating cords in window coverings, which pose a danger to young children. Nien Made’s proactive response to these regulations not only ensured compliance with safety standards but also strengthened its reputation as an industry leader.

Nien Made’s ability to navigate global challenges has further solidified its market position. The COVID-19 pandemic, geopolitical tensions, rising raw material costs and global supply chain disruptions have all presented significant operating challenges. However, Nien Made’s strategic investments in expanding production capacity in Vietnam, Cambodia, Mexico and the US have enabled it to navigate these challenges, ensuring undisrupted customer satisfaction and product quality and availability.

The company’s commitment to sustainability and corporate responsibility enhances its investment appeal. It has implemented environmentally friendly practices in its manufacturing processes, reducing waste and lowering its carbon footprint.

We appreciate Nien Made’s product quality, competitive lead times, extensive service network, cost advantages and broad client reach. All these factors contribute to its high level of profitability, with net profit margins exceeding 20% and returns on capital ranging from 20% to 30%. Nien Made is run by the second generation of the founding family, who maintain substantial ownership in the company. The management team demonstrates a prudent capital allocation strategy, supported by a strong balance sheet with a net cash position, allowing it to weather economic cycles over time.

For investors looking for opportunities in Taiwan, Nien Made offers a compelling case. While the technology sector remains a major driver of Taiwan’s economy, companies like Nien Made offer a less conventional path to capitalize on the island’s broader success story. With its competitive advantages, clear growth strategy, robust financial position and capable management team, we believe that Nien Made stands out as an attractive investment opportunity.

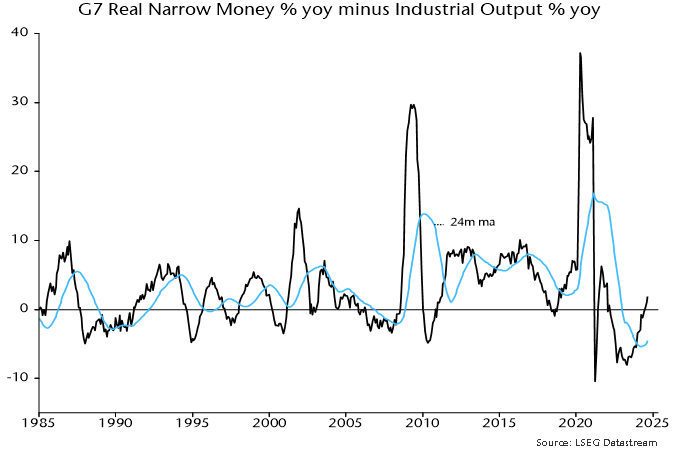
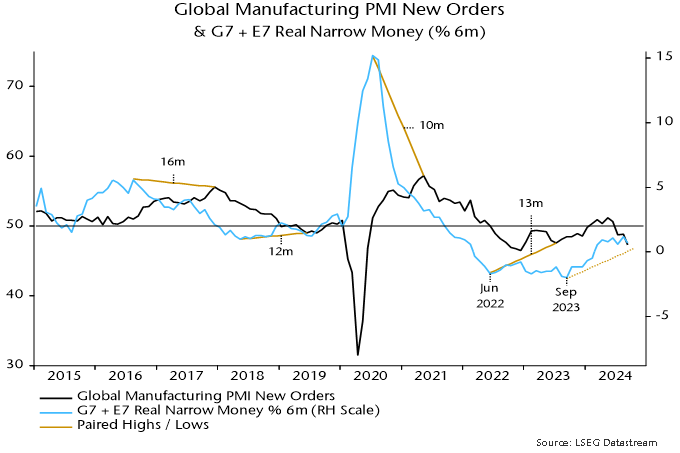
Global six-month real narrow money momentum is estimated to have moved sideways for a fourth month in July at a weak level by historical standards – see chart 1.

Chart 1

Chart 1 showing Global Manufacturing PMI New Orders & G7 + E7 Real Narrow Money (% 6m)

The baseline scenario here remains that global economic momentum – proxied by the global manufacturing PMI new orders index – will move down into late 2024, echoing a fall in real money momentum into September last year. Based on more recent monetary data, a subsequent recovery may prove limited, with weakness persisting well into H1 2025.

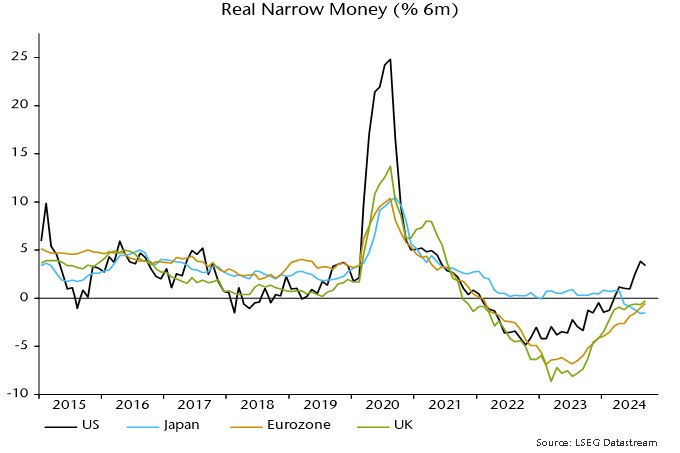
The unchanged July global real money momentum reading conceals a rise in the US offset by further weakness in China. The E7 ex. China component also cooled, while G7 ex. US momentum remained negative, moving sideways – chart 2.

Chart 2

Chart 2 showing Real Narrow Money (% 6m)

The Chinese series incorporates an adjustment* for a recent portfolio shift by non-financial enterprises from demand to time deposits in response to a regulatory change (a clampdown on payment of supplementary interest by banks). Chinese momentum would be significantly more negative without this adjustment, while the global series would be at its weakest level since February. (The adjustment may, however, underestimate the negative distortion to Chinese narrow money.)

Chart 3 shows additional DM detail. Real narrow money momentum is relatively strong in Canada and Australia as well as the US.

Chart 3

Chart 3 showing Real Narrow Money (% 6m)

Japan moved deeper into negative territory but recent weakness partly reflects f/x intervention, so may abate.

Real money momentum is higher in the UK than the Eurozone but the difference is small, with both still negative. Recent UK economic outperformance is unlikely to last.

The pick-up in US real narrow money momentum suggests improving economic prospects but confirmation is required and lags should be respected.

The US July reading was boosted by a favourable base effect – narrow money contracted by 0.6% month-on-month in January. The base effect remains favourable for August but turns significantly negative in September / October.

Six-month growth of US broad money is weaker than for narrow and has edged lower since May, though hasn’t yet fallen to the extent suggested by a contractionary shift in the joint influence of Treasury financing operations and Fed QT, discussed previously. The latest Treasury financing projections imply that this influence will turn expansionary again in Q4.

For perspective, US six-month real narrow money momentum had recovered to the current level in September 2008 as the financial crisis was reaching a crescendo with the recession having nine more months to run. In the prior 2001 recession, the current level was reached three months before the economy hit bottom. In both cases, the NBER business cycle dating committee had yet to determine that a recession had begun.

*The adjustment assumes that the share of demand deposits in total bank deposits of non-financial enterprises would have been stable at its March level in the absence of the regulatory change. The adjustment does not take into account any shift from bank deposits to non-monetary instruments (e.g. wealth management products) or effects on other money-holders.

Aerial top view of skyscraper buildings and roads in Mong Kok district, downtown Hong Kong.

Investors have long been attracted to emerging market equities for their growth potential and unique investment opportunities. However, consideration of emerging market opportunities in fixed income has been less common. You may be surprised by the investment case for emerging markets credit and how an allocation can contribute to portfolio diversification and enhanced returns, as explored in this article.

Emerging markets credit refers to the debt securities issued by corporations and sovereign entities domiciled in emerging economies. The debt is denominated in either the ‘local’ currency of the issuer, or in currency of a developed market, such as the US dollar, which is referred to as external or ‘hard’ currency credit. Like their developed market counterparts, a credit rating is assigned to distinguish between investment grade and non-investment grade (high yield) debt.

Some of the key attributes of emerging markets credit include:

  • Large, diversified asset class: combined market value of emerging market local and external currency sovereign and corporate issuers is greater than the US treasury market.
  • Higher yield: can provide a spread premium over comparably rated, developed market
  • Less levered: borrowers are generally less levered than borrowers in developed markets
    at a similar credit rating.
  • Lower default experience: default experience has been at a lower rate than comparably rated, developed markets
  • Diversification merits: low correlation to developed markets credit due to economic cycles and market dynamics being different from those of developed markets provides diversification benefits.

Size of Market

The size of the emerging markets credit issuance may surprise many investors, especially when including both the local and external currency sovereign and corporate market, which when taken together has a market value greater than US treasuries (Figure 1).

Figure 1 – Major Fixed Income Markets

Major Fixed Income Markets Opportunity Set ($B)
US Treasuries $23,900
Other Developed markets Sovereigns $14,700
Emerging markets local currency sovereigns $11,100
Emerging markets local currency corporates $10,700
US Agency Mortgage Backed Securities $8,400
US Investment Grade $7,800
Emerging markets external currency corporates $2,500
Emerging markets external currency sovereigns $1,500
US High Yield $1,400

Source: JP Morgan


Emerging markets local currency sovereign and corporate credit have the largest market value. From the perspective of the borrower, the issuance of local currency debt recognizes that if a country has significant debt, say in US dollars, and its currency falls relative to the US dollar, the debt becomes more costly to pay back. However, the issuance of external currency debt can help diversify funding sources by allowing the emerging market countries to tap into international capital markets.

From the perspective of an asset manager, the added benefit from investing in emerging markets external currency credit, both sovereign and corporate, is it can help manage the risks associated with local exchange rate fluctuations. Moreover, emerging markets external currency credit is generally governed by New York or UK law, whereas emerging markets local currency credit is subject to the specific laws of the issuing emerging market country. Emerging markets external currency credit also offers a more diversified universe of investment opportunities. The focus of the balance of this article is therefore on emerging markets external currency credit.

Transformation of the Investment Landscape

There has been a significant transformation in the emerging markets credit landscape. In the early 1990s, the indices consisted of just 10 countries and had a heavy bias to Latin American economies. Today, there is a much healthier universe of countries, and unlike the equity market index whose market capitalization is dominated by a small number of countries, the sovereign and corporate credit indices are much more diversified in terms of country representation (Figure 2).

Figure 2 – Emerging Markets Sovereign and Corporate Credit Index

Figure 2 shows the Top 10% of the JP Morgan EMBI Global Diversified Index and the JP Morgan CEMBI Broad Diversified Index.

*JP Morgan EMBI Global Diversified Index            **JP Morgan CEMBI Broad Diversified Index

Source: JP Morgan, Bloomberg


There has also been a healthy annual issuance of emerging markets credit, with corporate issuance tending to be a larger component of the issuance compared to sovereign credit (Figure 3).

Figure 3 – Emerging Markets Credit Issuance

Figure 3 shows the breakdown of corporate and sovereign credit in emerging markets credit issuance from 2008 to 2024 (estimated), based on data from JP Morgan and FortWood Capital.Source: JP Morgan & FortWood Capital


Key Merits of Emerging Markets Credit

Higher yield: emerging markets credit market offers a spread premium over comparably rated developed markets peers due to perceived higher risks. Currently emerging markets offer some of the highest yields since the global financial crisis (Figure 4).

Figure 4 – Emerging markets credit yield vs. US 10-year treasuries

Figure 4 shows the emerging markets credit yield vs. US 10-year treasuries based on data from JP Morgan and Bloomberg.Note: EM Sovereign Index – EMBI Global Diversified, EM Corporate Index – CEMBI Broad Diversified
Source: JP Morgan, Bloomberg


Emerging markets are often susceptible to political and economic volatility. Changes in government, policy shifts, and geopolitical tensions can impact the creditworthiness of issuers. Sovereign credit also tends to have a longer duration (sensitivity to interest rate changes) and when combining these factors has led to emerging markets sovereign credit generally offering higher yields than emerging markets corporate credit.

Less levered: the perceived risk of emerging markets credit is not always justified despite the higher yield. For example, emerging markets corporate issuers, both investment grade and high yield, carry less debt relative to their ability to generate cashflow to service that debt, and are less levered than developed markets borrowers at the same credit rating (Figure 5). Despite carrying less leverage, emerging markets bonds have generally provided higher yields to investors for the same credit rating.

Figure 5 – Net Leverage Comparison

Figure 5 shows a comparison of net leverage of investment grade and high yield emerging markets corporate issuers according JP Morgan as of 2023.Source: JP Morgan (as of 2023) & FortWood Capital


Lower default experience: emerging markets issuers have historically defaulted at a lower rate than comparably rated developed markets peers (Figure 6). Many emerging markets exhibit robust economic growth, which can support the creditworthiness of issuers. For example, higher economic growth can increase corporate revenues, making the repayment of debt easier.

Figure 6 – Emerging markets corporates default less than developed markets peers
Average 10 year cumulative default rate (1981-2020)Figure 6 shows the average 10 year cumulative, default rate of emerging markets corporates to US corporates according to the SP Global Ratings Research.Source: S&P Global Ratings Research & FortWood Capital


Diversification merits: the economic cycles and market dynamics of emerging market countries often differ from those of developed markets. The different experience reduces the correlation, thereby providing a source of portfolio diversification. Investing across different countries, sectors, and issuers can reduce the impact of localized issues and enhance overall portfolio resilience.

Portfolio Construction Considerations

Currency management: for Canadian investors to manage any undesirable impact of fluctuations between US dollar denominated emerging markets credit and the Canadian dollar (CAD), the portfolio is typically hedged back to CAD, providing more predictable returns. This can be achieved in a cost-effective manner by the investment manager of the strategy using currency forwards, or other currency instruments.

Liquidity: emerging markets credit is generally a liquid asset class. For example, the liquidity of emerging markets corporate credit bonds is broadly comparable to that of developed market corporate bonds in normal market conditions.

Active management: there are numerous idiosyncratic economic and policy cycles across the different countries, which can contribute to added value opportunities for active managers. Also, like for emerging market equity, there are fewer sell-side research specialist for emerging markets credit compared to developed market credit, which creates opportunities for independent research. Skilled active managers can navigate market nuances, identify attractive opportunities, and adjust exposures in response to changing conditions.

Responsible investing: despite the political and social challenges associated with emerging market countries, governments and companies are increasingly recognizing the importance of environmental, social and governance (ESG) considerations.

Seize the Opportunity

Emerging markets credit presents a compelling investment opportunity with potential for higher yields, diversification benefits, and exposure to high-growth economies. Emerging markets credit can be a valuable addition to a well-rounded investment portfolio.