Connor Clark & Lunn Funds logo.

Toronto, ON – October 23, 2025 – Connor, Clark & Lunn Funds Inc. (the “Manager”) today announced its intention to terminate CC&L Market Neutral Fund (the “Fund”). The termination is scheduled to take effect on or about December 10, 2025.

The decision to terminate the Fund was made after careful consideration of various factors and is part of the Manager’s ongoing effort to ensure its product lineup remains aligned with investor preferences and needs and meets long-term goals.

Effective October 23, 2025, units of the Fund will no longer be available for purchase. Existing unitholders may redeem or switch their units of the Fund for settlement on or prior to the close of business on December 9, 2025. After that time, any remaining unitholders will have their units automatically redeemed at the net asset value per unit as of the termination date.

A notice with further information regarding the termination of the Fund will be sent to unitholders of the Fund. Unitholders are encouraged to speak with their Financial Advisors to discuss the termination and their investment options.

About Connor, Clark & Lunn Funds Inc.

Connor, Clark & Lunn Funds Inc. partners with leading Canadian financial institutions and their investment advisors to deliver unique institutional investment strategies to individual investors through a select offering of funds, alternative investments and separately managed accounts.

By limiting the offering to a focused group of investment solutions, Connor, Clark & Lunn Funds Inc. is able to deliver unique and differentiated strategies designed to enhance traditional investor portfolios. For more information, please visit www.cclfundsinc.com.

For further information, please contact:
Lisa Wilson
Manager, Product & Client Service
Connor, Clark & Lunn Funds Inc.
416-864-3120
[email protected]


Caution concerning forward-looking information

Certain statements in this press release may contain forward-looking statements or forward-looking information that are predictive in nature and may include words such as “expects,” “anticipates,” “intends,” “plans,” believes,” “estimates” and similar forward-looking expressions or negative versions thereof. All information other than statements of historical fact may be forward-looking information. All forward-looking information in this press release is qualified by these cautionary statements. Forward-looking information in this press release includes, but is not limited to, statements with respect to management’s beliefs, plans, estimates, and intentions, and similar statements concerning anticipated future events, results, circumstances, or expectations, including, but not limited to, the proposed termination of the Fund and the anticipated process for such termination. Such forward-looking information reflects management’s beliefs and is based on information currently available. Such forward-looking statements are based on current expectations and projections about future general economic, political, and other relevant market factors, and assumes there will be no changes to applicable tax or other laws or regulations. Although the Manager believes that the expectations reflected in such forward-looking information are reasonable, expectations and projections about future events are inherently subject to, among other things, risks and uncertainties, some of which may be unforeseeable and, accordingly, may prove to be incorrect at a future date. Forward-looking statements are not guarantees of future performance, and actual events could differ materially from those expressed or implied in any forward-looking statements. A number of important factors can contribute to these differences, including, but not limited to, general economic, political, and market factors in Canada and internationally, global equity and capital markets, business competition, and catastrophic events. You should avoid placing any undue reliance on forward-looking statements. The forward-looking information contained in this press release is presented as of the preparation date of this press release and should not be relied upon as representing the Manager’s views as of any date subsequent to the date of this press release. The Manager disclaims any and all responsibility to update any forward-looking statements, whether as a result of new information, future events, or otherwise, except as specifically required by law.

This communication is intended for informational purposes only and does not constitute an offer to sell or the solicitation of an offer to purchase any funds and/or investment products managed or advised by the Manager or any of its affiliates, and is not, and should not be construed as, investment, tax, legal, or accounting advice, and should not be relied upon in that regard. Commissions, fees, and expenses all may be associated with investments in funds and/or other investment products managed or advised by the Manager or any of its affiliates. Please read a fund’s offering memorandum or prospectus, as applicable, which contains detailed information, and speak to an advisor before investing. Funds are not guaranteed, their values change frequently, and investors may experience a gain or loss. Past performance may not be repeated.

Raw salmon on a wooden board.

In a world increasingly focused on wellness and sustainability, fish sits at the intersection of health and investment opportunity. From the cardiologist’s clinic to the equity analyst’s desk, the case for seafood has never been stronger. Whether you’re measuring omega-3 levels or return on equity, the numbers tell a similar story: balance, resilience and long-term growth.

In recent years, a quiet revolution has taken hold in nutrition circles: protein is back in the spotlight. Supermarkets and social media alike now highlight “high-protein” products, from snack bars and shakes to reformulated staples. What was once the domain of bodybuilders is fast becoming mainstream wellness. Major food industry reports confirm that the appetite for protein is real and broadening with 61% of US consumers increasing their protein intake in 2024, up from 48% in 2019. We all know the reasons: protein builds muscle, keeps you satisfied and supports overall health. What’s new is how it’s gone mainstream; it’s not just for athletes anymore.

This trend ties in perfectly with the growing focus on fish as a cornerstone of a healthy diet. As consumers shift toward protein-forward diets, seafood – long praised for its rich omega-3s – now gains even more appeal for its dual role: premium protein plus cardiovascular benefit.

Salmon isn’t just known for its omega-3s; it is a robust, high-quality protein source, and that amplifies its value in a protein-conscious world.

  • Rich protein density: An 85 g portion of raw wild salmon contains about 17 g of protein, nearly all essential amino acids, making it a “complete” protein.
  • Lean, but nutrient-dense: Compared to many red meats or processed protein sources, salmon provides its protein alongside healthy fats (primarily EPA/DHA), vitamin D, selenium and minimal saturated fat.
  • High bioavailability and recovery support: The amino acid profile (especially leucine) in fish proteins supports muscle protein synthesis and recovery which is a benefit that complements the anti-inflammatory effects of omega-3s.
  • Lower contaminant risk (relative to larger predators): While mercury and PCBs remain valid concerns for some species, salmon – particularly well-managed farmed or wild-caught types – tends to lie at the safer end of the spectrum, making it a smart choice within a diversified seafood diet.

This health-driven demand story is not only reshaping dietary habits, it’s also powering an investment opportunity. As one of the world’s largest salmon farmers, SalMar ASA (SALM NO) sits at the forefront of this global protein transition. The company’s scale, cost control and sustainability credentials make it a standout in the seafood sector.

SalMar is one of Norway’s leading salmon producers, and one of the highest-quality names in the global aquaculture industry. Based along Norway’s pristine coastline, SalMar combines decades of experience with innovative farming technology to produce salmon that’s both sustainable and consistently high in quality. The company’s strengths lie in its efficient operations, prime farming locations and focus on biological control, which keep production costs low while maintaining excellent fish health and environmental standards. With operations stretching from central to northern Norway and growing exposure in Iceland and Asia, SalMar is well-positioned to meet rising global demand for healthy protein.

Norwegian farmed salmon, more broadly, has become a gold standard for sustainable seafood. The cold, clean waters of Norway provide the perfect environment for salmon to grow naturally, while strict national regulations ensure traceability, low antibiotic use and responsible feed sourcing. Compared to other animal proteins, salmon has a smaller carbon footprint, delivers high-quality omega-3 fats and provides a complete source of lean protein making it a smart choice for both consumers and investors focused on health, sustainability and long-term value.

If consumers continue reprioritizing protein, salmon producers like SalMar, that manage costs, traceability and scale will enjoy structural growth beyond the broader seafood category. For our portfolio, the protein trend adds an extra degree of optionality of not just health credibility, but a narrative anchored in a “protein-first” consumer future.

The global money growth surge of 2020-21 resulted in a monetary overhang, which limited economic damage when money trends subsequently slumped in 2022-23, as well as providing fuel for a prolonged bull market in risk assets.

So how much is left in the monetary tank?

One approach is to compare the ratio of the money stock to nominal GDP with its longer-term trend. This has two major drawbacks – it ignores the dependence of money demand on wealth as well as income, while the trend is left unexplained.

An alternative approach is based on the “quantity theory of wealth”. This posits that a given percentage change in the (broad) money stock is reflected in an equal percentage change in the geometric mean of nominal GDP and gross wealth.

The conventional quantity theory states that monetary expansion will lead to some combination of increased output and higher prices of goods and services to restore equilibrium.

The modified theory allows for asset prices (and stocks of assets) to bear part of the burden of adjustment. The modified approach fits US long-term historical data without requiring the assumption of an unexplained trend.

Charts 1-3 below apply this idea to US, Japanese and Eurozone data since the end of 2018, implicitly assuming that money stocks were in equilibrium with nominal income and wealth at that date. The gap (shaded) between the paths of the money stock and the combined income / wealth variable is an estimate of the monetary overhang. The individual paths of nominal GDP and wealth are also shown for comparison.

The rise in the money stock has been reflected in a larger increase in wealth than income in all three cases.

In the US, the suggestion is that the monetary overhang was eliminated in Q1 2024. Broad money and nominal GDP have grown at the same pace since then (a cumulative 6% through Q2 2025), with wealth rising faster (12%), driven by the equities component (19%) – chart 1.

Chart 1

Chart 1 showing US Broad Money, Nominal GDP & Gross Wealth* Q4 2018 = 100 *Gross Wealth = Public Equities + Debt Securities ex Fed + Residential Real Estate

The Japanese overhang is estimated to have been removed one quarter later, in Q2 2024. Broad money has barely grown since then, while nominal GDP has outpaced wealth (5% versus 2% increase through Q2 2025) – chart 2.

Chart 2

Chart 2 showing Japan Broad Money, Nominal GDP & Gross Wealth* Q4 2018 = 100 *Gross Wealth = Financial Assets (ex Money) of Domestic Non-Financial Sector + Residential Real Estate

In contrast to the US and Japan, a small monetary overhang is estimated to have persisted in the Eurozone. Nominal GDP and wealth grew similarly in the year to Q2 2025 (4%), slightly outpacing money (3%) – chart 3.

Chart 3

Chart 3 showing Eurozone Broad Money, Nominal GDP & Gross Wealth* Q4 2018 = 100 *Gross Wealth = Financial Assets (ex Money) of Households & NFCs + Residential Real Estate

The suggestion is that there is no major misalignment between current money stocks and levels of nominal income and asset prices in the three economies. A stock overhang is no longer acting as a tailwind for economic activity and markets but nor is there a significant monetary deficiency.

The monetary environment, in other words, has normalised, suggesting a re-anchoring of economic / market prospects to money growth and underlying cycles.

Seoul cityscape at twilight in South Korea.

We called for a brighter outlook for EM equities over a year ago on the prospect of a USD bear market. This is now starting to play out, led by a liquidity-driven bull market in China.

Over the last three years to the end of the quarter, EM equities have compounded at an annualised rate of 19%.

Our markets remain under-owned and boast cheap valuations relative to US stocks. Easing financial conditions should support a recovery in earnings growth.

We are also believers that you can have too much of a good thing, and that emerging markets are a host to a number of attractive structural thematics outside of the AI fervour that are unique to our investment universe.

The rally this year has been focused on the large cap names. To illustrate, the MSCI EM Small Cap Index has returned 16.67% against 28.16% for the large cap index for the year to date.

This is also reflected in the underperformance of smaller and less liquid markets such as ASEAN. As the bull market matures, we expect liquidity to creep out to markets such as Malaysia, which have been abandoned by foreign investors despite having exciting structural investment opportunities. We know from past experience that when investor flows do return, the upside can be dramatic.

Returns across emerging markets have so far been driven by local allocators, with foreign investors largely sitting on the sidelines – although interactions with attendees on our usual conference circuit suggest that this could be about to change.

Korea Value-Up deep dive: SK Square

Corporate Value-Up catalyst alongside tailwind from SK Hynix’s dominance in high bandwidth memory

South Korean equities have surged by over 57% this year to the end of September. The fuel is a combination of exposure to AI infrastructure mania through the country’s tech giants such as SK Hynix and Samsung rallying, ultra cheap valuations and the prospect of a broader market re-rating courtesy of the Value-Up corporate reform drive that is now underway.

Below we provide a deep dive into recent portfolio addition SK Square, which we think is emblematic of the broader upside potential in Korean equities if the government sticks to its reform ambitions.

South Korean equities have surged by over 57% this year to the end of September. The fuel is a combination of exposure to AI infrastructure mania through the country’s tech giants such as SK Hynix and Samsung rallying, ultra cheap valuations and the prospect of a broader market re-rating courtesy of the Value-Up corporate reform drive that is now underway. Below we provide a deep dive into recent portfolio addition SK Square, which we think is emblematic of the broader upside potential in Korean equities if the government sticks to its reform ambitions.

Overview

South Korea is home to some of the world’s most innovative companies, and yet it is also arguably one of the cheapest equity markets. The dichotomy is down to a poor history of corporate governance in the country, with the economy dominated by vast family-controlled chaebol conglomerates.

These families have historically been more focused on preserving their business empires than looking out for the interests of minority shareholders. However, following in the footsteps of Japan’s stock exchange reforms, South Korea has launched Value-Up to narrow the “Korea discount” and attract foreign capital.

We think SK Square epitomises the sort of opportunity where Value-Up could be a significant catalyst for re-rating. Spun off from SK Telecom in 2021, the holding company’s investment portfolio includes business across semiconductors (SK Hynix), ICT ventures and digital platforms.

A compilation of the logos of 19 companies within the investment portfolio of SK Square.
Source: SK Square 2025

Focus on the discount to NAV for this holding company – the discount has widened to 55% following a recent correction. This was an opportunity to buy. Management has levers to pull to narrow the NAV discount via more share buybacks, NAV enhancement and dividend payouts.

SK Square is the best in class among the holding companies and is leading peers in efforts to enhance shareholder value. Management quality is high and the board has a majority of independent directors. They were the first holdco to unveil their Value-Up program and appear to be executing the plan well.

The company is already practising cumulative voting rights – this favours minority shareholders who can pool votes to secure board seats (only 6% of companies in South Korea practice cumulative voting).

The disposal of non-core assets will enable SK Square to focus its energy on its best assets in the IT and Communications sectors.

A brief history of the chaebols

Born out of the interplay of historical, economic and governmental forces following WWI and the Korean War, these family-owned conglomerates filled a significant institutional void post Korea’s liberation from Japanese occupation in 1945.

Chaebols were formed out of the sale of assets previously owned by Japan’s government and firms, which accounted for 30% of the Korean economy. These assets were often sold to families and high-ranking officials at a deep discount, with prices based on outdated book values amidst high inflation. Early chaebols like Hanwha, Doosan, Samsung, SK and Hyundai used these assets as the foundation for growth.

The Korean government played a decisive role in shaping the economy since 1961. Under President Chung Hee Park, economic development became a top priority for legitimacy. The government launched a series of five-year development plans which were based on nationalising banks and channelling foreign loans in capital-intensive heavy industries and chemical industries. It allowed chaebols to acquire or establish non-bank financials to provide capital to their affiliates.

Korea experienced chronic capital shortages throughout its development period, particularly after the Korean war. The chaebols could create value by internalizing resource allocation and replacing poorly performing institutions. The absence of supporting industries meant that chaebols often had to vertically integrate to secure necessary parts and raw materials.

While the chaebols were effective vehicles for kickstarting growth, a host of structural issues emerged.

Vertically integrated suppliers, with captive customers, meant the chaebols lacked incentives to be efficient.

Cross-subsidisation across affiliate businesses led to yet more inefficiencies and wasteful allocation of capital.

Internal subsidies via nonbank financial subsidiaries funded unprofitable ventures bypassing traditional banks. This was identified as one of the causes for the Asian Financial Crisis.

Centralised family control over numerous group affiliates even though their direct equity ownership is often a small percentage. This control allows for decisions that serve personal interests at the expense of minority shareholders.

Cross-shareholding – affiliates within a chaebol group own shares in each other, which inflates the apparent ownership stakes and provides a mechanism for the founding family to control the entire group with minimal actual capital investment.

High debt-equity ratios. Chaebols have historically preferred debt over equity financing to avoid diluting the controlling stakes of their founding families.

Unchecked power of chairmen. Chairmen held absolute power over strategic decisions, leading missteps such as ill-conceived diversification strategies e.g., Samsung’s entry into the auto industry.

Ineffective boards. Typically dominated by executive officers and outside directors with close ties to dominant shareholders. They often serve to provide ex-post factor approval rather than independent oversight.

Value-Up aims to tackle these issues, and it is more than just political rhetoric.

The program is supported by both of South Korea’s major political parties in the DPK and PPP. Real reform is underway, including revisions to the Commercial Act mandating director loyalty to shareholders (instead of to “the company”), electronic shareholder meetings for large firms and cumulative voting rights to empower minority investors.

Corporate governance reform – Japan vs. Korea

South Korea Japan
Mandatory vs. voluntary Voluntary Mandatory
Incentives Carrots and sticks Named and shamed
Targeting companies with price to book ratio <1 Financial Services Commission believes PBR helps assess whether or not the issue arises from a low ROE due to a high cost production structure and decrease in market demand. The company has not achieved profitability that exceeds its cost of capital, or investors are not seeing its growth potential.
Framework A Value-Up ETF Index has been created. Value-Up adherents to be rewarded with inclusion.

Potentially, a special tax regime will be set up for companies increasing dividends.

Companies complying with the new corporate governance rules were publicly named by TSE in early 2024.


History of SK Square

Founded in November 2021 via a spin-off of SK Telecom, SK Square intended to focus on ICT investments and become a more growth-and-tech-focussed holding company.

The downturn in portfolio company and DRAM giant SK Hynix in 2023 forced SK Square management to sharpen its focus on the underlying portfolio, much of which was loss making.

SK Group chairman Chey does not have a direct stake in SK Square and the independent board of directors makes it more exposed to shareholder activism. It was the subject of shareholder activism in 2023–2024, led by a London hedge fund (1% shareholding), pushing for the business to release an industry-leading value-up plan which was eventually announced in November 2024.

Company overview

  • Operating income (Q2 2025) of 1.4tn won, of which SK Hynix contributed to 1.84tn (20% stake). The ICT portfolio is generating negative operating income of 28.9tn won.

Two bar graphs of SK Square's financial performance. The first graph illustrates the operating income growing to 1.4 trillion won as at Q2 2025. The second graph illustrates the ICT operating income generating a negative operating income of 28.9 trillion won.
Source: SK Square company presentation Q2 2025

  • SK Hynix is 88% of SK Square NAV.

A line graph illustrating that SK Hynix makes up 88% of SK Square's net asset value.

  • Other than SK Hynix, SK Shieldus (2% NAV) and TMAP Mobility (1%) are the only ventures making meaningful profits.
  • Management said that they will divest 20 or more ventures this year, and the rest in the next couple of years.

Four bar graphs. Graph one shows SK Hynix revenue and operating income for the last 5 quarters. Graph two shoes TMAP Mobility year-over-year growth in operating income and monthly active users. Graph three shows Eleven Street year-over-year growth in operating income and EBITDA. Graph four shows SK shieldus year-over-year growth in revenue and EBITDA.
Source: SK Square company presentation Q2 2025

SK Square’s NAV discount is beginning to narrow. A recent market correction has given us an opportunity to buy the stock.

  • NAV to market cap discount has narrowed significantly from 74% in 2022 to 66% at Q3 2024 since the announcement of its value-up program.
  • The discount narrowed to a low of 47% in June, before the KOSPI and SK Square correction.
  • While SK Hynix corrected by c.15% from its July peak, SK Square’s share price fell by c.37% from its June peak, with the NAV discount widening to c.55% at the time we initiated our position.
NAV Discount 28/08/25
NAV 44,198
Market cap 19,828
-55%


Catalysts

There are strong KPI incentives in place for management if the NAV discount gets to 50%, ROE> Cost of equity at 13-14% and over 1x PB by 2027.

The Price to Book Ratio analysis side from the SK Square company presentation with comments on data presented.
Source: SK Square company presentation Q2 2025

The NAV discount has been narrowed by:

1) Aggressive share buybacks (c.9% of total outstanding). Critically, all shares bought back are to be cancelled. At the March AGM, another batch of buyback of 100bn won was announced on top of the 300bn and 200bn buybacks in 2023 and 2024.

Slide on shareholder return illustrating the completed cancellation of previously acquired shares and new share buyback program underway.
Source: SK Square company presentation Q2 2025

2) Non-core divestments by reducing the number of entities from 43 to 20 this year. They are hoping to de-risk the portfolio, boost cash flows and shareholder returns.

Slide illustrating the plan to boost the profitability of the ICT portfolio of SK Square following the significant reduction of operating losses.
Source: SK Square company presentation Q2 2025

3) Payout of at least 50% of recurring portfolio dividend income to investors.

Slide illustrating the discussion and implementation of value-up measures.
Source: SK Square company presentation Q2 2025

Our base case is for NAV discount to narrow to 40% over medium term, the historic average of holdco discounts in South Korea.

A bar graph illustrating a comparison of NAV discounts from different times and regions in Korea.
Source: CLSA, DART

Narrowing the discount to this level implies significant upside in the stock.

In addition, dividends from SK Hynix will amount to 3tn won by 2027, which can be deployed.

They have sold an SK Shieldus (Cybersecurity) stake to a PE fund and the cash received in Q3 2025 (510bn won) could be deployed to further boost shareholder returns.

For the remaining unlisted companies, management is yet to outline plans for further asset sales. More clarity here would boost the stock.

Additional tailwinds may come from the next batch of share buybacks to be announced in Q4. The pace and magnitude will be key. SK Hynix coming back in focus as an AI play is an added tailwind.

Risks

  • The board of directors may not go as far as investors expect to sustainably narrow the NAV discount from 75% in 2022 to 50%.
  • Disappointment over the cadence and magnitude of share buybacks.
  • Chairman Myung is trying to turn some portfolio companies around to be EBITDA positive, but the labour union is in the way. (We are still seeing some progress i.e., portfolio company TMAP turned an operating profit in Q2 2025).
  • The pace of divestments could be slower than anticipated, as assets require proper packaging to sell them at a good valuation.
  • Volatility in the stock adding to beta to the portfolio.
  • An SK Hynix downcycle and share price downturn will trigger a bigger correction in SK Square.

Summary

Overall, SK Square is just one example of how South Korea’s Value-Up program can act as a catalyst for managers to sharpen up capital allocation and sweat their assets harder. Much will depend on the government’s willingness to pressure corporates to continue value-enhancing efforts through further legislative and regulatory reform. The momentum is positive, and if sustained could lead to a full market re-rating.

Chinese money trends suggest a continuation of sluggish economic growth, negligible inflation and a supportive liquidity environment for markets.

Six-month growth of narrow money – as measured by the new M1 definition incorporating household demand deposits – rose slightly in September, extending a recovery from a May low. Broad money momentum also edged higher. Both series are around their average levels in recent years – see chart 1.

Chart 1

Chart 1 showing China Nominal GDP* (% 2q) & Money / Social Financing* (% 6m) *Own Seasonal Adjustment

Credit trends remain weak, with six-month growth of bank lending reaching another record low, although numbers have been suppressed by bond swaps. Monetary expansion, however, continues to be boosted by China’s version of QE, conducted via the state banks. Monetary financing of the government, including bond swaps, accounted for 3.8 pp of M2 growth of 8.4% in the year to September – chart 2.

Chart 2

Chart 2 showing Monetary Financing of Fiscal Deficits* (12m sum, % of broad money) *Monetary Financing = Purchases of Government Securities (ex Agencies) by Central Bank & Other MFIs minus Change in Government Deposits

Money growth remains above nominal GDP expansion, arguing against a debt deflation scenario and suggesting “excess” money support for asset prices. With the housing market still weak and longer-term bond yields recently moving up from record lows, equities could remain the default beneficiary.

Two scientists looking through microscopes.

The foundation of traditional Chinese medicine is Qi – the life force or energy that flows through a body. If, for any reason, the Qi in your body was to go out of balance or get blocked, one would end up falling ill. A wide range of plant- and animal-based medicines would then be used to unblock those pathways and to restore the balance of Yin and Yang in the body.

While traditional Chinese medicine techniques like cupping and acupuncture gain popularity both at home and abroad, China has been quietly making giant strides in the traditional pharmaceutical and biotechnology sectors. In the past, it applied the principles of scale and an integrated supply chain to manufacture inexpensive generics faster and cheaper than its competitors.

Cut to present day, China’s pharmaceutical industry is on the cusp of becoming a global leader in both drug discovery and development. According to Morgan Stanley, annual revenues from drugs originating in China could reach USD$34 billion by 2030 and USD$220 billion by 2040. Currently, drugs from China account for only 5% of all USFDA approvals, but that is estimated to rise to 35% by 2040. So how did China go from a middling pharma player to the hot house of innovation and manufacturing that we see today?

Broadly, we can trace three key factors that are fueling this boom:

  1. Reforms – The comprehensive series of reforms needed to move the needle in this space did not happen overnight. Over the last decade, China has made a deliberate push to move from a large-scale generics manufacturer to an innovation powerhouse by pushing through the following reforms.
    • Increasing innovative drug approvals – In 2017, measures were introduced to reduce the review timeline of innovative drugs to 60 days, increasing the efficiency of the drug development process. The result has been a record 93 drugs receiving first approval from the National Medical Products Administration (NMPA) in China in 2024 with China surpassing Europe and Japan as the second largest country to receive first approvals.
    • Investment inflows – Funding is crucial for innovation and reforms such as 18A listing rules in Hong Kong and the launch of STAR Market (touted as Shanghai’s equivalent to NASDAQ) allowed pre-revenue biotech companies to list and raise money.
    • Globalization – In response to intense competition at home, Chinese pharmaceutical companies have started to spread their wings abroad through strategic partnerships. This is being executed by applying for global approvals for drugs developed in China and through so called out-licensing agreements, where Chinese companies further the development of their unique IP by leveraging the R&D and commercialization network of western pharma giants.
  1. Speed – To accelerate development of novel drugs, China’s regulator is proposing to further cut the clinical trial review period from 60 to 30 working days, matching the time line of USFDA. The presence of large pools of patients in Chinese cities further expedites the go-to-market process.
  2. Talent – China graduates around five million science, technology, engineering and mathematics (STEM) graduates every year. The recent crackdown in immigration in the United States has led many talented Chinese scientists and professionals (nicknamed “sea turtles”) to return home. The recent announcement by the Chinese government of the K visa program could further accelerate this trend.

This combination of speed, abundance of talent and structural reforms could throw up multiple opportunities in the Chinese pharma space. It is next to impossible to predict which company could win the next out-licensing deal. Similarly, picking the next big biopharma product requires a high degree of technical expertise. Hence our investment in Sunresin New Materials Co. Ltd. (300487 CH) takes a picks and shovel approach to this space.

Sunresin is a specialty resin manufacturer, making more than 200 different types of resin for a variety of applications from purifying water, extracting lithium to serving as an enzyme carrier for drug development including GLP-1 drugs. While its life sciences business makes up about a fourth of its revenue, given the trends discussed above, the growth opportunities and potential runway could be enormous.

The consumables that Sunresin manufactures have high barriers to entry, more stable risk profiles vs. betting on winning drugs and underlying high growth in total addressable market. Its products are used both for upstream synthesis of various active pharmaceutical ingredients (APIs) and for downstream separation and purification that determines the final quality of the drug.

Key trends that underpin Sunresin’s growth include:

  1. Growth of the biologics (large molecules) market that is growing faster than the chemical drug (small molecules) market. Biologics production has an upstream API synthesis phase that requires carriers and a downstream purification phase that requires chromatographic media (CM) to capture target molecules.
  2. Sunresin produces both upstream carriers (for both large and small molecules) and downstream chromatographic media. Entry barriers are high as both products can make up 15–40% of production cost and are crucial to the final quality of the drug. Switching suppliers by commercial drug makers can be costly and time consuming.
  3. Rise of import substitution in China and rise of overseas opportunities from out-licensing deals could further underpin growth.
  4. Build out of new high-end life sciences capacity that could support 10x of current sales.

Between its proven products, new capacities and tailwinds from the growth of biologics and the larger China bio pharma sector, we see Sunresin as a key winner in the race to find the new blockbuster drugs on the back of China’s booming pharmaceutical sector.

Credit tightening in private markets may mark the end of a boom in US bank lending to shadow banks, with negative monetary implications.

Equity prices of major players in private credit have fallen sharply in the wake of the Tricolor / First Brands bankruptcies, with an average down by 31% from a January peak – see chart 1.

Chart 1

Chart 1 showing US Private Credit-Exposed Equities & S&P 500 31 December 2022 = 100

Increased risk aversion is also evident in lower prices / higher yields of traded private credit instruments, such as the VanEck Business Development Companies ETF (BIZD), which usually mirrors moves in high yield spreads but has opened up a wide gap – chart 2.

Chart 2

Chart 2 showing US HYG High Yield Corporate Bond ETF Relative to 3y Treasuries & BIZD Business Development Companies ETF

Commercial bank lending to shadow banks / private credit has been booming, with the “all other” category containing loans to non-bank financial institutions up by 14.5% in the year to September, accounting for 2.9 pp of overall bank loan growth of 4.9% – chart 3*.

Chart 3

Chart 3 showing US Commercial Bank Loans & Leases (% yoy)

Traditional loan categories – C&I, real estate and consumer – grew by only 2.5% over the same period.

Lending to shadow banks is likely to slow as private credit players rein in activity and loan officers tighten standards. A normalisation could cut 2 pp or more from annual loan growth, implying weaker broad money expansion unless offset by other “credit counterparts”**.

Credit tightening could extend to other loan categories unless private markets recover – chart 4. (Note that the reporting window for the October Fed senior loan officer survey, to be released in early November, may already have closed, so the results may not fully reflect recent developments.)

Chart 4

Chart 4 showing US Fed Senior Loan Officer Survey: Tighter Credit Standards on C&I Loans & BIZD Business Development Companies ETF (inverted)

*Growth numbers are break-adjusted – levels series have been distorted by recent reporting changes.

**Some combination of increased monetary deficit financing, a stronger basic balance of payments or reduced non-deposit funding.

Top-down view of business people working in office.

For decades, the strategic asset allocation (SAA) process has provided institutional investors with a structured, benchmark-driven framework for managing portfolios. This approach, grounded in academic research and modern portfolio theory, has helped countless boards and investment committees move beyond the classic 60/40 equity/fixed income allocation to embrace a more diversified mix.

As the investment landscape evolves, some of the world’s largest investors are transforming their processes, adopting an innovative total portfolio approach (TPA) that treats the portfolio as a single, dynamic entity rather than a collection of separate asset classes. This article explores the evolution of asset mix strategies, the merits and limitations of SAA and the promise and challenges of a TPA.

The evolution of asset mix strategies

Institutional investors have experienced significant changes in their asset mix over the years. The classic 60/40 model dominated for decades, until Yale’s David Swensen and Dean Takahashi pioneered a shift toward alternative investments in the late 1980s and early 1990s. By introducing private equity, hedge funds, real estate and natural resources, they revolutionized asset allocation and diversified portfolios beyond traditional boundaries.

As other institutions moved beyond the 60/40 allocation, the SAA framework became a critical tool for guiding long-term asset mix targets, based on investment objectives, risk tolerance, liquidity needs and time horizon.

Advancements in technology and greater access to data are transforming how financial markets operate and how portfolios are managed. Investors can now better understand the impact of their decisions, enabling more dynamic and informed portfolio management, which has led to the TPA becoming the latest evolution. It offers valuable concepts for all investors, even though it remains the domain of the largest global institutions.

The enduring appeal of SAA

The SAA process is intuitive and provides a quantitative discipline for establishing asset mix. Its enduring appeal lies in its accessibility, where any investor, regardless of size, can use it. At its heart, the SAA process is about enhancing diversification – which can reduce risk without sacrificing target returns – or enabling higher returns while keeping risk consistent.

The process begins with defining investment objectives, time horizon, risk comfort, and liquidity needs. Based on these metrics, investors analyze expected performance and volatility to determine potential mixes, but with a general prioritization on relative returns. The final asset mix decision often hinges on which asset classes a board or investment committee is most comfortable with.

Once selected, the mix is refined, which can imply adding new asset classes or investment managers to the mix, or simply tweaking the allocations among the existing asset classes and managers. The portfolio is monitored against objectives and benchmarks, ensuring ongoing vigilance and adaptability as market conditions evolve.

Limitations and disconnects in SAA

While the SAA framework has stood the test of time, it is not without flaws. A common critique is the disconnect between asset allocation design and manager selection. When these steps are managed separately, inefficiencies can arise, reducing diversification benefits. This separation can also result in the portfolio’s risk-return experience deviating from the intended profile, especially when too much focus is placed on past performance during manager selection, overlooking risk.

Adding new asset classes and investment managers typically requires a formal review, slowing down the ability to respond to evolving market conditions. Long-term capital market assumptions guide SAA decisions, but their reliability is questionable. Studies show that while return forecasts often miss the mark, risk forecasts tend to be more consistent with actual outcomes. This suggests that focusing on managing risk may be wiser than chasing returns.

What is a total portfolio approach?

Unlike the traditional SAA model, where asset classes are managed in silos, the TPA treats the portfolio as one unified whole. Every investment decision is evaluated for its impact on the overall risk and return of the portfolio, with a particular focus on risk. This holistic, agile approach leverages cross-asset expertise and enables teams to respond quickly to changing market dynamics.

However, adopting a TPA is not simply an investment process shift; it is a cultural transformation. Organizations must move beyond managing asset-class silos to embrace a unified portfolio model, requiring bold changes in culture and governance. Boards and investment committees need to delegate more decision-making authority and empower CIOs and internal investment teams. Under the TPA, collaboration across specialist disciplines and alignment of incentives are essential for total portfolio success.

Who is leading the way?

The TPA was initially adopted by the world’s largest investors, such as the Australian Future Fund, Canada’s CPP Investments, the New Zealand Superannuation Fund, and GIC, Singapore’s Sovereign Wealth Fund. These institutions have the scale to integrate investment teams and create collaborative environments necessary for a TPA to work. The TPA philosophy began to take formal shape around 2006, but its roots go back further, notably to TRW in the early 1990s, where Chief Investment Officer Bob Hamje shifted the focus from individual mandates to total portfolio performance, rewarding managers for collaboration and overall success.

SAA versus TPA: Comparative perspective

The table highlights key differences between SAA and TPA.

Characteristic Strategic asset allocation (SAA) Total portfolio approach (TPA)
Performance assessed versus: Asset class benchmarks Fund-level goals and reference portfolio
Success measured by: Relative value added Total fund return
Opportunities for investment defined by: Asset classes Contribution to total portfolio outcome
Diversification achieved through: Asset classes Risk factors
Asset allocation determined by: Board-centric process CIO-centric process
Portfolio implemented by: Multiple teams competing for capital One team collaborating across strategies

Source: Thinking Ahead Institute

The move from SAA to TPA represents a significant transformation. With SAA, success is defined by performance relative to a total fund benchmark, which is calculated as a weighted average of the benchmarks for each asset class. The TPA, on the other hand, measures success against fund-level goals, typically guided by a reference portfolio.

Under SAA, each asset class is selected for its role in meeting return, risk, diversification, and liquidity objectives. The TPA shifts emphasis to understanding how each investment opportunity contributes to the overall portfolio outcome, with risk factors and risk premia shaping both strategy and results. This approach allows for more robust stress testing under different macroeconomic regimes, providing a clearer understanding of a portfolio’s resilience.

Perhaps the most profound change under the TPA is the shift in culture and governance. Decision making moves from being board-centric to being centered on the CIO and investment team, fostering collaboration and accountability for total portfolio outcomes.

Challenges of TPA

While the appeal of TPA is clear, it can be challenging to implement. The challenges are not just technical but also cultural and governance related. TPA empowers the CIO with greater investment discretion, opening the door to more dynamic portfolio management. Many funds adopting TPA use a reference portfolio, typically comprised of equities and fixed income, as an additional benchmark, but this can lead to counterfactual thinking and misplaced concerns if the more diversified TPA portfolio underperforms the reference portfolio over shorter-term periods.

The TPA also demands significant investment in data and infrastructure for risk analysis, making it challenging for smaller funds to contemplate. In addition, assessing individual manager contributions becomes more nuanced. Under the TPA success is measured by the impact on overall portfolio outcomes rather than asset-class benchmarks, which makes it more challenging to appreciate individuals’ or specific teams’ contributions.

Practical lessons for all investors

While a full TPA may be beyond the reach of most investors, elements of the approach can strengthen decision-making and improve outcomes, including:

  • Reframing objectives to focus on total portfolio outcomes and have less emphasis on relative returns.
  • Enabling greater investment flexibility through governance education that engages the board early in the review process with the goal of obtaining comfort with a broader set of investments.
  • Shifting emphasis from return forecasts to risk expectations, since the evidence suggests risk forecast tend to be more dependable than return forecasts.
  • Enhancing implementation through completion portfolios to maintain the total portfolio’s alignment with long-term objectives.

Conclusion

Although the total portfolio approach has so far been adopted by the largest funds, its lessons are relevant to all investors. The emphasis on risk, alignment with long-term goals, and more flexible governance point to a more resilient and responsive way of managing portfolios.

Even if a full TPA is not practical today for smaller investors, there is real value in adopting elements of the approach and weaving its philosophy into board discussions and asset allocation processes over time.

Top-down view of a meeting with 6 people sitting at a table.

Peter Muldowney, Senior Vice President and Head of Institutional and Multi-Asset Strategy, speaks with Plans & Trusts about the role of emotional intelligence (EQ) in shaping board culture and driving performance.

Cycle analysis suggests economic and market weakness in 2026-27. A recent monetary slowdown is consistent with this perspective but needs to extend to confirm a negative scenario.

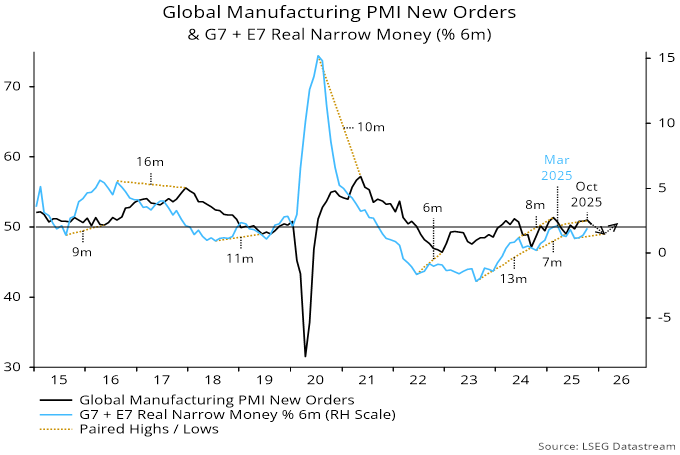
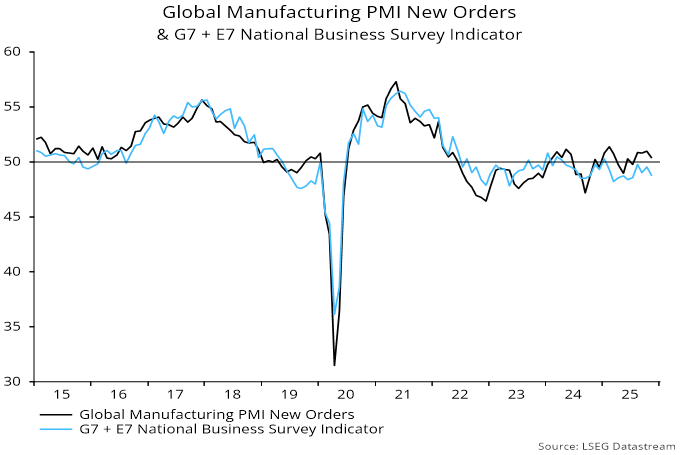
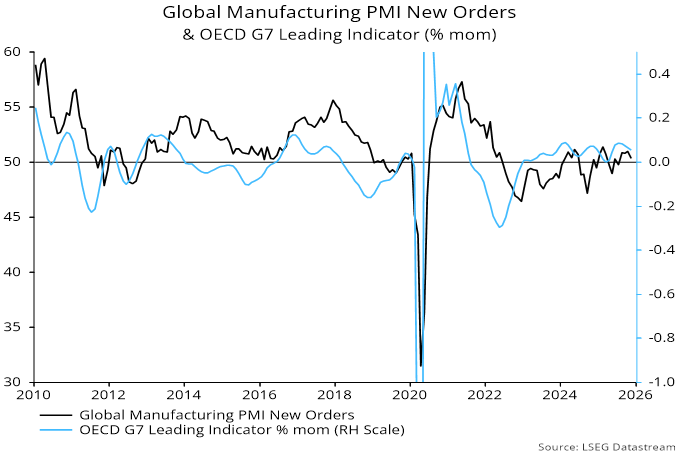
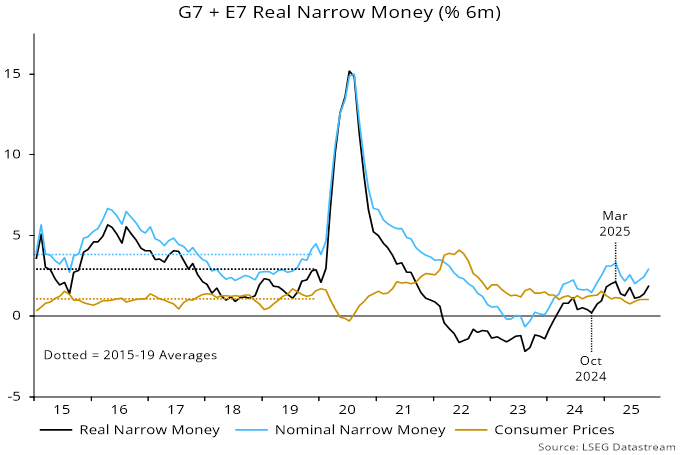
Global (i.e. G7 plus E7) six-month real narrow money momentum moved sideways in August, following a March-July fall. The previous low in real money momentum in October 2024 was reflected in a low in global manufacturing PMI new orders in May. Accordingly, the monetary slowdown since March could be mirrored by a peak and reversal in PMI new orders from around October – see chart 1.

Chart 1

Chart 1 showing Global Manufacturing PMI New Orders & G7 + E7 Real Narrow Money (% 6m)

The fall in real money momentum has been modest but an expected economic slowdown could become more serious than others in recent years, for two reasons. First, the stockbuilding and housing cycles have entered time windows to begin downswings. Secondly, labour markets are showing signs of weakness for the first time since the pandemic recession, raising the risk of self-reinforcing negative dynamics.

The working assumption here has been that the stockbuilding cycle will reach another low in Q1 2027, implying a four-year current cycle versus a 3.5-year historical average. Recent G7 national accounts stockbuilding data as well as an indicator based on business surveys are consistent with the cycle being at or near a peak – chart 2.

Chart 2

Chart 2 showing G7 Stockbuilding as % of GDP (yoy change) & Business Survey Inventories Indicator

The housing cycle bottomed in 2009 and has ranged between 15 and 25 years historically, averaging 18 years. The pandemic-related money growth surge of 2020-21 appears to have resulted in the current cycle peaking early, in 2022. G7 housing starts or permits have been range-bound since early 2023 but rising unemployment could be the trigger for a break lower.  China has been leading in the current cycle and starts are still falling – chart 3.

Chart 3

Chart 3 showing G7 Housing Permits or Starts* & China Floorspace Started December 2004 = 100 *Permits for US, Germany, France, Italy / Starts for Japan, UK, Canada

The suggestion that unemployment is on a rising trend is supported by consumer surveys, with a composite G7 indicator of negativity recently reaching a four-year high – chart 4.

Chart 4

Chart 4 showing G7 Unemployment Rate & Consumer Survey Labour Market Weakness Indicator

Monetary policy easing, if sufficiently dramatic, could short-circuit negative cyclical dynamics. A dramatic move could occur conventionally if additional evidence of labour market weakness is accompanied by a downside inflation surprise, or unconventionally if the Trump administration succeeds in gaining control of the Fed. A large cut in US rates would magnify US dollar weakness, forcing other central banks to follow.

Inflation prospects are judged here to be favourable, at least through early 2027. G7 annual broad money growth remains subdued (4.3% in August versus a 2015-19 average of 4.5%), while stockbuilding cycle downswings are usually associated with weakness in commodity prices – chart 5.

Chart 5

Chart 5 showing G7 Stockbuilding as % of GDP (yoy change) & Industrial Commodity Prices (% yoy)

Near-term US inflation numbers, however, will continue to reflect tariff effects. Elsewhere, central bankers focused on fighting the last war may be slow to respond to favourable surprises. As an example of hawkish bias, the ECB has gone on hold despite forecasting below-target inflation.

The alternative route to a large near-term fall in rates – a take-over of the Fed by the executive branch – still seems far-fetched, with the administration lacking scope to push through personnel changes on the necessary scale.

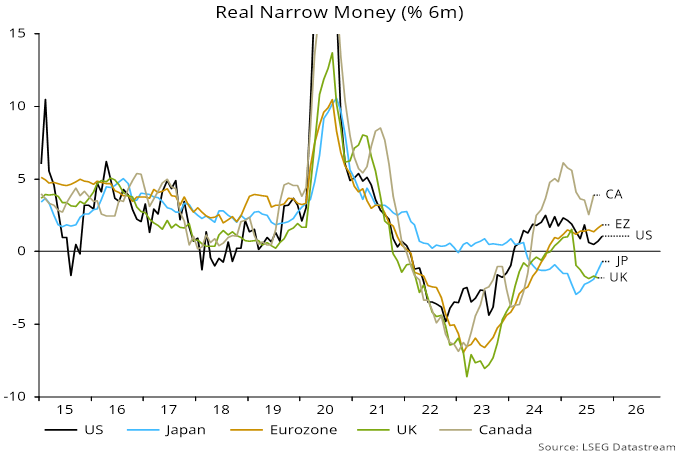
Among major economies, six-month real narrow money momentum is weakest in Japan and the UK, suggesting over-restrictive monetary policies and downside economic risk. Momentum is similar in the US and Eurozone but the US has slipped to a 17-month low, while a Eurozone recovery has stalled since Q1 – chart 6.

Chart 6

Chart 6 showing Real Narrow Money (% 6m)

The Eurozone story seems to be that higher bond yields triggered by fiscal loosening along with a stronger euro have offset ECB easing. Optimists argue that German fiscal stimulus is only now arriving but the impact could be balanced by an early stockbuilding downswing – the stockbuilding share of GDP rose by 0.7 pp in the year to Q2 and is above its long-run average.

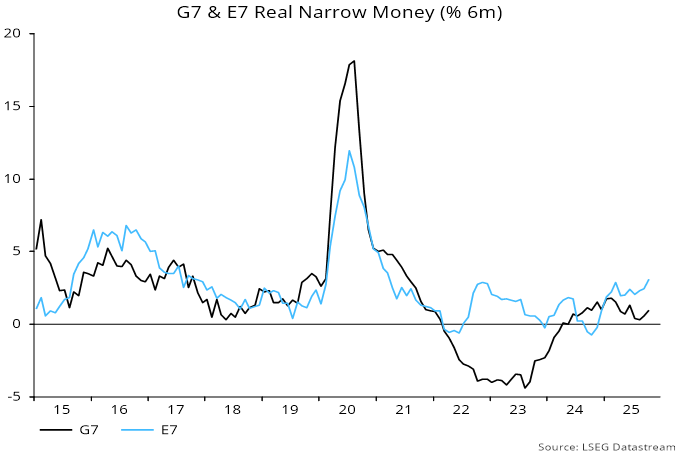
The recent decline in global six-month real narrow money momentum has been driven by the G7 component. Chinese momentum fell back in April-May but has recovered since, giving a modestly favourable signal for economic prospects.

The assumption of a Q1 2027 trough implies that the current stockbuilding cycle has entered its final 18 months. The 18-month windows before previous lows were usually negative for risk assets and marked by credit events or “crises” – chart 7. The possibility of simultaneous housing cycle weakness, as well outsized gains in the upswing phase of the current cycle, suggests greater-than-normal downside.

Chart 7

Chart 7 showing G7 Stockbuilding Cycle G7 Stockbuilding as % of GDP (yoy change)

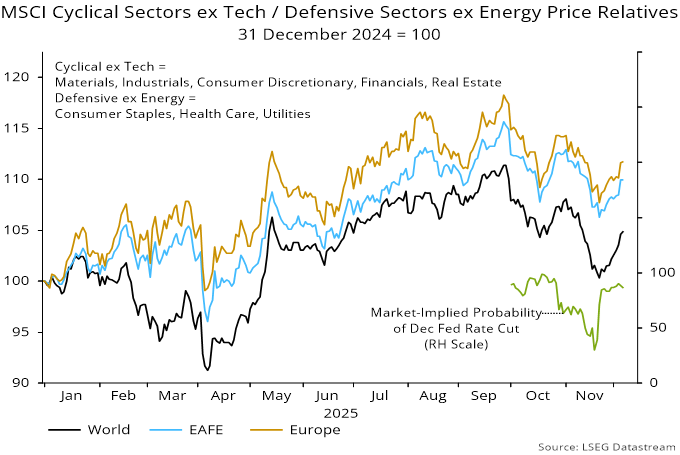
These 18-month windows were usually associated with cyclical equity market sectors underperforming defensives, following outperformance during the upswing (unusually strong in the current cycle). Stylewise, there was a weak tendency for quality to outperform, while momentum lagged its upswing gains significantly. The recent drawdown in relative performance of the MSCI EAFE Quality index versus MSCI EAFE was exceeded in magnitude and duration only in the early 1980s – chart 8.

Chart 8

Chart 8 showing MSCI EAFE Quality Return Relative to MSCI EAFE Comparison of Current & Previous Drawdowns

Six-month growth rates of global real narrow money and industrial output have been tracking closely with a small monetary excess on the latest readings – chart 9. The strength of markets appears to reflect a rise in the financial velocity of money more than ample liquidity, suggesting reversibility in the event of a cyclical deterioration in sentiment.

Chart 9

Chart 9 showing G7 + E7 Industrial Output & Real Narrow Money (% 6m)

The two monetary conditions historically favouring EM equities – E7 real money growth above the G7 level and global real money growth above industrial output expansion – are currently in place, suggesting EM outperformance in the event of a near-term further rise in markets.