Monetary trends suggest that China’s economy is better placed to withstand tariff damage than Japan’s.

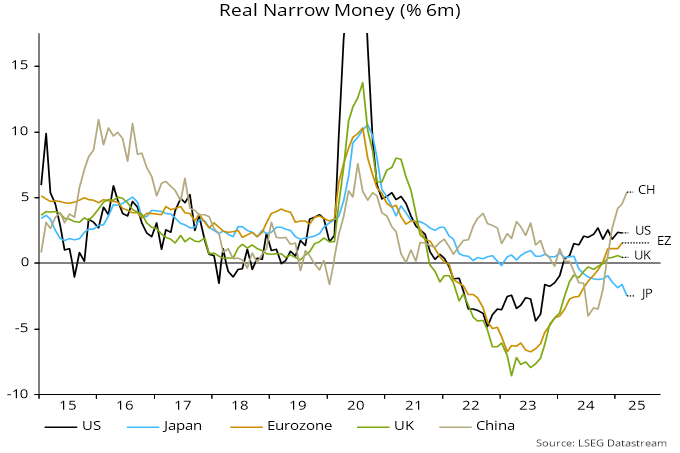
Chinese six-month real narrow money momentum rose further in March, reaching its highest level since August 2020. Japanese momentum moved deeper into contraction – see chart 1. (US March numbers will be released next week, with Eurozone / UK data the following week.)

Chart 1

Real narrow money (% 6m).

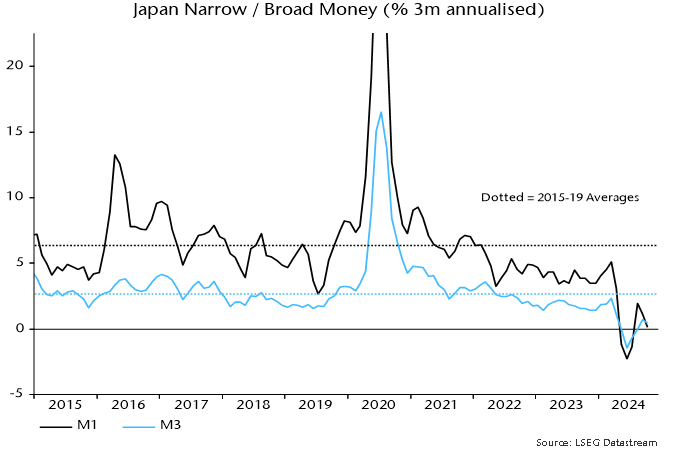
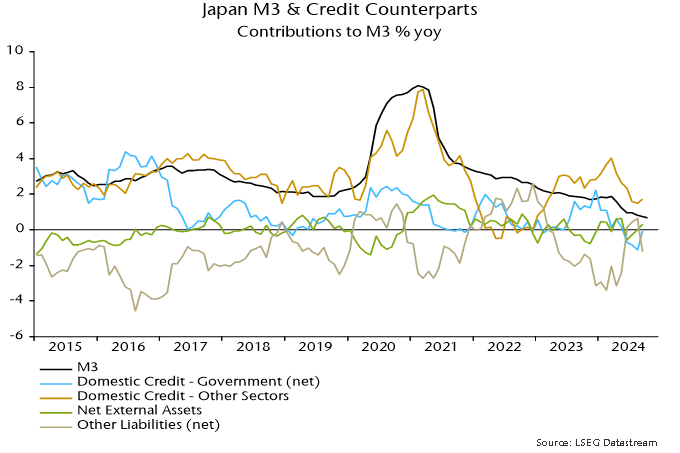
Inflation divergence has contributed to the wide gap but it mainly reflects nominal money trends: Japanese narrow money is contracting even in nominal terms.

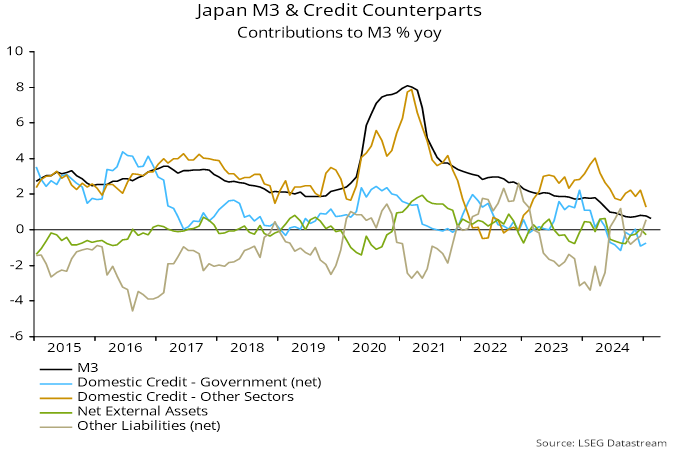
The Japanese fall is partly explained by money-holders switching out of sight deposits (included in narrow money) into time deposits (excluded), which now pay modest interest. Still, broad money trends are also weak: M3 grew by just 0.5% at an annualised rate in the six months to March. Broad money expansion has been dragged down by BoJ QT and a fall in bank lending to non-bank financial corporations.

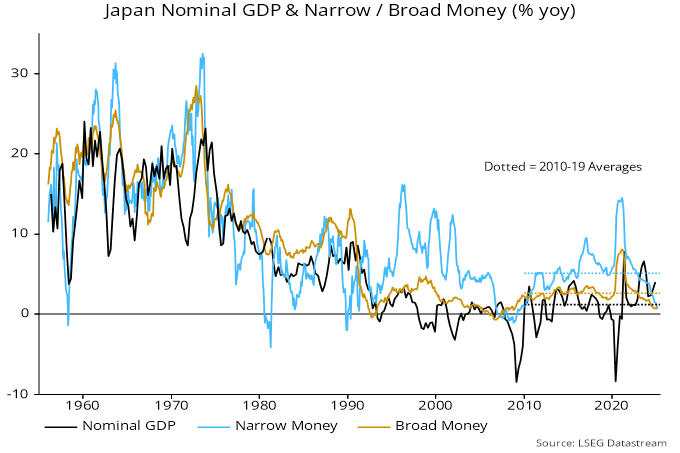
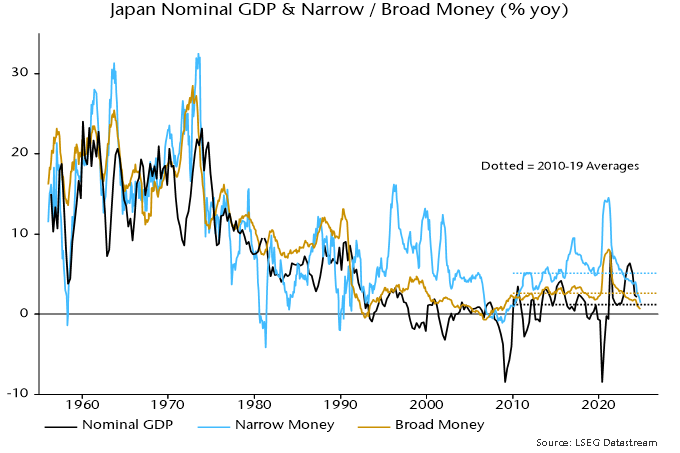
By contrast, six-month growth of Chinese broad money – on the preferred definition here excluding deposits held by financial institutions – was stable in March at a level close to the 2015-19 average. This pace was associated with solid nominal GDP expansion – chart 2.

Chart 2

China nominal GDP* (% 2q) & money / social financing* (% 6m). *Own seasonal adjustment.

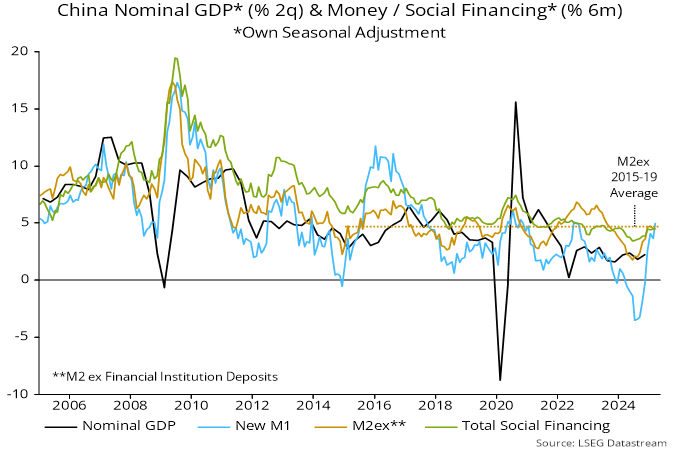
Broad money trends have been supported by PBoC and state bank purchases of government bonds issued to finance fiscal stimulus measures. In addition, six-month growth of bank lending has revived recently, despite a drag from debt swap operations (under which funds raised through bond issuance are used to repay bank loans of government-related entities).

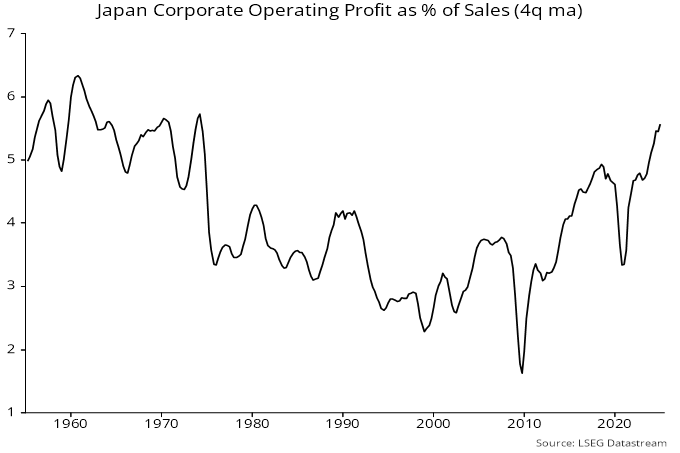
Previous posts suggested that Japanese monetary weakness would be reflected in downside economic and inflation surprises. The composite PMI output index fell sharply last month, to well below levels in the US, Eurozone, UK and China.

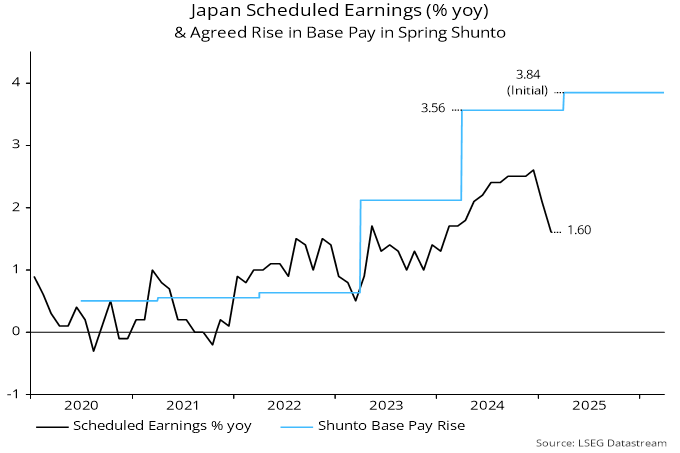
Annual growth of scheduled earnings, meanwhile, undershot expectations in February. Inflation believers have been relying on a developing wage-price spiral but bumper headline pay awards in the spring Shunto may not be representative of trends across the whole economy – chart 3.

Chart 3

Japan scheduled earnings (% yoy) & agreed rise in base pay in Spring Shunto.

Japanese inflation isn’t back and money trends suggest a coming major undershoot.

Annual all-items consumer price inflation was 4.0% in January, with Tokyo numbers suggesting a slowdown to 3.6% in February. The current overshoot reflects strength in food and energy prices (which rose by an annual 7.8% and 10.8% respectively in January). Core inflation excluding special effects was 1.6% in January and may have eased to 1.5% in February – see chart 1.

Chart 1

Chart 1 showing Japan Consumer Prices (% yoy)

Sub-2% core inflation in early 2025 is consistent with soft money trends two years ago: annual growth of broad money M3 was 2.1% in Q1 2023, below its 2010-19 average of 2.6%, associated with persistent headline / core undershoots.

Money trends, however, have weakened much further since early 2023. Annual growth of M3 and M1 fell to 0.6% and 0.8% respectively in February, the lowest since the GFC – chart 2.

Chart 2

Chart 2 showing Japan Nominal GDP & Narrow / Broad Money (% yoy)

Money growth was depressed last year by record f/x intervention and Bank of Japan QT, reflected in a contraction in banking system net lending to government. The intervention drag has ended but has been replaced by a fall in growth of credit to other sectors – chart 3.

Chart 3

Chart 3 showing Japan M3 & Credit Counterparts Contributions to M3 % yoy

The slowdown in the non-government credit measure in the M3 counterparts contrasts with stable growth of loans and discounts of major, regional and shinkin banks – chart 4. The former series has broader coverage, in particular including lending to financial institutions, which has contributed to recent cooling.

Chart 4

Chart 4 showing Japan Bank Lending (% yoy)

The consensus view that inflation is back rests on strong wage growth. This is being driven by real wage resistance to higher all-items inflation against a backdrop of a tight labour market.

Upward pressure on (real) wages, however, results in sustained inflation only if accommodated by monetary laxity – the opposite of current conditions. With low money growth bearing down on nominal demand, higher wages are likely to squeeze profit margins, which have been overinflated by yen weakness – chart 5.

Chart 5

Chart 5 showing Japan Corporate Operating Profit as % of Sales (4q ma)

Japanese money trends remain ominously weak, suggesting poor economic / market prospects and a return of inflation to unacceptably low levels.

Annual growth rates of broad money M3 and narrow money M1 fell to 0.7% and 1.5% respectively in October, well below 2010-19 averages of 2.6% / 5.1% and the lowest since the GFC – see chart 1.

Chart 1

Chart 1 showing Japan Nominal GDP & Narrow / Broad Money (% yoy)

Record f/x intervention resulted in monetary contraction in Q2 but a subsequent recovery has been minor, partly reflecting BoJ policy tightening. M3 and M1 grew at annualised rates of 0.5% and 0.1% in the three months to October – chart 2.

Chart 2

Chart 2 showing Japan Narrow / Broad Money (% 3m annualised)

Japanese economic prospects represent another test of “monetarist” vs. consensus forecasting approaches. The BoJ / consensus view is that above-potential economic growth, a tight labour market and a gradual rise in adaptive inflationary expectations will result in annual CPI inflation – on both the targeted ex. fresh food measure and the BoJ’s core index also excluding energy – remaining close to the 2% target in FY 2025 and FY 2026. The BoJ views risks as skewed to the upside, warranting a tightening bias.

The “monetarist” view, by contrast, is that 2022-23 inflation resulted from a temporary spike in money growth in 2020, with the effects extended by a big fall in the yen. With money growth well below the 2010-19 average, CPI inflation is heading back to, or beneath, its corresponding average of 0.5%, unless the exchange rate suffers a further collapse.

Headline CPI numbers have been affected by changes in energy and travel subsidies but six-month core momentum (on the standard international definition excluding all food as well as energy) has fallen back below 2% annualised, consistent directionally with the earlier slowdown in money growth – chart 3. The level of core momentum still incorporates the effects of yen weakness.

Chart 3

Chart 3 showing Japan Consumer Prices & Broad Money (% 6m annualised)

Chart 4 shows the contributions of the “credit counterparts” to annual M3 growth, with data available through September. Comparing with growth a year earlier, the largest drag has been a shift in domestic credit to government from expansion to slight contraction, reflecting the impact of f/x sales (which reduce government borrowing needs) and the BoJ moving from QE to QT.

Chart 4

Chart 4 showing Japan M3 & Credit Counterparts Contributions to M3 % yoy

A slowdown in domestic credit to other sectors has also exerted a negative influence. The measure shown is significantly broader than the BoJ’s series for loans and discounts by commercial banks but growth in the latter has also moderated recently, while the latest senior loan officer survey reported weaker expectations for credit demand – chart 5.

Chart 5

Chart 5 showing Japan Bank Loans & Discounts (% 6m) & BoJ Senior Loan Officer Survey Credit Demand Indicator* *Average of Demand Balances for Households & Firms

Is there still an overhang of money from the 2020 surge sufficient to sustain nominal economic expansion despite current low M3 growth? This can be answered using the “quantity theory of wealth” – the idea that asset prices and incomes adjust such that a geometric average of wealth and nominal GDP rises in line with broad money over the medium term.

Chart 6 shows that, using Q4 2018 as a base, a nominal GDP undershoot relative to broad money (i.e. a fall in conventionally defined velocity) has been offset by a wealth overshoot, resulting in the average moving slightly ahead of the level implied by the money stock in Q2 2024.

Chart 6

Chart 6 showing Japan Broad Money M3, Nominal GDP & Gross Wealth* Q4 2018 = 100 *Gross Wealth = Financial Assets (ex Money) of Domestic Non-Financial Sector + Residential Real Estate

The suggestion is that an “excess” money reserve has been exhausted and, unless asset prices fall, current low money growth will be reflected in nominal economic weakness.