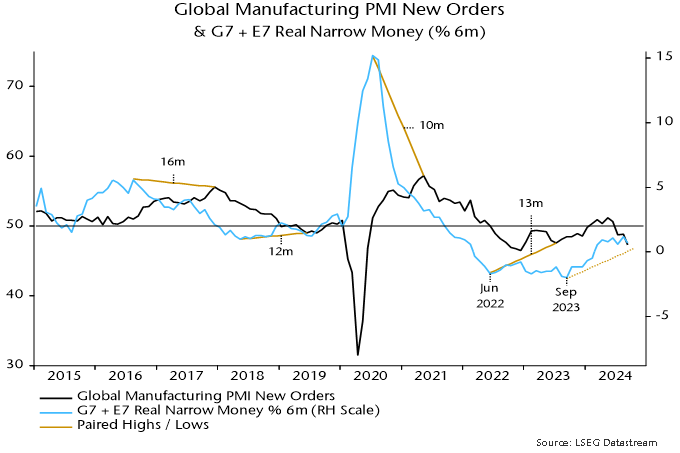
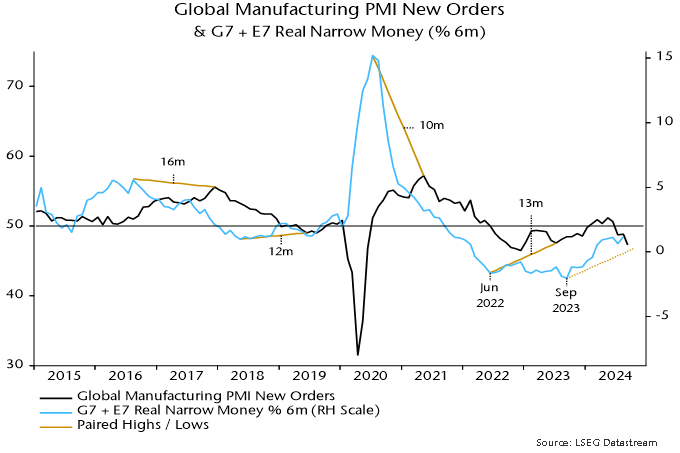
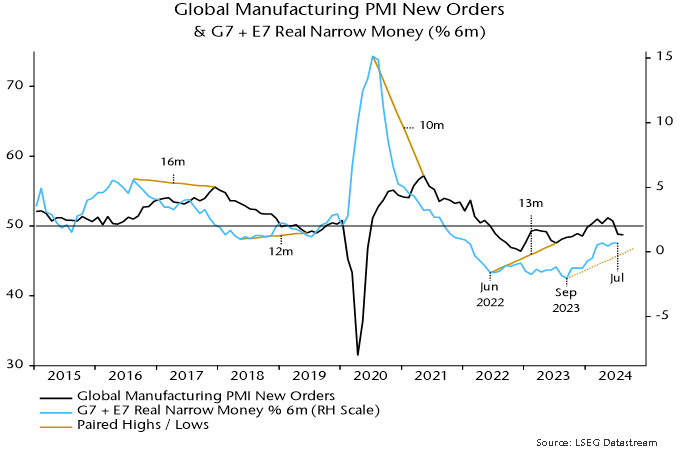
Global (i.e. G7 plus E7) six-month real narrow money momentum is estimated to have edged lower in September, based on monetary data covering 88% of the aggregate. Momentum has been moving sideways since the spring at a weak level by historical standards, suggesting that the global economy will expand at a below-trend pace through mid-2025 – see chart 1.

Chart 1

Chart 1 showing Global Manufacturing PMI New Orders & G7 + E7 Real Narrow Money (% 6m)

Note that the global narrow money measure incorporates an adjustment for a recent negative distortion to Chinese data from regulatory changes, i.e. momentum would be weaker than shown without this correction.

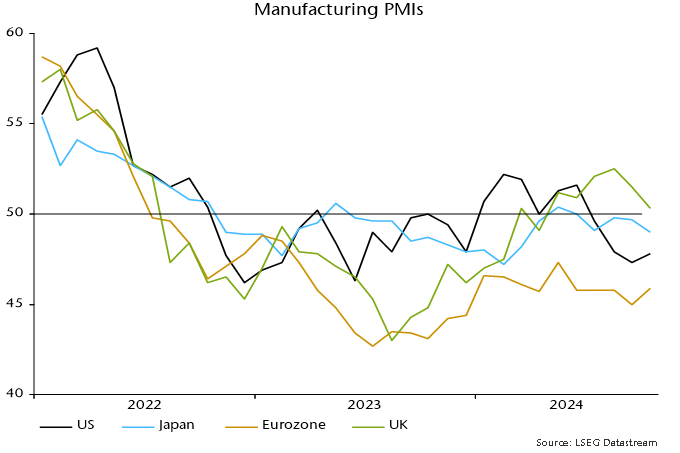
A low in real money momentum in September 2023 was expected here to be reflected in a decline in global industrial momentum – as proxied by the manufacturing PMI new orders index – into a low in late 2024. October flash results could be consistent with a bottoming out: PMIs fell in Japan and the UK but recovered slightly in the US and Eurozone – chart 2.

Chart 2

Chart 2 showing Manufacturing PMIs

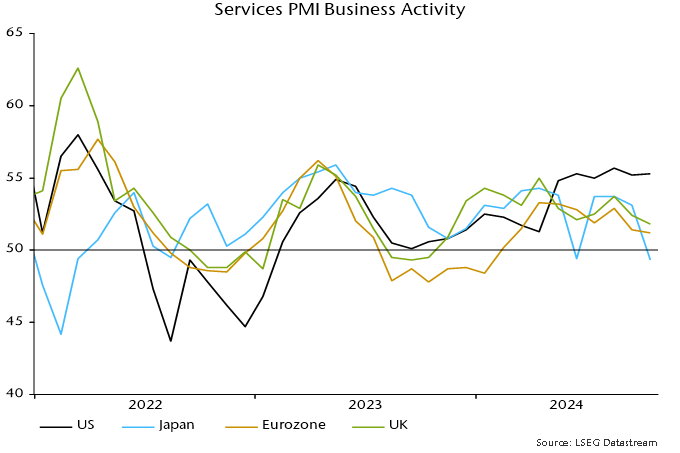
With money trends remaining weak, a manufacturing recovery into H1 2025 was expected to be limited and offset by a loss of momentum in services. Services business activity indices in the Eurozone and UK fell to 20- and 23-month lows respectively in October, according to flash results, with a sharper decline in Japan. US activity and new business indices, however, were strong, although the employment component remained sub-50.

Chart 3

Chart 3 showing Services PMI Business Activity

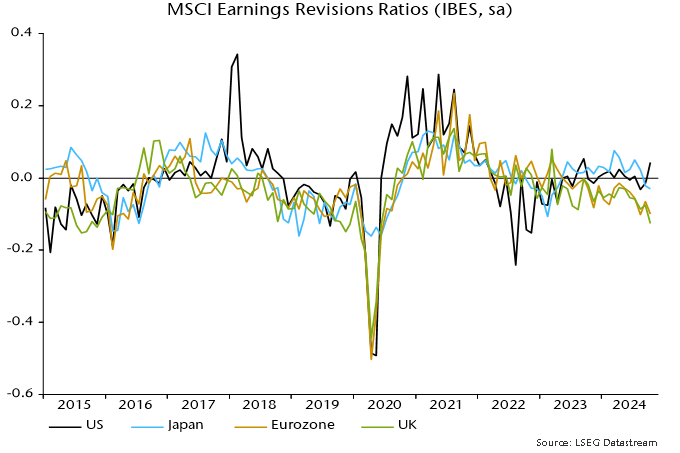
US relative strength is also evidenced by October earnings revisions ratios, with US net upgrades contrasting with weakness in Japan and Europe, particularly the UK – chart 4.

Chart 4

Chart 4 showing MSCI Earnings Revisions Ratios (IBES, sa)

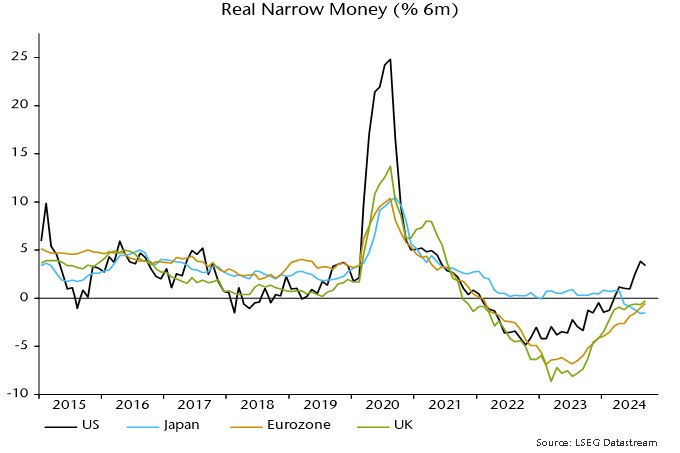
US economic outperformance is consistent with a recent wide gap between US and European / Japanese six-month real narrow money momentum. The expectation here was for a US pull-back in September due to an unfavourable base effect but this proved minor, with narrow money rising solidly again on the month – chart 5.

Chart 5

Chart 5 showing Real Narrow Money (% 6m)

Eurozone / UK real narrow money momentum continues to recover but disappointingly slowly, suggesting a more urgent need for policy easing. A slump in Japan, initially due to f/x intervention but sustained by BoJ policy tightening, signals likely further negative economic news.

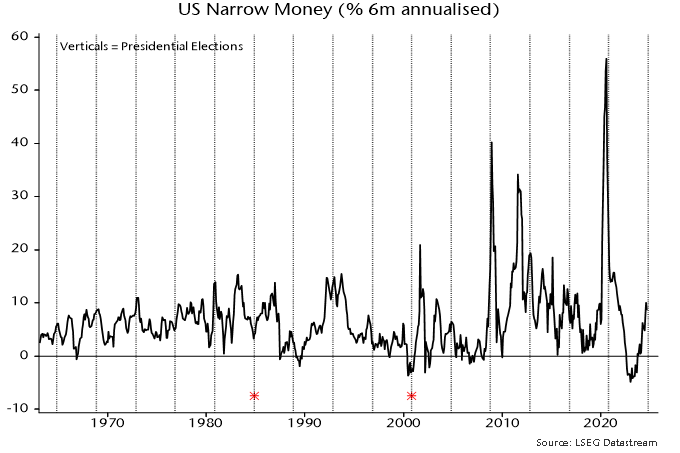
US narrow money acceleration started long before the September rate cut and hasn’t been mirrored by broader aggregates. One interpretation is that households / firms are accumulating “transactions” money in anticipation of increasing spending after the elections. Chart 6 suggests a tendency for narrow money momentum to pick up into presidential elections and reverse thereafter, with occasional notable exceptions (1984, 2000).

Chart 6

Chart 6 showing US Narrow Money (% 6m annualised)

Monetary prospects and cycle considerations suggest global economic strength in H2 2025 / 2026 but a “hard landing” – or at least a scare of one – may be necessary first.

Commentary here at mid-year proposed the following baseline scenario:

  • A “double dip” in global industrial momentum in H2 2024 with limited recovery in early 2025, reflecting the profile of real narrow money momentum with a roughly one-year lag.
  • Pass-through of industrial weakness to the services sector and – crucially – employment, the latter contrasting with experience during the first “dip” in 2022 when labour markets were in excess demand and unaffected.
  • A further decline in consumer price inflation rates to below target in H1 2025, echoing a fall in broad money growth to very low levels in H1 2023, assuming a typical two-year lag.
  • A rapid response of monetary policy-makers to downside labour market and inflation surprises, resulting in official rates falling by more by spring 2025 than markets expected in mid-2024.
  • A consequent strong pick-up in real narrow money momentum by spring 2025, laying the foundation for an economic boom starting in late 2025, consistent with the cyclical framework suggesting joint strength in the stockbuilding, business investment and housing cycles.

The near-term hard – or hard-ish – landing in this scenario is necessary to elicit policy easing sufficient to drive the later boom. Without it, the global economy could remain stuck in a slow-growth equilibrium into 2026, with policy rates kept above a neutral level despite low inflation.

Incoming news has been consistent with several elements of the baseline scenario but others require confirmation:

  • The global manufacturing PMI new orders index fell to a 21-month low in September. Global six-month real narrow money momentum bottomed in September 2023, signalling a likely PMI trough by end-2024 – see chart 1.

Chart 1

Chart 1 showing Global Manufacturing PMI New Orders & G7 + E7 Real Narrow Money (% 6m)

  • Real narrow money momentum has been moving sideways since the spring at a low level by historical standards, consistent with industrial momentum remaining weak in early 2025.
  • Manufacturing weakness appears to be transferring to services. The global services PMI new business index remained at an expansion-consistent level in September but output expectations fell sharply to a 23-month low – chart 2.

Chart 2

Chart 2 showing Global Services PMI New Business & Future Output

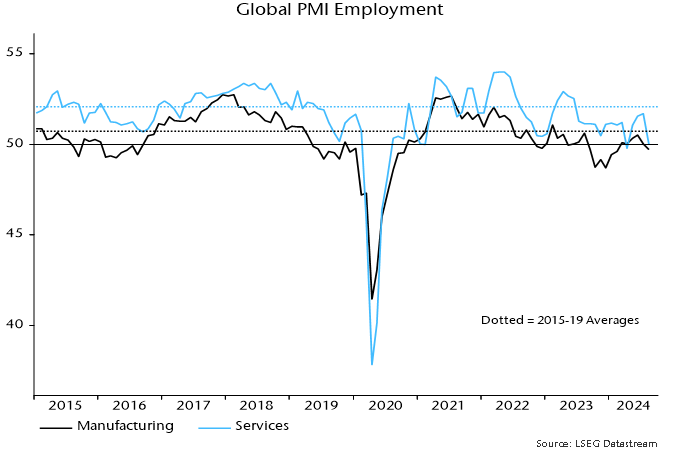
  • Employment weakness has yet to crystallise. The global composite PMI employment index is below a low reached during the first dip in 2022 but not yet in contraction territory (50.0 in September). The US economy has continued to add jobs, although payrolls numbers are probably still overstating growth and average weekly hours have fallen.
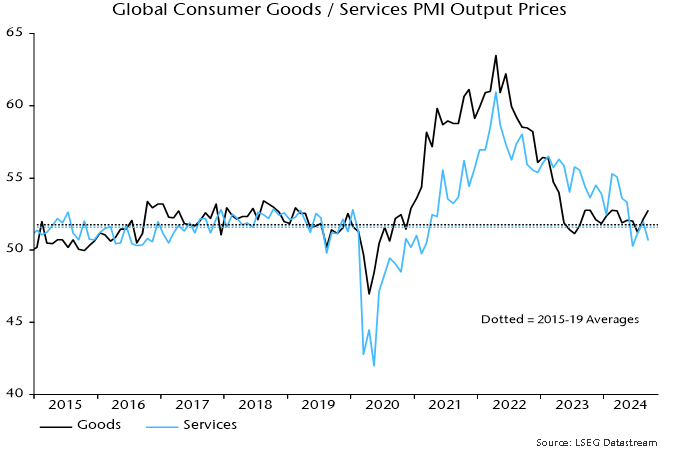
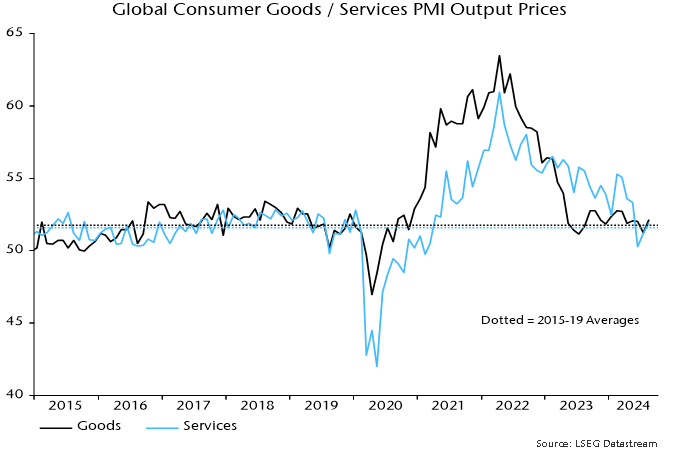
  • Inflation news has been favourable. Six-month headline / core consumer price momentum in the US and Eurozone has moved lower since mid-2024, while global PMI output price indices for consumer goods and services have stabilised close to their 2015-19 averages, when G7 annual core CPI inflation averaged 1.6% – chart 3.

Chart 3

Chart 3 showing Global Consumer Goods / Services PMI Output Prices

  • Monetary authorities have in most cases shifted dovishly since mid-year. A major Chinese policy pivot at quarter-end could lead to a strong rebound in narrow money growth, supporting the expectation of global acceleration.

To summarise, the baseline scenario is still on track but requires confirmation from early further deterioration in labour market news as well as continued inflation progress.

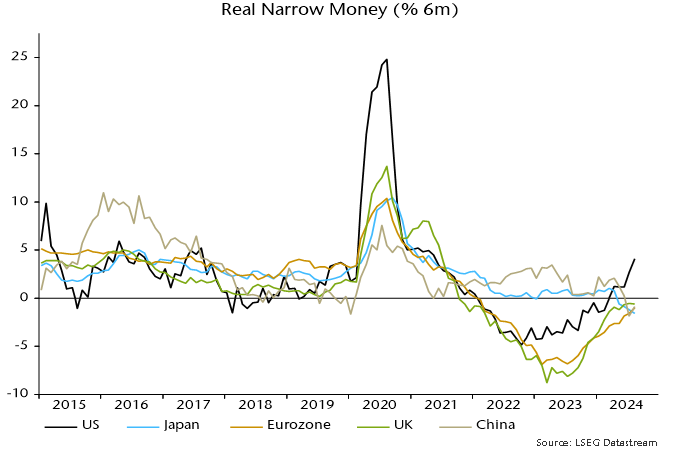
The stabilisation of global six-month real narrow money momentum at a weak level conceals significant geographical dispersion. A strong pick-up in the US has been offset by falls in China and Japan, while a slow recovery in the Eurozone has caught up with a stalling UK – chart 4.

Chart 4

Chart 4 showing Real Narrow Money (% 6m)

The rise in US momentum is puzzling and challenges the expected scenario of economic weakness and labour market deterioration into H1 2025. A near-term stall or reversal would reduce this tension and is plausible, with large monthly rises in March / April about to drop out of the six-month comparison.

Momentum remains negative across Europe but – except in the UK – has continued to recover, with a further acceleration expected as a pattern of rate cuts at successive policy meetings is established. UK-Eurozone monetary convergence is at odds with market themes of UK relative economic resilience and inflation stickiness, and incoming data could force the MPC to shift dovishly soon.

Interpretation of Chinese monetary trends has been clouded recent regulatory changes that have reduced the attractiveness of demand deposits, resulting in a switch into time deposits and money substitutes. The narrow money measure shown in chart 4 incorporates an adjustment but the “true” picture could be stronger or weaker. Previous large stimulus packages have fed rapidly through to monetary acceleration but – even if this occurs – economic momentum is likely to remain weak through Q2 2025, at least.

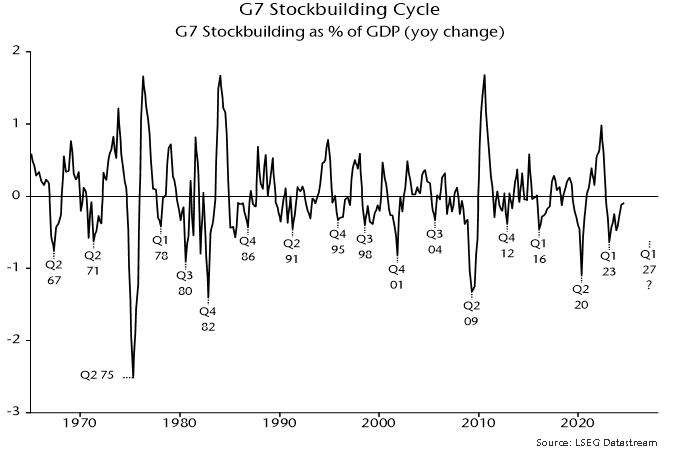
The cyclical framework used here judges current global economic weakness to reflect mid-cycle corrections in stockbuilding and business investment upswings, rather than new downswings in either cycle. The stockbuilding cycle (3-5 years) bottomed in Q1 2023 but an initial recovery due to an ending of destocking has fizzled as final demand has remained weak. The assumption is that policy easing will generate a second leg up in 2025, with a cycle peak possibly delayed until 2026.

The primary trend in the business investment cycle (7-11 years, last low 2020) is also still up, with the current correction probably attributable to a combination of restrictive interest rates, a profits slowdown and heightened uncertainty. Corporate financial balances (retained earnings minus capex) are in surplus in the US, Japan and Eurozone and a recovery in global economic momentum in 2025 could generate a strong “accelerator” effect on investment as animal spirits revive.

A key assumption is that the long-term housing cycle (average 18 years), which bottomed in 2009, will enjoy a final burst of strength in response to lower rates before peaking, possibly in 2026. One reason for believing that the upswing is incomplete is that peaks were historically associated with mortgage lending booms: annual growth of US residential mortgages reached double-digits before downswings into lows in 1957, 1975, 1991 and 2009. The high so far in the current cycle has been 9% (in 2022), with lower numbers in the Eurozone and UK.

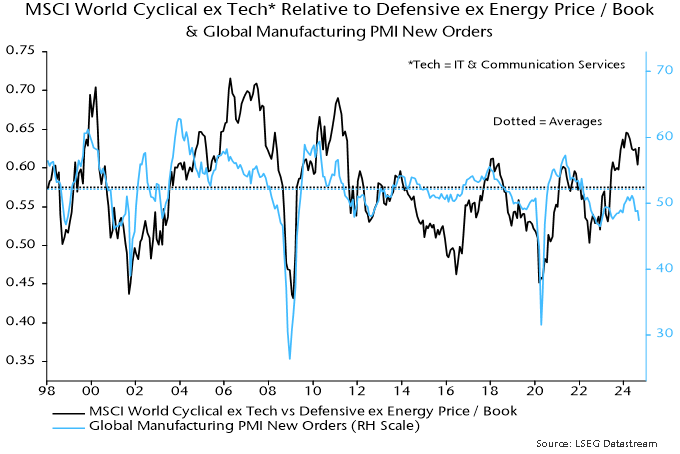
The mid-year commentary suggested that defensive equity market sectors would outperform as a H2 double dip unfolded. They did through early September but cyclical sectors rebounded on hopes of rapid Fed easing and large-scale Chinese stimulus. Even if forthcoming, the economic effects will be delayed and may already be discounted in relative valuations – chart 5.

Chart 5

Chart 5 showing MSCI World Cyclical ex Tech* Relative to Defensive ex Energy Price / Book & Global Manufacturing PMI New Orders *Tech = IT & Communication Services

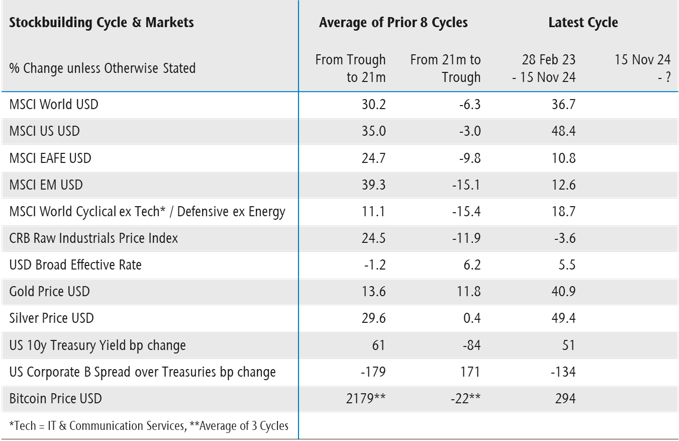
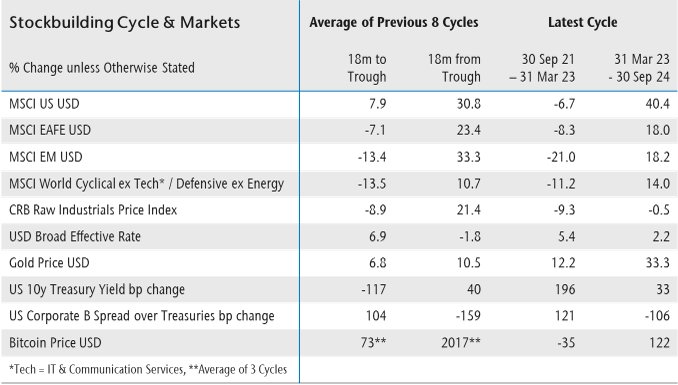
Markets have historically correlated with the stockbuilding cycle, so one approach to assessing investment potential is to compare returns so far in the current cycle with an average of prior upswings. As shown in table 1, US equities, cyclical sectors and gold have performed more strongly than the historical average in the 18 months since the cycle trough in Q1 2023, suggesting limited further upside and possible reversals, even assuming a late cycle peak.

Table 1

Table 1 showing Stockbuilding Cycle & Markets

International equities – particularly emerging markets – have, by contrast, underperformed relative to history in the current cycle, while commodity prices have been unusually weak. Though also likely to suffer in any near-term hard landing scare, these areas have catch-up potential in the baseline scenario of global economic acceleration through 2025 driven partly by the stockbuilding cycle upswing entering a second phase.

The “double dip” downturn in global manufacturing continued last month.

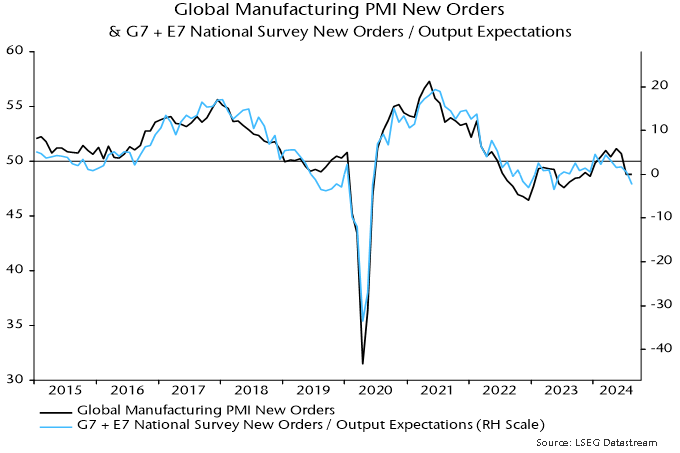
Global manufacturing PMI new orders fell steeply from a peak in May 2021 to a trough in December 2022 (first dip), with a subsequent recovery ending in May 2024. The second dip was confirmed by a sharp fall to below 50 in July, with the index unchanged in August – see chart 1.

Chart 1

Chart 1 showing Global Manufacturing PMI New Orders & G7 + E7 National Survey New Orders / Output Expectations

As the chart shows, an alternative global indicator based on national surveys weakened further last month.

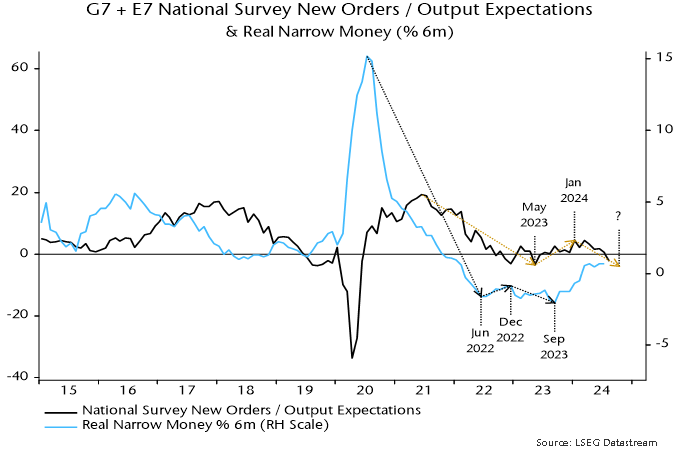
The alternative indicator implies a shorter interim recovery between the two dips than the PMI, starting from May 2023 and ending in January 2024. These timings align better with turning points in global six-month real narrow money momentum (low in June 2022, high in December 2022) – chart 2.

Chart 2

Chart 2 showing G7 + E7 National Survey New Orders / Output Expectations & Real Narrow Money (% 6m)

The September 2023 low in real money momentum suggests that the double dip will bottom out by end-2024.

A key issue is whether manufacturing weakness will now transfer to services.

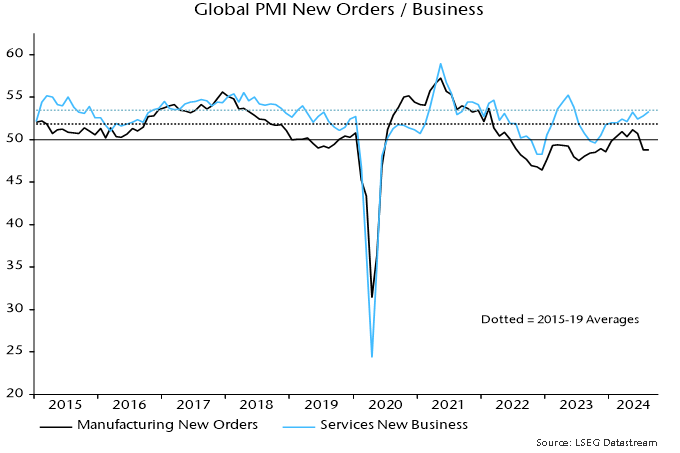
Services indicators remain mixed. The global services PMI new business index regained its May high last month and is close to the pre-pandemic average – chart 3.

Chart 3

Chart 3 showing Global PMI New Orders / Business

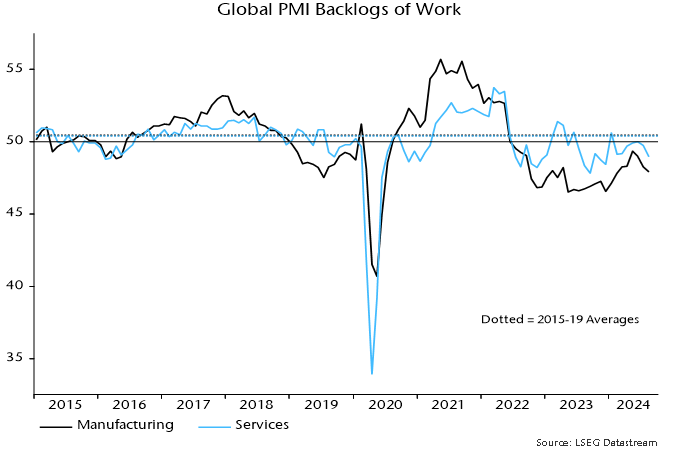
Order backlogs, however, fell further and are well below the corresponding average, as they are in manufacturing – chart 4. The decline suggests that current output is running above the (increased) level of incoming demand.

Chart 4

Chart 4 showing Global PMI Backlogs of Work

Accordingly, services firms are curbing hiring, with the sector employment index falling sharply in August and almost as weak as in manufacturing – chart 5.

Chart 5

Chart 5 showing Global PMI Employment

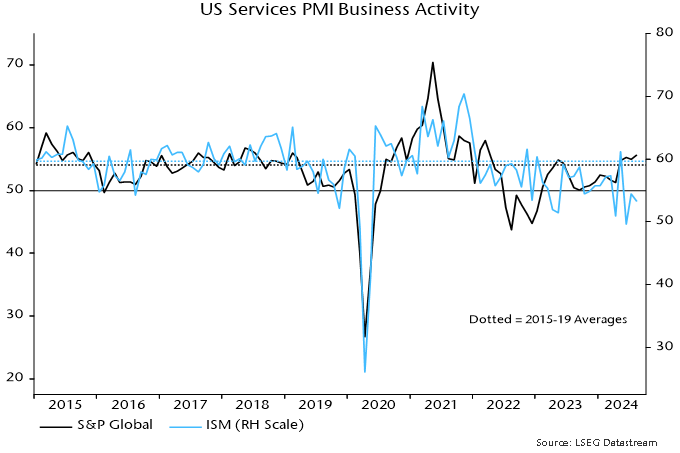
Rises in the global services PMI activity and new business indices last month partly reflected further strength in US components. The corresponding measures in the US ISM services survey are weaker, however, especially relative to pre-pandemic averages – chart 6.

Chart 6

Chart 6 showing US Services PMI Business Activity

The PMI surveys continue to support the expectation here of rapid easing of services price pressures and likely inflation undershoots by H1 2025. Output price indices for consumer goods and services remain close to their 2015-19 averages, a period when G7 annual core CPI inflation averaged 1.6% – chart 7.

Chart 7

Chart 7 showing Global Consumer Goods / Services PMI Output Prices

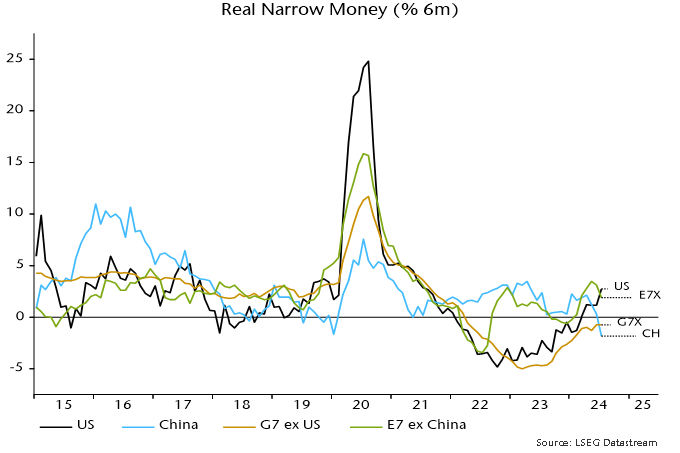
Global six-month real narrow money momentum is estimated to have moved sideways for a fourth month in July at a weak level by historical standards – see chart 1.

Chart 1

Chart 1 showing Global Manufacturing PMI New Orders & G7 + E7 Real Narrow Money (% 6m)

The baseline scenario here remains that global economic momentum – proxied by the global manufacturing PMI new orders index – will move down into late 2024, echoing a fall in real money momentum into September last year. Based on more recent monetary data, a subsequent recovery may prove limited, with weakness persisting well into H1 2025.

The unchanged July global real money momentum reading conceals a rise in the US offset by further weakness in China. The E7 ex. China component also cooled, while G7 ex. US momentum remained negative, moving sideways – chart 2.

Chart 2

Chart 2 showing Real Narrow Money (% 6m)

The Chinese series incorporates an adjustment* for a recent portfolio shift by non-financial enterprises from demand to time deposits in response to a regulatory change (a clampdown on payment of supplementary interest by banks). Chinese momentum would be significantly more negative without this adjustment, while the global series would be at its weakest level since February. (The adjustment may, however, underestimate the negative distortion to Chinese narrow money.)

Chart 3 shows additional DM detail. Real narrow money momentum is relatively strong in Canada and Australia as well as the US.

Chart 3

Chart 3 showing Real Narrow Money (% 6m)

Japan moved deeper into negative territory but recent weakness partly reflects f/x intervention, so may abate.

Real money momentum is higher in the UK than the Eurozone but the difference is small, with both still negative. Recent UK economic outperformance is unlikely to last.

The pick-up in US real narrow money momentum suggests improving economic prospects but confirmation is required and lags should be respected.

The US July reading was boosted by a favourable base effect – narrow money contracted by 0.6% month-on-month in January. The base effect remains favourable for August but turns significantly negative in September / October.

Six-month growth of US broad money is weaker than for narrow and has edged lower since May, though hasn’t yet fallen to the extent suggested by a contractionary shift in the joint influence of Treasury financing operations and Fed QT, discussed previously. The latest Treasury financing projections imply that this influence will turn expansionary again in Q4.

For perspective, US six-month real narrow money momentum had recovered to the current level in September 2008 as the financial crisis was reaching a crescendo with the recession having nine more months to run. In the prior 2001 recession, the current level was reached three months before the economy hit bottom. In both cases, the NBER business cycle dating committee had yet to determine that a recession had begun.

*The adjustment assumes that the share of demand deposits in total bank deposits of non-financial enterprises would have been stable at its March level in the absence of the regulatory change. The adjustment does not take into account any shift from bank deposits to non-monetary instruments (e.g. wealth management products) or effects on other money-holders.

The assessment here remains that the global economy has entered a “double dip” currently focused on manufacturing but likely to extend to services / labour markets, reigniting worries about a hard landing. Economic weakness is expected to be accompanied by an inflation undershoot into H1 2025.

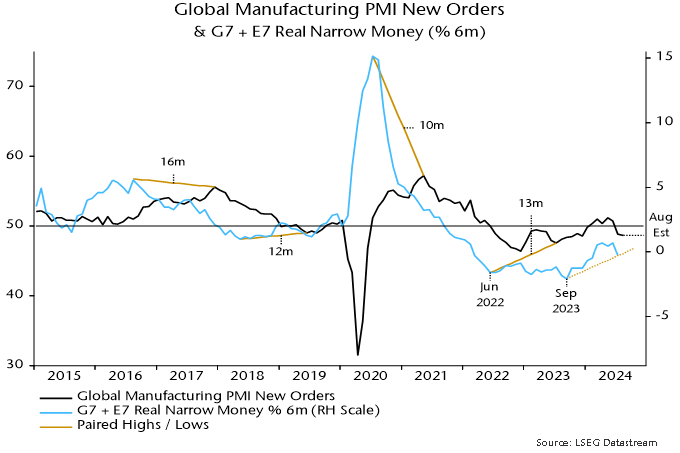
DM flash manufacturing PMI results for August were mixed across countries but on balance weak, suggesting a further small reduction in global manufacturing PMI new orders following a July plunge to below 50 (assuming no change for China and other non-flash countries) – see chart 1.

Chart 1

Chart 1 showing Global Manufacturing PMI New Orders & G7 + E7 Real Narrow Money (% 6m)

Services results were again much stronger than for manufacturing but there are hints of emerging weakness in a fall in output expectations since May and a drop in US / Eurozone employment indices to below 50 this month.

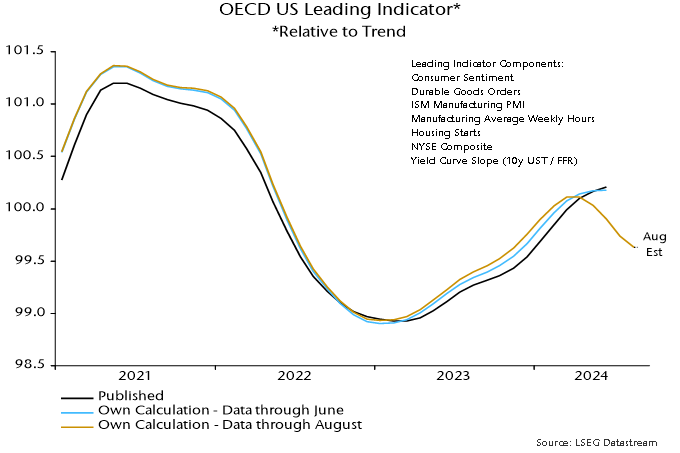
A previous post suggested that the OECD’s US composite leading indicator has reversed lower since publication of the last official data point, for June. An update based on partial data points to a further decline in August – chart 2. The OECD will release July / August data for its indicators on 5 September.

Chart 2

Chart 2 showing OECD US Leading Indicator* *Relative to Trend

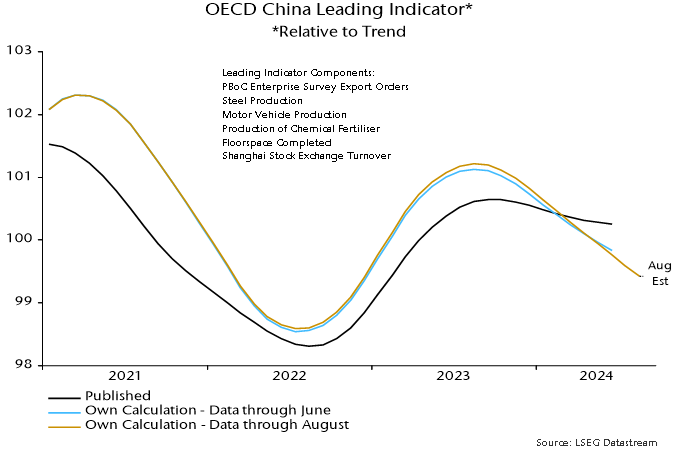
The OECD’s Chinese leading indicator has been falling since late 2023 and the decline is estimated to have continued in July / August – chart 3.

Chart 3

Chart 3 showing OECD China Leading Indicator* *Relative to Trend

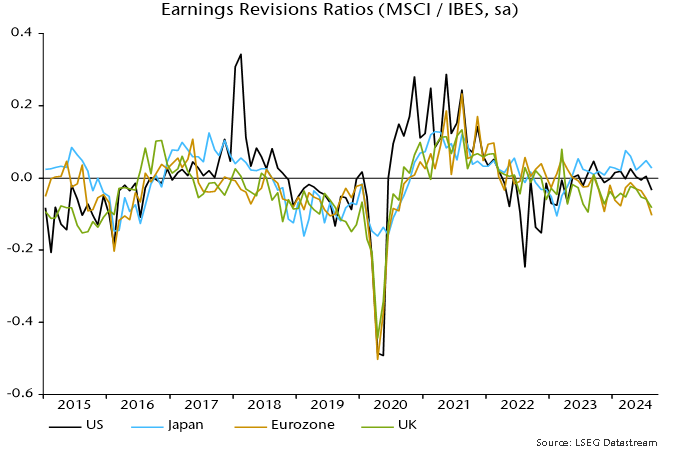
Weaker economic momentum and pricing power are feeding through to company earnings. Revisions ratios have turned down since April in the US, Eurozone and UK, with the August Eurozone reading the weakest since 2020 – chart 4.

Chart 4

Chart 4 showing Earnings Revisions Ratios (MSCI / IBES, sa)

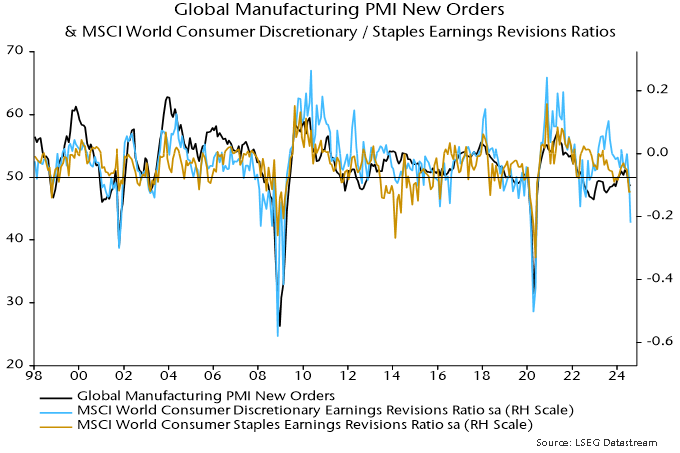
By MSCI World sector, August revisions ratios were most negative in consumer discretionary followed by energy, consumer staples and materials. The ratios for consumer discretionary and staples were the weakest since 2020, suggesting that a fall-off in consumer demand has been a key driver of the renewed downturn in manufacturing – chart 5.

Chart 5

Chart 5 showing Global Manufacturing PMI New Orders & MSCI World Consumer Discretionary / Staples Earnings Revisions Ratios

This week’s announcement by the BLS of a preliminary 818,000 or 0.5% downward revision to the March 2024 level of non-farm payrolls, meanwhile, raises the possibility that US employment has already stalled.

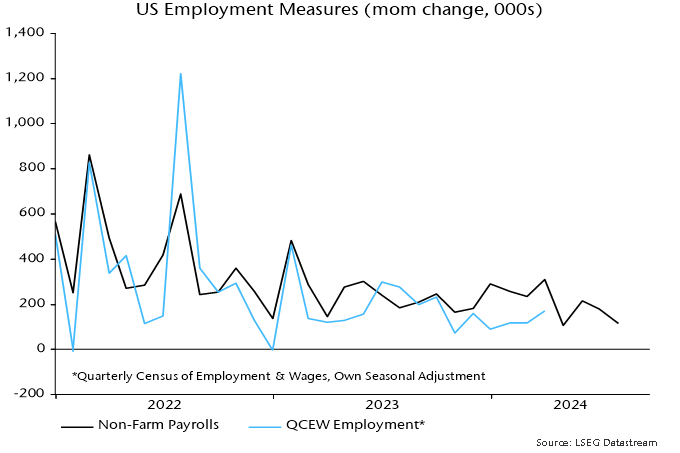
The revision is based on the comprehensive Quarterly Census of Employment and Wages (QCEW). A monthly QCEW employment series is available through March but is not seasonally adjusted. Chart 6 compares the monthly change in non-farm payrolls, as currently reported before incorporating the revision, with the change in a seasonally-adjusted version of the QCEW measure.

Chart 6

Chart 6 showing US Employment Measures (mom change, 000s)

The increase in non-farm payrolls was 133k per month higher than growth of the seasonally-adjusted QCEW series during Q1. If overstatement of this magnitude has continued since Q1, reported growth of 108k and 114k in non-farm payrolls in April and July could imply small declines in “true” employment in those months.