Eurozone services price momentum is “unsticking” as expected, supporting the forecast of sub-2% 2025 inflation.

post in September suggested that the ECB staff’s latest inflation forecast – like earlier projections – would be undershot.

With November’s favourable surprise, annual headline and core (i.e. ex. energy and food) consumer price inflation are on course to average 2.2% and 2.7% respectively in Q4, versus ECB September central projections of 2.6% and 2.9%.

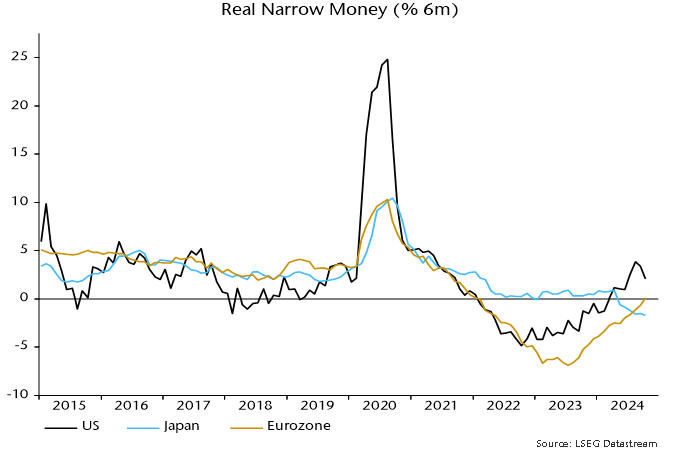
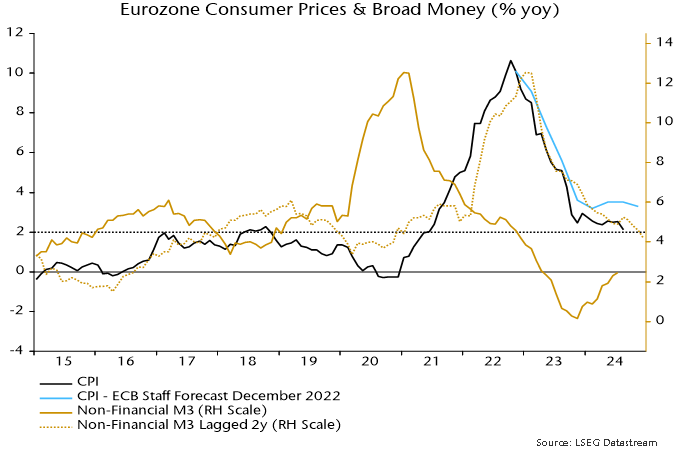
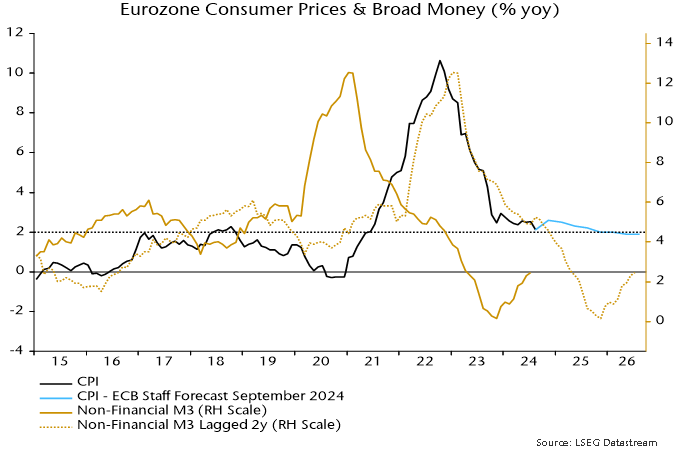
Six-month headline / core momentum is still loosely tracking the profile of broad money growth two years earlier, a relationship suggesting a further decline and undershoot of the 2% target – see chart 1.

Chart 1

Chart 1 showing Eurozone Consumer Prices & Broad Money (% 6m annualised)

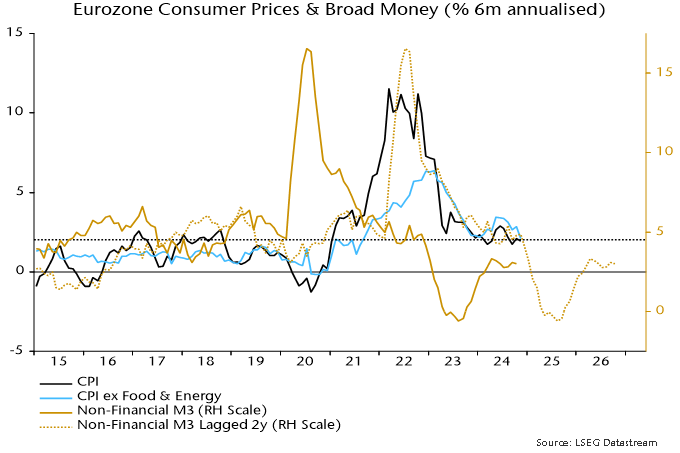
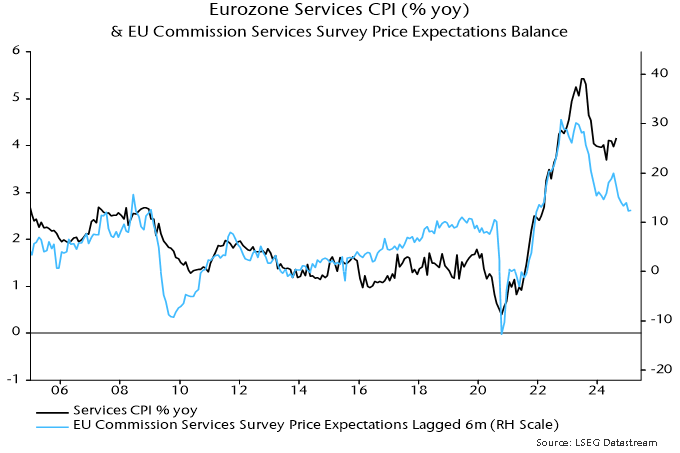
A fall in six-month core momentum to 2.1% annualised in November was driven by a sharp slowdown in services prices, which fell marginally on the month (ECB seasonally adjusted series).

Previous posts questioned central banks’ focus on “sticky” services inflation. Monetary conditions determine aggregate inflation, with the component breakdown partly shaped by “exogenous” factors. Earlier weakness in energy / food and core goods prices suppressed headline inflation while allowing consumers to spend more on services, delaying price deceleration in that sector. The suggestion was that services disinflation would speed up as downward pressure on goods prices eased.

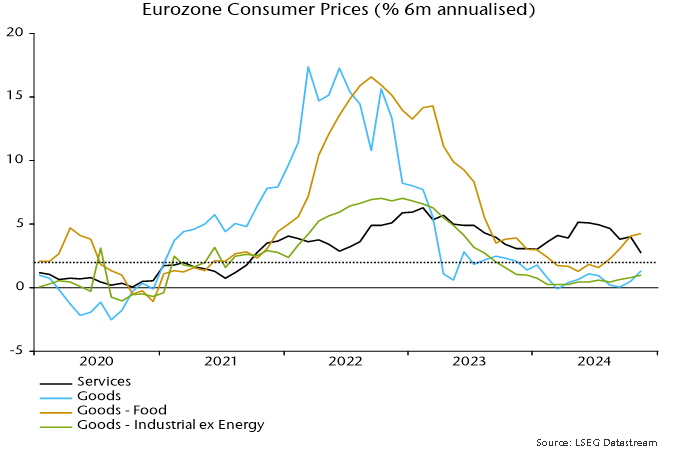
This appears to be playing out: six-month goods momentum has recovered, mainly reflecting food price reacceleration and a slower fall in energy costs, with the headline impact neutralised by a “surprise” services slowdown – chart 2.

Chart 2

Chart 2 showing Eurozone Consumer Prices (% 6m annualised)

The “monetarist” relationship, taken at face value, implies a period of falling prices in 2025. The judgement here is to downplay this possibility and regard the monetary signal as directional rather than giving strong guidance about the level of price momentum.

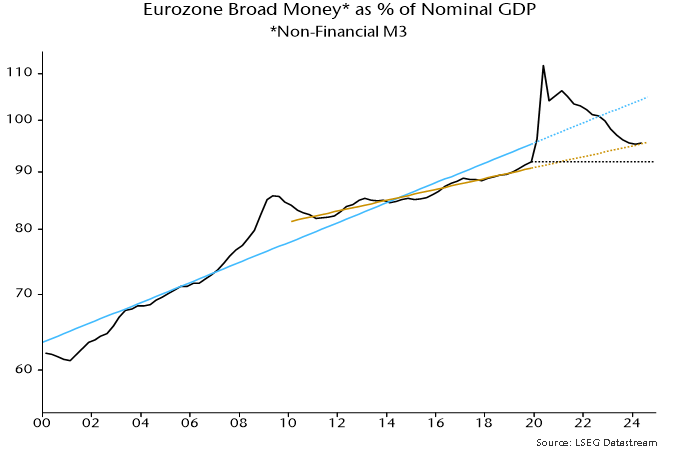
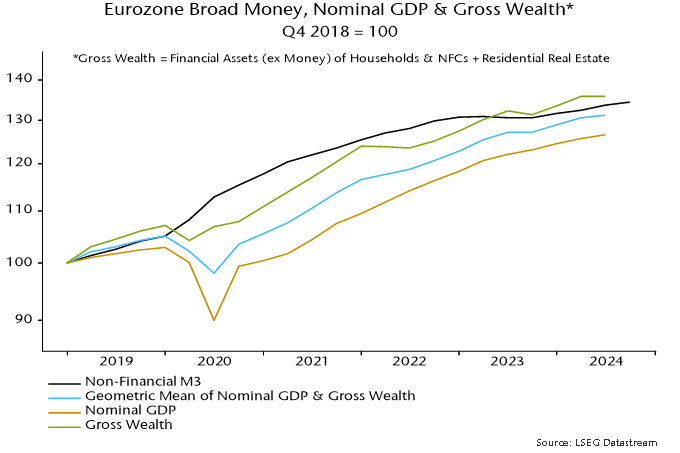
The stock of money could still be above “equilibrium”, implying a cushion against deflation. This question can be addressed using the “quantity theory of wealth” – the idea that asset prices and incomes adjust such that a geometric average of wealth and nominal GDP rises in line with broad money over the medium term.

Chart 3 shows that, using Q4 2018 as a base, nominal GDP has lagged broad money significantly while wealth has slightly outpaced it. The nominal GDP / wealth average was still 2% short of the level implied by the money stock as of Q2 2024.

Chart 3

Chart 3 showing Eurozone Broad Money, Nominal GDP & Gross Wealth* Q4 2018 = 100 *Gross Wealth = Financial Assets (ex Money) of Households & NFCs + Residential Real Estate

A small “excess” money cushion, along with recent currency weakness, may head off an extreme scenario but money trends still suggest a sustained inflation undershoot and a need for further policy easing to achieve medium-term realignment.

Eurozone money trends are improving but remain too weak to support economic optimism, while country details highlight French stress.

post in June noted that six-month real narrow money momentum was still significantly negative, suggesting that a minor economic recovery in H1 2024 would give way to a H2 “double dip”. The PMI composite output index fell from 50.9 in June to a flash reading of 48.1 in November.

Six-month real money momentum has risen further since June but was still barely positive in October. It has, however, crossed above Japan and narrowed a shortfall with the US, implying improving relative prospects – chart 1.

Chart 1

Chart 1 showing Real Narrow Money (% 6m)

Consensus gloom about Germany may be overdone. Six-month nominal narrow money momentum has swung into positive territory since mid-year, catching up with Spain / Italy – chart 2.

Chart 2

Chart 2 showing Narrow Money* (% 6m) *Non-Financial M1 Deposits

French momentum, by contrast, remains negative, with a recovery stalling in September / October.

French narrow money weakness appears to reflect low confidence and spending intentions rather than deposit flight (so far). Annual growth of all bank deposits slowed sharply in September / October but is still on a par with in Germany – chart 3.

Chart 3

Chart 3 showing Bank Deposits of Eurozone Residents* (% yoy) *Excluding Central Government

France’s deficit in the TARGET system rose by €34 billion in September to a record €175 billion, which could signal a capital outflow related to the political / fiscal crisis. There has, however, been no corresponding increase in Germany’s surplus, for which an October number is available – chart 4.

Chart 4

Chart 4 showing TARGET Balances (£ bn)

Monetary considerations argue that the ECB’s latest inflation forecast, like earlier projections, will be undershot.

Annual growth of broad money – as measured by non-financial M3 – returned to its pre-pandemic (i.e. 2015-19) average of 4.8% in October 2022. Allowing for a typical two-year lead, this suggested that annual CPI inflation would return to about 2% in late 2024 – see chart 1. The August reading was 2.1% (ECB seasonally-adjusted measure).

Chart 1

Chart 1 showing Eurozone Consumer Prices & Broad Money (% yoy)

The ECB staff forecast in December 2022 was more pessimistic, projecting annual inflation of 3.3% in Q4 2024. The forecast for that quarter was still up at 2.9% in June 2023 after natural gas prices had collapsed.

Annual broad money growth continued to plunge in 2023, reaching a low just above zero in November, since recovering to a paltry 2.5%. Simplistic monetarism, therefore, suggests that inflation will move below target in 2025 and remain there into 2026 – chart 2.

Chart 2

Chart 2 showing Eurozone Consumer Prices & Broad Money (% yoy)

The September 2024 ECB staff forecast, by contrast, shows inflation rising in Q4 and remaining above 2% until Q4 2025.

The monetarist relationship, taken at face value, implies a period of annual price deflation in H2 2025 / H1 2026. The judgement here is to downplay this possibility and regard the current monetary signal as directional rather than giving strong guidance about levels.

It is possible that the stock of money is still above an “equilibrium” level relative to nominal GDP. The current ratio is below its 2000-19 trend but in line with the 2010-19 trend, and higher than at end-2019 – chart 3. There may still be “excess” money to act as a deflation cushion.

Chart 3

Chart 3 showing Eurozone Broad Money* as % of Nominal GDP *Non-Financial M3

The forecast of a target undershoot requires services inflation – an annual 4.2% in August – to break lower. The price expectations balance in the EU services survey has displayed a (loose) leading relationship with annual services inflation historically, with the current reading consistent with a move down to about 2.5% in H1 2025 – chart 4.

Chart 4

Chart 4 showing Eurozone Services CPI (% yoy) & EU Commission Services Survey Price Expectations Balance