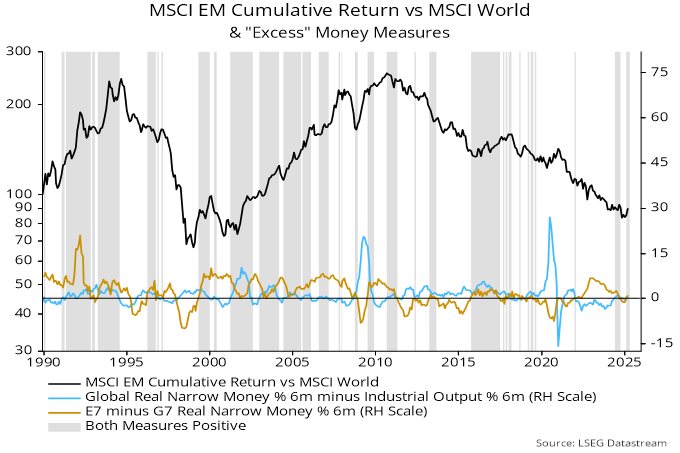
Monetary trends suggest that the global economy will remain soft in H1 2025, while inflation rates will fall further, undershooting targets. Cycle analysis holds out a prospect of economic reacceleration later in the year but risk assets might have limited further upside even in this scenario, although international / EM equities might regain relative performance.
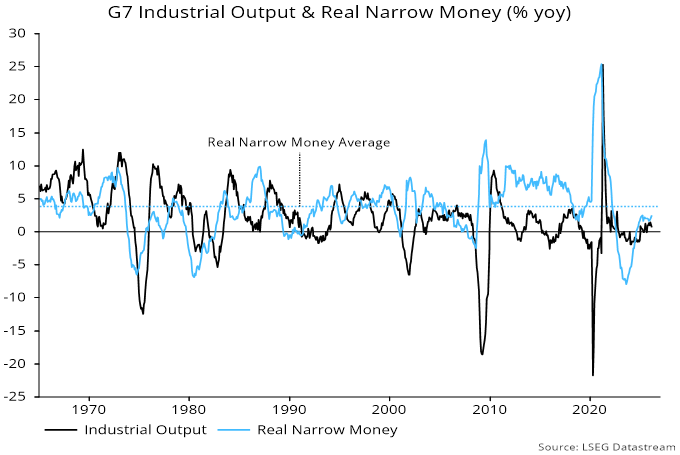
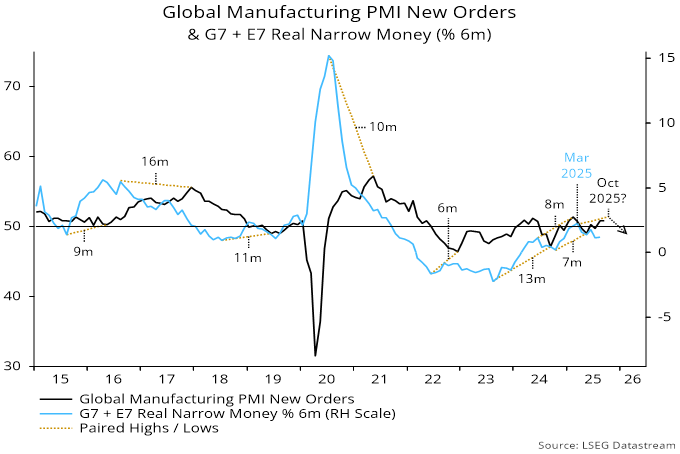
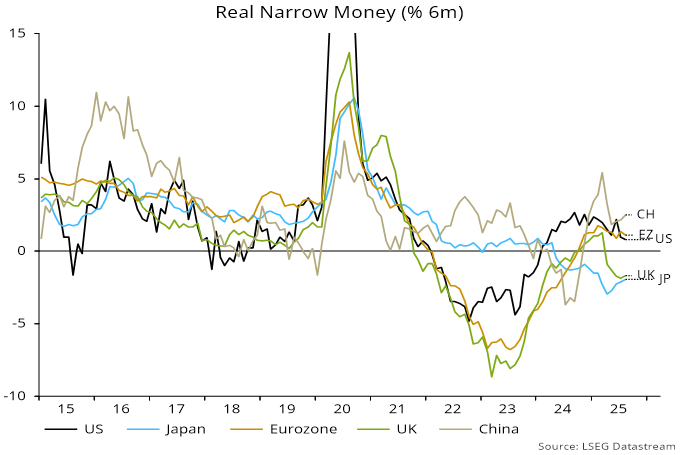
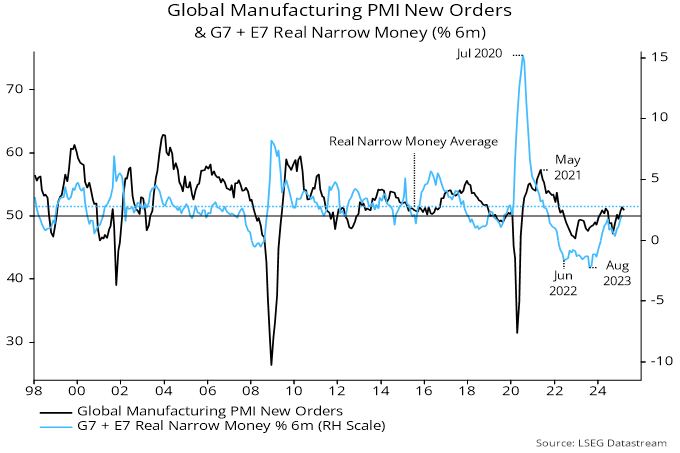
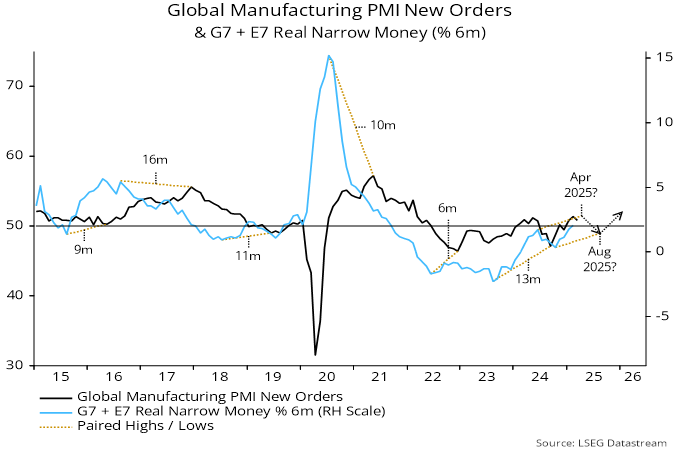
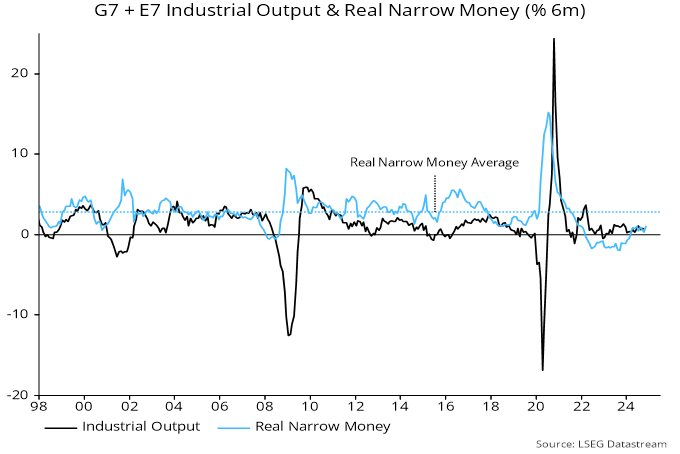
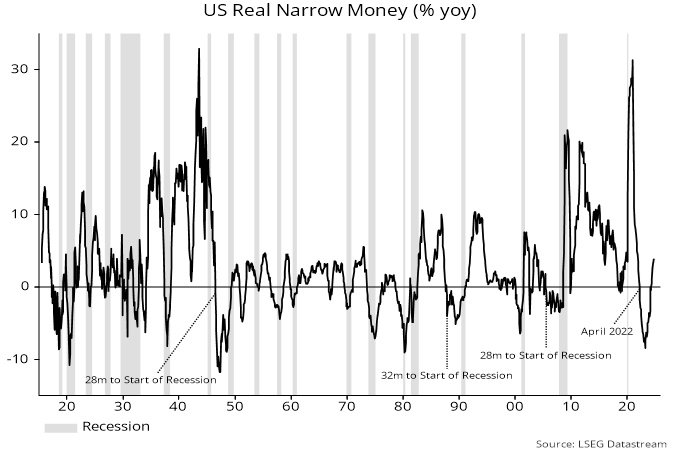
Global six-month real narrow money momentum recovered from a low in September 2023 into Q2 2024 but has since moved sideways at a weak level by historical standards – see chart 1. Based on a normal six to 12 month lead, this suggests below-trend economic growth through Q2 2025, at least.
Chart 1
Economies exhibiting monetary weakness are at greater risk from negative policy or other shocks. As an example, a fizzling-out of a recovery in UK six-month real narrow money momentum in H1 2024 signalled an approaching growth stall but the Budget tax shock appears to have tipped the economy into contraction.
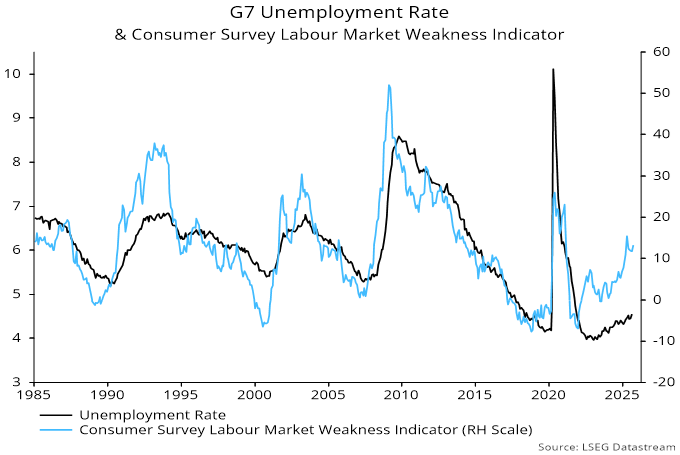
With job openings / vacancy rates back in pre-pandemic ranges, below-trend global growth is likely to be associated with greater deterioration in labour markets than in 2024. In economics parlance, a movement down the Beveridge curve may be approaching a gradient shift such that a further fall in vacancies will be associated with a significant unemployment rise.
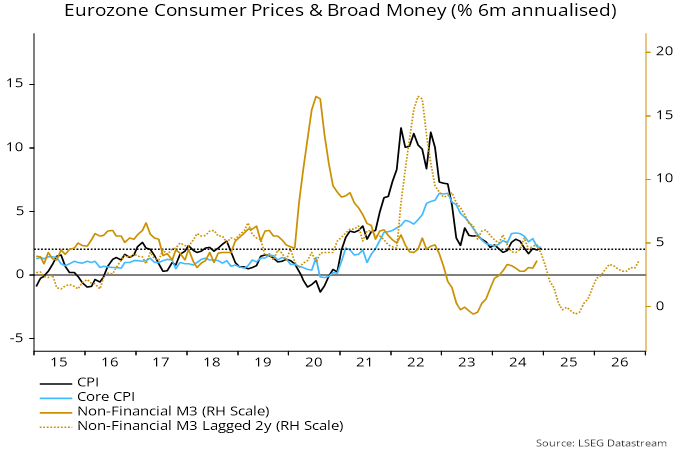
A further issue for monetary economists is the “false” US recession signal of 2022-23. Most annual contractions in US real narrow money historically were associated with recessions, and all on the scale of the 2023 decline – see chart 2. On three occasions (highlighted), however, the interval between the start of the contraction and the onset of recession was unusually long, i.e. up to 32 months.
Chart 2
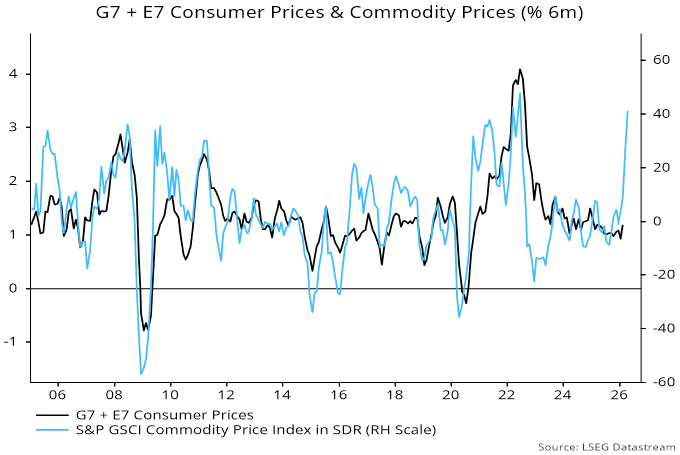
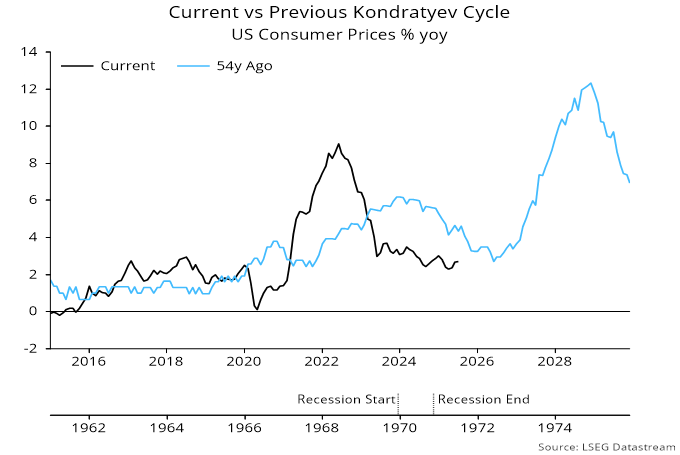
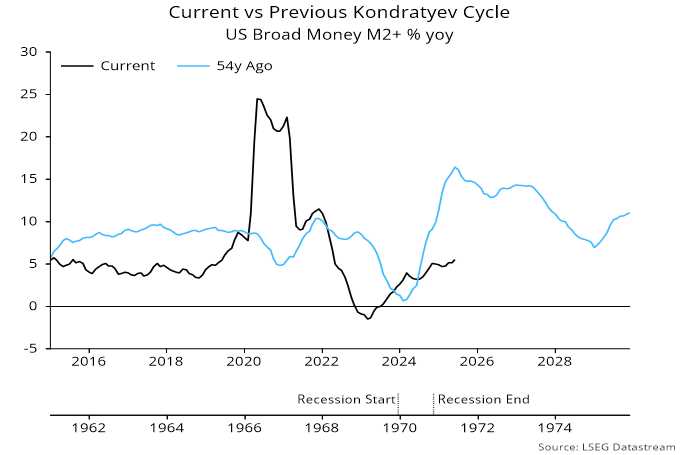
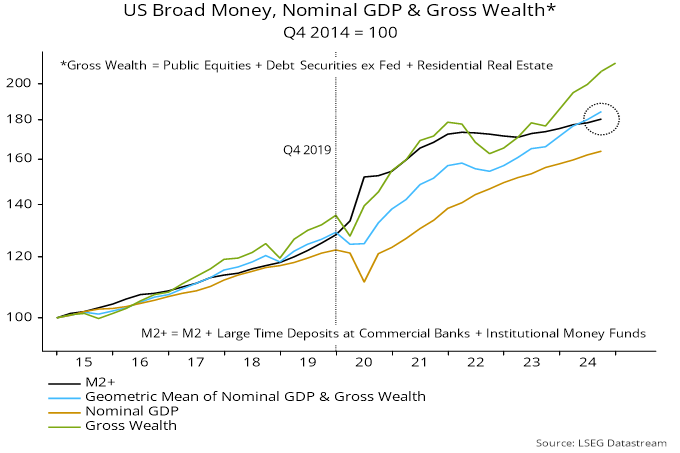
On inflation, the monetarist rule of thumb that price momentum follows the direction of broad money growth roughly two years earlier suggests a further slowdown into undershoot territory in H1 2025. Chart 3 shows the relationship for the Eurozone but the message of headline / core deceleration is the same for the US, Japan and the UK.
Chart 3
Global PMI output price indices in manufacturing and services are close to 2015-19 averages, when headline / core inflation averages were below target.
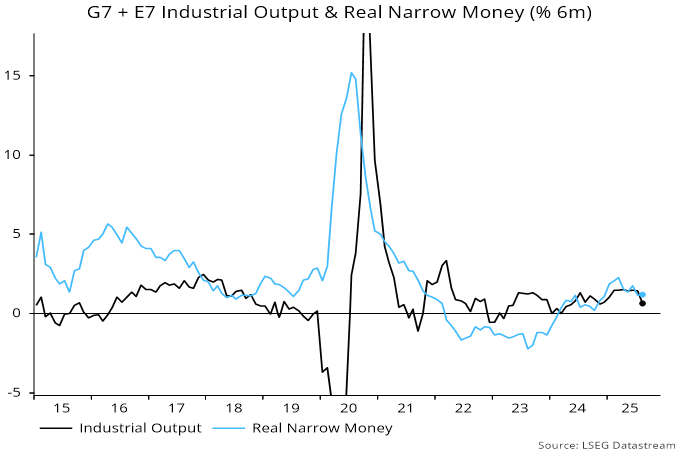
Financial market prospects, on the “monetarist” view, depend on whether there is “excess” or “deficient” money relative to the economy’s needs. Two flow measures of global excess money were used here historically – the gap between six-month rates of change of real narrow money and industrial output, and the deviation of the annual change in real money from a slow moving average. A “safety first” approach of holding global equities only when both measures were positive would have outperformed buy-and-hold significantly over the long run.
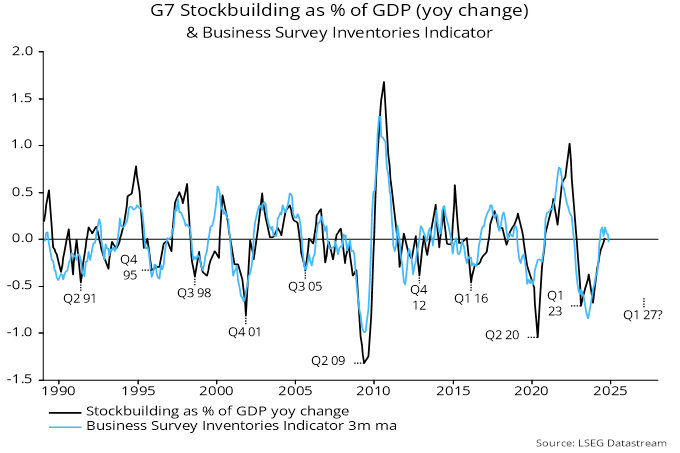
The flow measures, however, remained mixed / negative in 2023-24, understating the availability of money to boost markets because they failed to capture a stock overhang from the 2020-21 monetary surge. To assess whether this stock influence remains positive, the approach here has been to use a modified version of the quantity theory in which the money stock is compared with an average of nominal GDP and gross wealth.
Chart 4 shows that an average of US nominal GDP and gross wealth remained below the level implied by the money stock through mid-2024, consistent with a positive stock influence on asset prices / the economy. Equivalent analysis for Japan and the Eurozone shows the same. In all three cases, however, the nominal GDP / wealth average moved ahead of the money stock during H2 2024, implying that stock and flow indicators are now aligned in suggesting a neutral / negative backdrop.
Chart 4
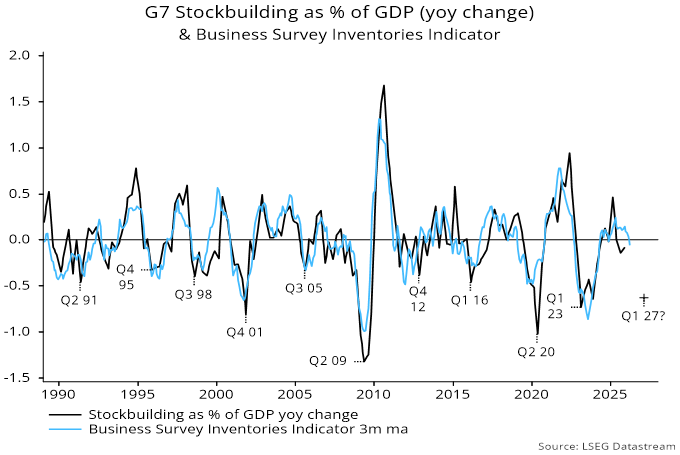
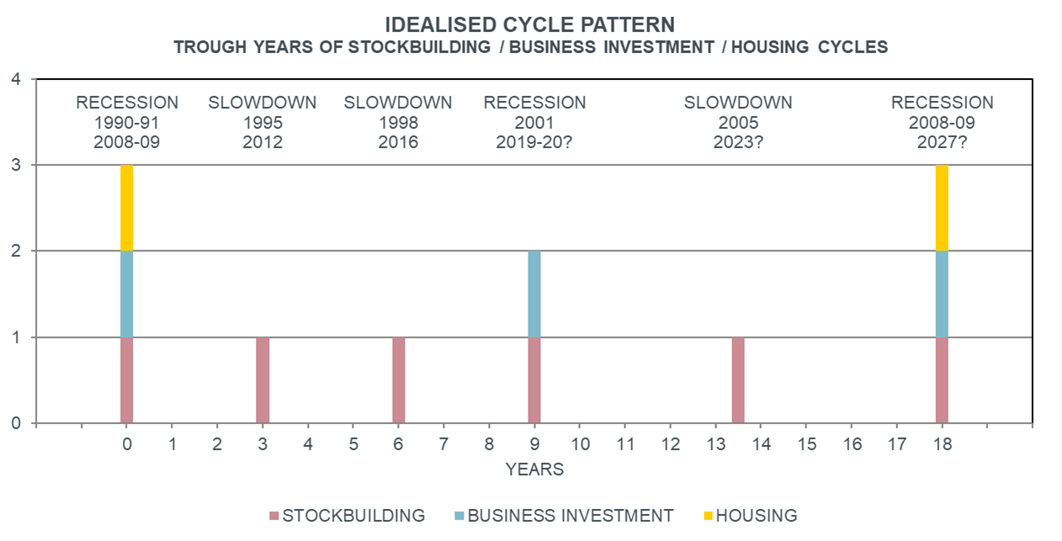
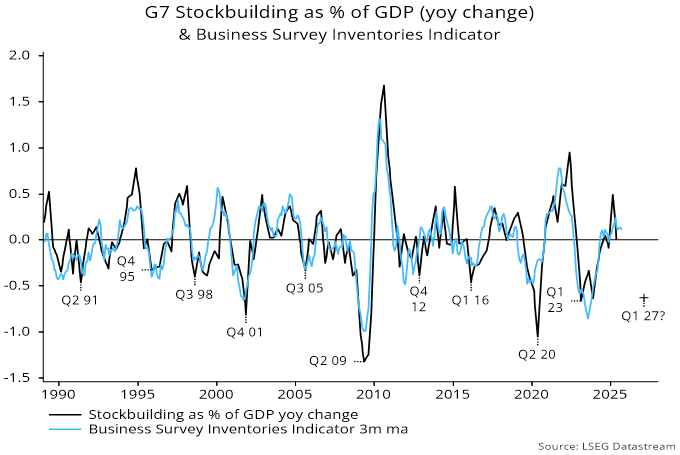
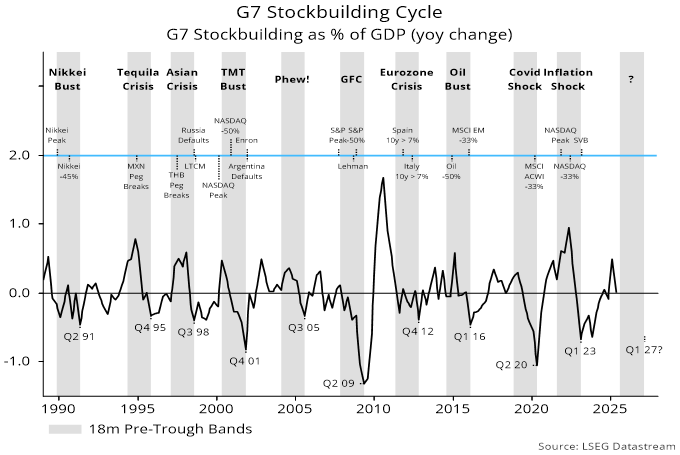
While monetary indicators suggest near-term softness, cycle analysis holds out a prospect of stronger economic performance later in 2025 and in 2026. A key consideration is that the stockbuilding and business investment cycles appear some way from reaching peaks, with the next lows unlikely before H2 2026 and 2027 respectively.
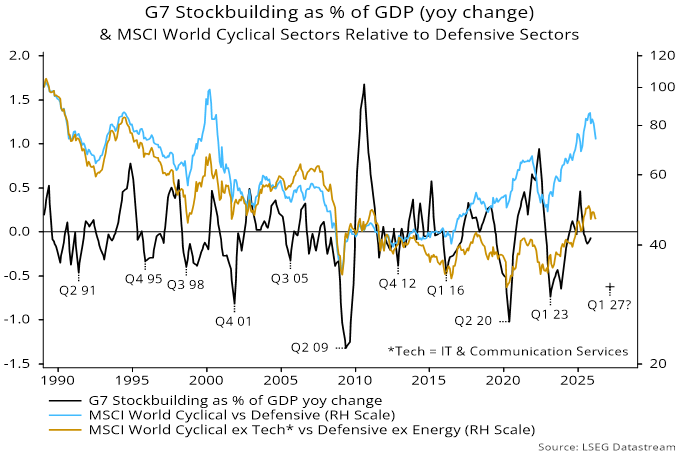
The last trough in the stockbuilding cycle is judged to have occurred in Q1 2023, with national accounts inventories data and business surveys suggesting that the upswing is around its mid-point – chart 5. The previous cycle was shorter than the 3.5 year average, so the current one could be longer, with a low as late as H1 2027. An associated downswing might not start until H1 2026.
Chart 5
The 7-11 year business investment cycle appears to have bottomed in 2020, although a case could be made that this was a false low due to the pandemic, with the last genuine trough reached following a mild downswing in 2015-16. On the more plausible former view, the next low is scheduled for 2027 or later, implying potential for a 2026 boom.
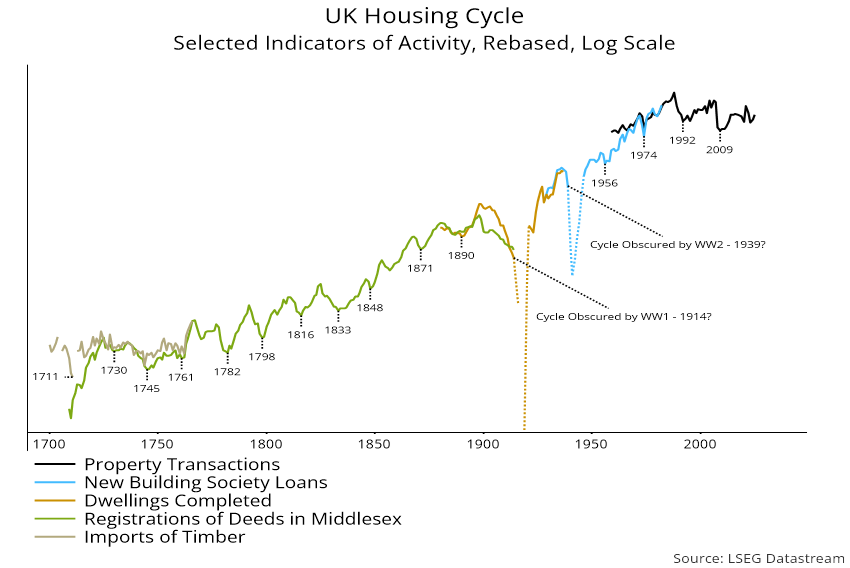
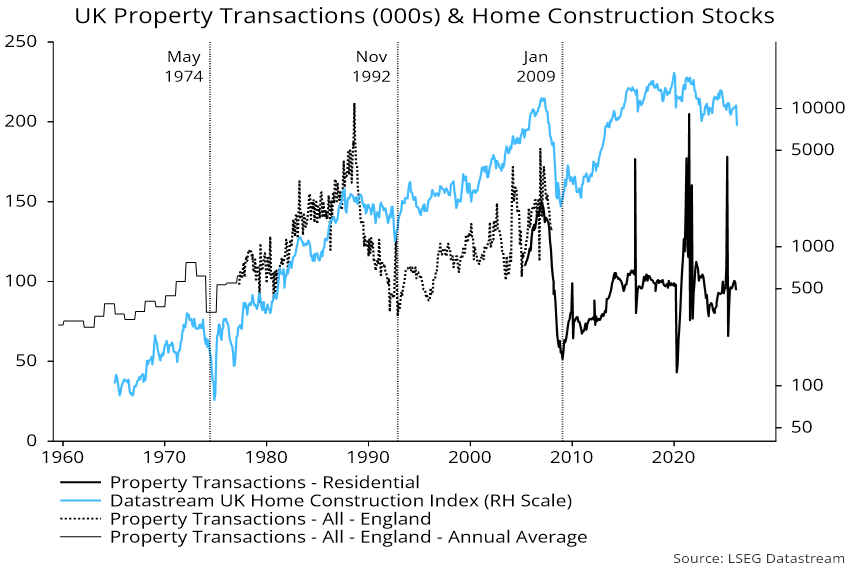
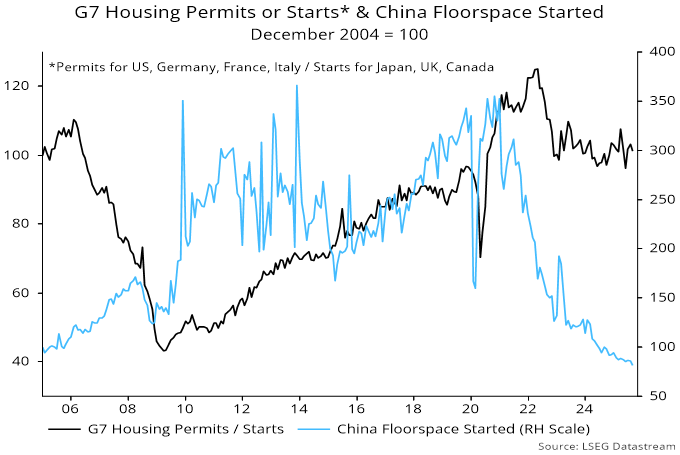
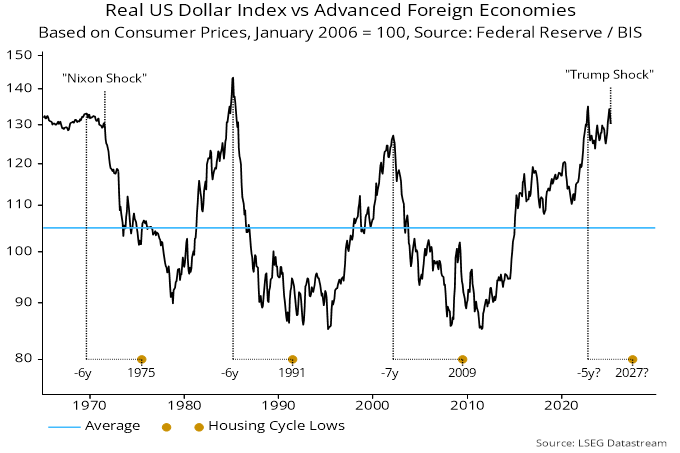
The longer-term housing cycle, which bottomed in 2009 and has averaged 18 years, is in the time window for a peak but significant weakness could be delayed until H2 2026 or later.
Monetary and cycle signals could be reconciled if near-term economic weakness / favourable inflation news triggers faster monetary policy easing and a strong pick-up in money growth into mid-year.
Would such a scenario be associated with further significant gains in risk assets? The history of the stockbuilding cycle suggests not.
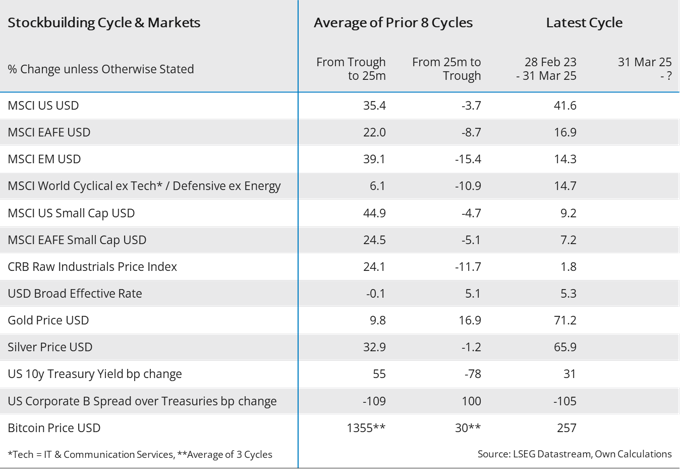
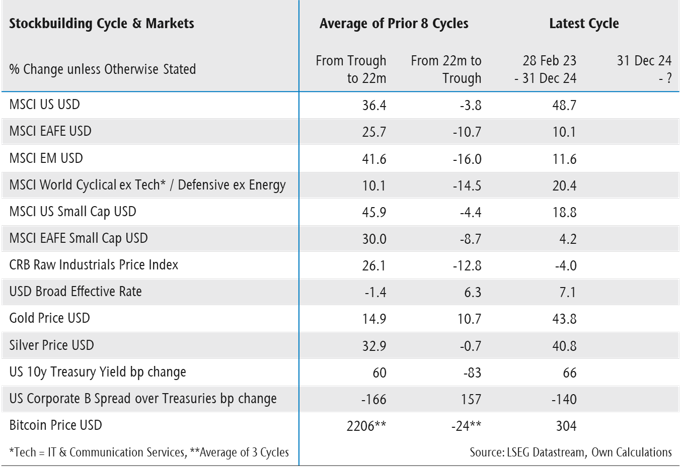
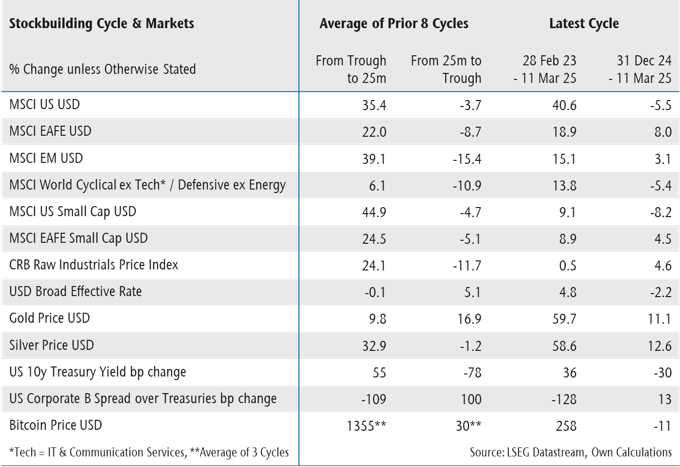
Risk assets typically rally strongly in the first half of a stockbuilding cycle, partially retracing gains in the run-up to the next trough. Table 1 compares movements so far in the current cycle with averages at the same stage of the previous eight cycles, along with changes over the remainder of those cycles. US equities, cyclical sectors and precious metals have outperformed relative to history, suggesting a stronger likelihood that they will lose ground between now and the next trough.
Table 1
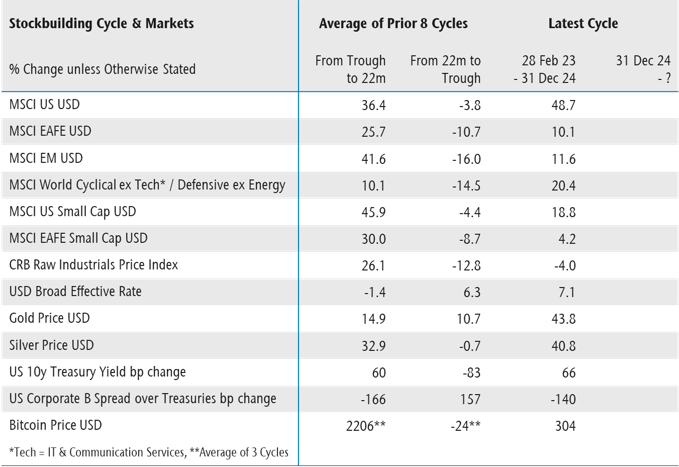
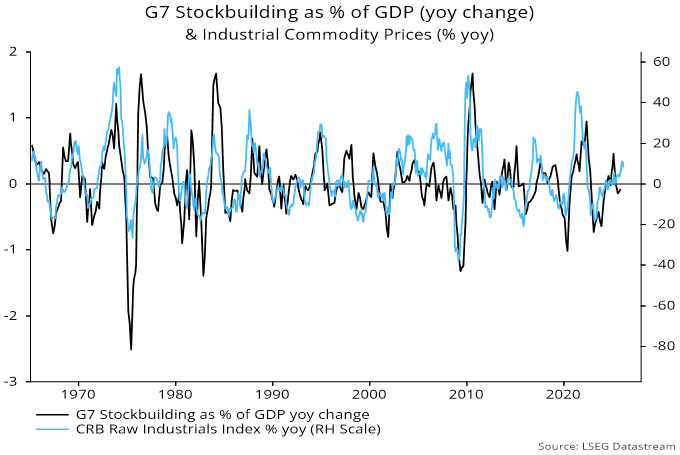
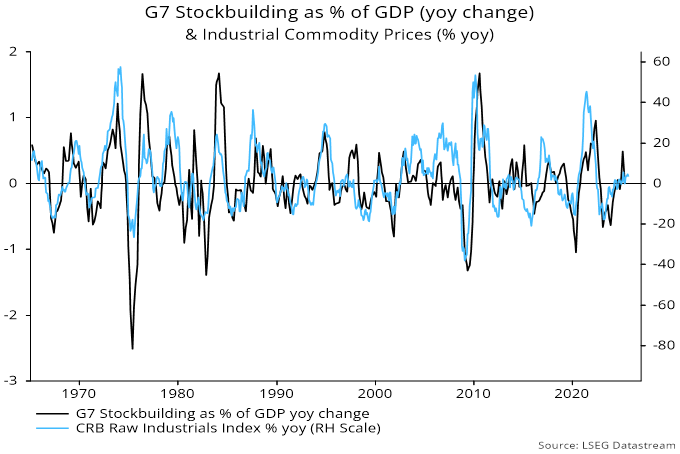
Areas that have lagged relative to history include EAFE / EM equities, small caps and industrial commodities, hinting at catch-up potential in the event of a delayed stockbuilding cycle peak and late (H1 2027) trough. This prospect would be enhanced by a reversal of unusual US dollar strength so far in the current cycle.
Still, any such catch-up might be a relative rather than absolute move against a backdrop of a maturing cycle upswing, a possible US market correction and neutral / negative excess money conditions.