There has been a shift from Canadian equities to global equities, coinciding with an emergence of dedicated global small cap allocations to further enhance portfolio diversification. Taken together these changes have resulted in Canadian small cap equities becoming a forgotten asset class. Despite the reduction to Canadian equity allocations, many investors have a significant dollar allocation to the asset class. This article discusses the merits of Canadian small cap equities and how investors can benefit from its potential contribution.
Background on Canadian Small Cap
As a general rule, small cap companies offer investors more room for growth, but also confer greater risk and volatility than large cap companies. The S&P/TSX Small Cap Index is a float adjusted and market capitalization (cap) weighted index, which was developed as a leading benchmark for those with small cap exposure in the Canadian equity market.
At the end of September 2024, there were 246 constituents in the index with a total market cap of CAD 279 billion. The mean market cap of the constituents was CAD 1.1 billion, but there was quite a range in the size of companies with the smallest being valued at CAD 97 million and the largest at CAD 4 billion. This compares to Royal Bank of Canada, the largest company in the S&P/TSX Composite Index, whose market cap was over CAD 170 billion.
The S&P/TSX Composite Index is concentrated in a small number of companies. The largest 10 companies comprised over 35% of the index at the end of September 2024 with Royal Bank of Canada alone representing 6.9% of the index. In contrast, the small cap index is more diversified with the top 10 companies comprising less than 15% of the index. The largest stock was Bausch Health Companies Inc., which represented 1.4% of the small cap index.
Small versus Large Cap Performance
Whether smaller or larger companies perform better varies over time based on the broader economic climate. Looking back over the last 40 years, a relative constant has been that small caps tend to decline more than large caps in bear markets but bounce back more strongly when sentiment changes. Two recent illustrations of this experience are the global financial crisis and the COVID-19 pandemic (Figure 1). In both periods small caps underperformed when the markets declined, but significantly outperformed large caps in the recovery stage.
Figure 1: Relative Performance of MSCI World Small Cap vs MSCI World*
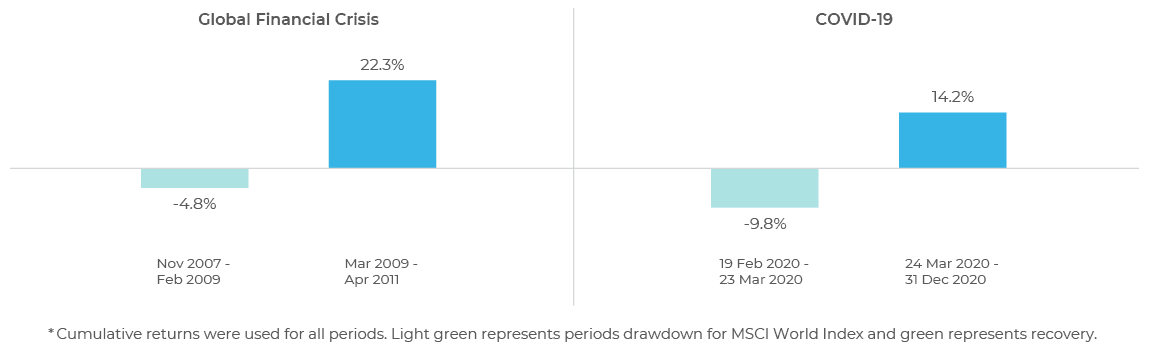
Source: MSCI, FTSE Russell & Thomson Reuters.
The extent of the small cap recovery in 2020, particularly Canadian small caps, is evident in Figure 2. It shows the Canadian small cap index was up over 80% in the last nine months of 2020, resulting in a full calendar return more than double that of the S&P/TSX Composite Index. There was a similar experience for global developed small cap versus large cap companies.
Figure 2: Index Returns During 2020 (in CAD)
| Asset Class |
Market Index |
Q1 Return (%) |
9 Months Ended December 31, 2020 (%) |
Calendar Year 2020 (%) |
| Canadian Equities |
S&P/TSX Composite |
-20.9 |
33.5 |
5.6 |
| Canadian Small Cap Equities |
S&P/TSX Small Cap |
-38.1 |
82.4 |
12.9 |
| Global Equities |
MSCI World |
-13.2 |
31.9 |
14.4 |
| Global Small Cap Equities |
MSCI World Small Cap |
-23.1 |
48.1 |
13.9 |
Source: MSCI, FTSE Russell & Thomson Reuters.
Potential Benefits
While small cap stocks are generally more volatile, there are several benefits.
Growth opportunities: Smaller companies tend to have greater flexibility to respond to opportunity or adversity and their potential growth can continue much longer when they have a desired product or service. Large companies start small. If you can find the next generation of small companies that grow faster and graduate into a larger cap segment, the reward is significant. It is easy to forget that the market capitalization of Shopify, which is valued at over CAD 220 billion, was less than CAD 1.5 billion in June 2015 (Macrotrends.net). Smaller companies also tend to have a more focused line of business and higher insider ownership, resulting in greater alignment of interests between the owners and shareholders.
Sector Differences: The S&P/TSX Small Cap Index is not a microcosm of the larger S&P/TSX Composite Index. Therefore, investors can benefit from the different sector representation offered by the small cap index, which introduces opportunities that may not be present in the large cap segment of the market (Figure 3). For example, over the first nine months of 2024, the S&P/TSX Composite Index communications services sector declined 2.5%, while the S&P/TSX Small Cap Index communications services sector return was up 18% for the same period.
Smaller companies tend to have greater flexibility to respond to opportunity or adversity and their potential growth can continue much longer when they have a desired product or service.
Figure 3: Canadian Equity Sector Allocations
| Sector |
S&P/TSX Composite Index (%) |
S&P/TSX Small Cap Index (%) |
| Energy |
16.7 |
19.1 |
| Materials |
12.5 |
30.7 |
| Industrials |
13.0 |
12.0 |
| Consumer Discretionary |
3.4 |
3.4 |
| Consumer Staples |
4.1 |
2.9 |
| Health Care |
0.3 |
6.2 |
| Financials |
32.2 |
6.5 |
| Information Technology |
8.5 |
5.2 |
| Communication Services |
3.1 |
1.5 |
| Utilities |
4.0 |
1.5 |
| Real Estate |
2.3 |
10.8 |
| Total |
100.0 |
100.0 |
Source: MSCI, FTSE Russell & Thomson Reuters.
Less researched: Small cap companies are generally less researched by the external analyst community. The number of research analysts covering both large cap and small cap stocks has declined over the last 10 years, with the number covering smaller cap companies significantly less (Figure 4).
Figure 4: Analyst Coverage of TSX Companies
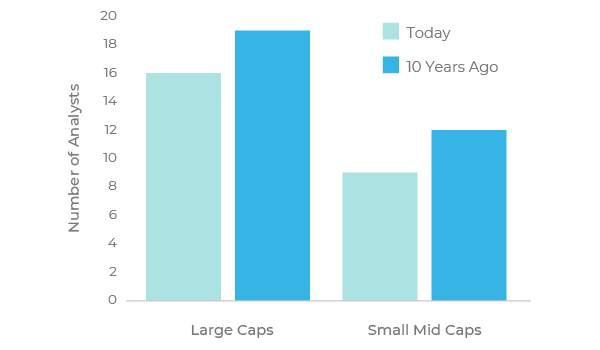
Source: Bloomberg
Often the research analysts covering small cap companies are less senior and experienced compared to their large cap analyst counterparts. These differences create greater opportunities for active managers to outperform the index benchmark by undertaking independent due diligence on these less researched companies, whose share price may not fully reflect their intrinsic value or growth prospects.
Collectively, active small cap equity managers have delivered significant added value above the small cap index. More than three quarters of the active managers delivered at least 1.9% per annum above the index for the 10-year period ended September 30, 2024. The median added value over the 10 years was 3.5% per annum (Figure 5).
Figure 5: Active Management Excess Returns
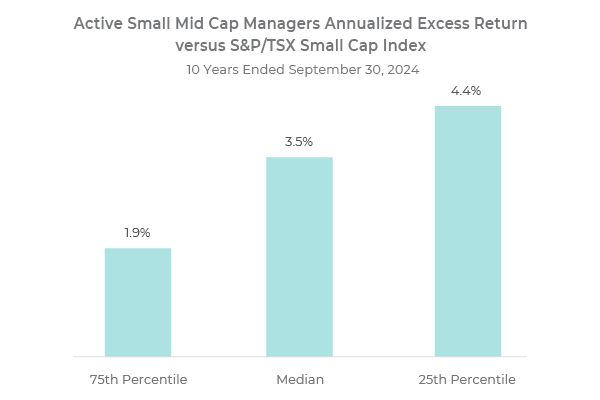
Source: eVestment
Collectively, active small cap equity managers have delivered significant added value above the small cap index.
Case for Canadian Small Caps
Despite a general reduction in Canadian equity allocations, there are many institutional investors with a significant dollar allocation. By including Canadian small caps, investors can tap into a different type of market exposure, as well as the added value potential from active management.


 Source: