One of the joys of investing in the world of small caps is discovering a company that has carved out a niche in the most unexpected of markets. Most of these companies go unnoticed as part of a larger value chain, their products often hidden from the eyes of the end consumer. The idea of a “hidden champion” toiling away in deliberate obscurity while quietly dominating a niche sector or technology was first highlighted by renowned management consultant Hermann Simon in his book – “Hidden Champions of the Twenty First Century.”
What is a hidden champion, one might ask? According to Simon, hidden champions have the following three attributes:
- They are in the top three of their chosen global niche.
- They generate revenue between $5 million and $5 billion.
- They maintain obscurity in terms of brand recognition (B2B in most cases).
Some of the attributes that define them are also what makes them successful. The key lessons we can take from observing hidden champions are:
- Ambition: Despite their size, they set extremely ambitious goals. It is market leadership or bust. Goals are invariably long-term focused with decades in mind.
- Specialization: Their preference is both extreme focus and depth of focus. They identify narrow markets and specialize in them.
- Globalization: Their specialization is then unleashed on global markets. They aggressively hunt for new markets and prefer to serve those markets with their own subsidiaries instead of getting tied up with third parties.
- Innovation: Scarcity of resources due to their small size means they need to be much more effective with R&D. Thinking outside the box means you need to innovate not just products, but processes as well.
- Customer closeness: Large customers can be demanding and often want the lowest price. Hidden champions respond by engaging closely with customers. Providing advice and system integration services by closely engaging with customers creates stickiness and deep moats.
- Financing: Most hidden champions are self-financed with ownership that is long-term oriented and conservative with capital allocation.
- Culture: Culture is high performance with more work to go around than headcount. Turnover is low and managers tend to have long tenures.
Hidden champions tend to be everywhere in the world of small caps, including in emerging markets. In our emerging market small cap portfolio, we have a good representation of hidden champions serving a diversity of end markets. Take Hongfa Technology Co. Ltd. (600885 CH), a Chinese company which has carved out a niche in power relays and is the global leader with over 20% market share. Power relays are a crucial component of any electric equipment that is a part of modern life. They convert a low power input into a high power outcome. From home appliances to industrial equipment, alarms and automobiles, its relays form a ubiquitous part of our lives. As the world upgrades its power grids and AI drives higher power consumption, Hongfa’s high-voltage products should see enhanced demand in the coming years.
Similarly, we own a company in Korea called Vitzrocell Co. Ltd. (082920 KS) which is among the top three players globally in manufacturing primary batteries. Primary batteries have high energy densities, a low discharge rate (allowing them to run for 10 years and beyond) and a wide operational temperature range (-55°C–+85°C). This makes them ideal for use in harsh conditions that require extremely high reliability like oil and gas equipment, rockets and utility meters.
Finally, over in India, we own Suprajit Engineering Ltd. (SEL IN), which is the second largest global manufacturer of control cables and third largest manufacturer of halogen lamps. Suprajit makes over 15,000 types of control cables used in passenger vehicles, two- and three-wheelers and off-highway vehicles like tractors and recreational vehicles. Control cables, as the name suggests, transmit control signals to control equipment versus power cables that transmit high voltage power.
Suprajit is the textbook example of a hidden champion with their stated goal of being a leader in control cables, growing a global manufacturing footprint, deep relationships with leading OEMs and nimble, low-cost R&D efforts leveraging talent in India. With most of global manufacturing now located in emerging markets, we see a landscape littered with hidden champions waiting to be uncovered.


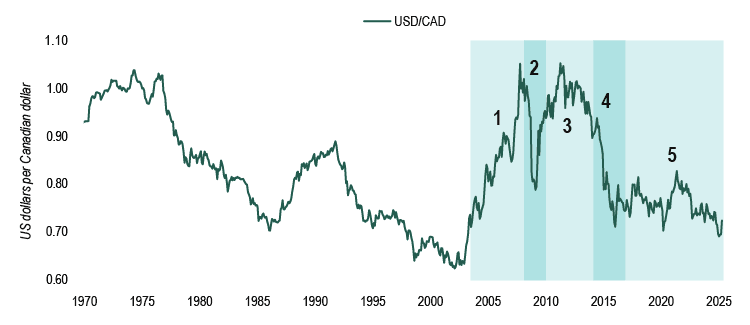 Source: Bank of Canada
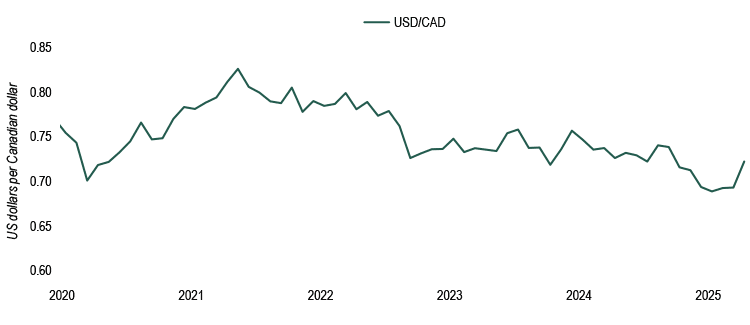

 Source: NS Partners and LSEG (May 2025)
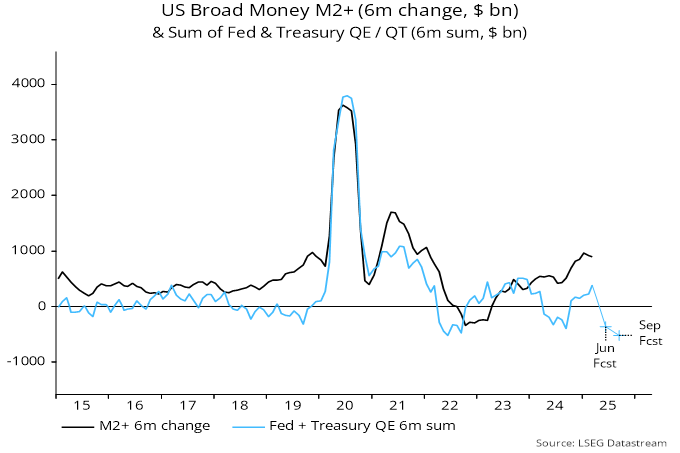
 Source: LSEG Datastream