Windmill turbines on a sunny day in Germany on a blooming bright yellow field and blue sky.

In our last commentary, we discussed Germany’s recent infrastructure bill worth EUR500 billion to be deployed over twelve years. A key component of this bill is climate-led investments, worth one-fifth of the total budget, which finances the energy transition and climate protection measures. Examples of these measures include energy-efficient building renovations, development of electric mobility infrastructure, expansion of the hydrogen industry, promotion of energy efficiency, technologies to decarbonize industrial operations, etc.

Many countries have implemented clean energy plans to mitigate climate risk. Norway generates almost 100% of its electricity from renewable sources, primarily hydropower. Other leaders in renewable energy adoption include Sweden, Costa Rica, the UK, Iceland, New Zealand and Germany, etc.

A lesser known, but much bigger investment plan, is Japan’s Green Transformation (GX) policy worth JPY150 trillion (over USD1.1 trillion) to be executed over ten years. It was announced in February 2023 with many detailed targets across energy, transport, construction, industry and finance. Its goal is to achieve carbon neutrality by 2050 and transform the country’s economy toward clean energy.

In our Sustainable Global Small Cap Strategy, clean energy and sustainable infrastructure are among the major themes. We have witnessed the strong growth of some holdings benefiting from these mega trends. Below are a few examples:

  • Boralex Inc. (BLX CN) develops, builds and operates renewable energy power facilities (wind, hydroelectric, solar and thermal). It owns and operates about 100 wind power stations, 15 hydroelectric plants, a dozen solar power stations and two energy storage facilities. Its combined installed capacity has more than doubled in the past five years to over 3.1 GW, with 8 GW in the pipeline. Major markets are Canada, France, the United States and the UK.
  • Aecon Group Inc. (ARE CN) is a Canadian construction company, providing a range of services to private and public sector clients in infrastructure, mostly in North America. In 2024, 59% of its revenues and 78% of backlog were tied to sustainability projects from renewable energy (hydroelectric, geothermal, solar) to energy transition (nuclear, battery storage, energy transmission and grid modernization) and water management (supply, distribution and wastewater treatment). As of March 31, 2025, it had a record-high backlog of CAD9.7 billion.
  • Nexans SA (NEX FP) is a global leader in cable systems and services. It is strategically focusing on the electrification market. 75% of sales generated from products and services contribute to energy transition and efficiency. Well-known for its high-voltage transmission cable and subsea cable, Nexans specializes in power generation, transmission, distribution, infrastructure, telecommunication, mobility services and more. As of March 31, 2025, it had a record-high backlog of EUR8.1billion. Major markets are Norway, France, Germany and Canada.

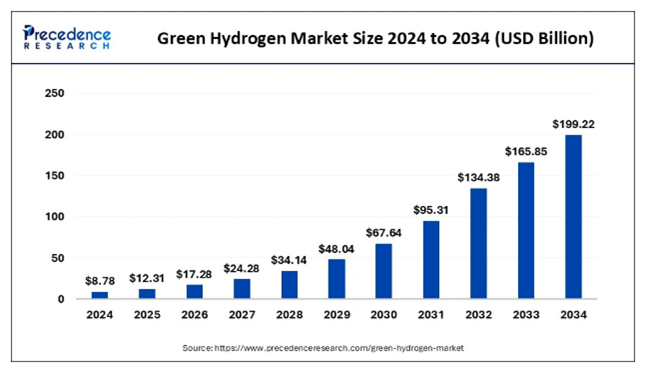
Within the theme of sustainability is the growing industry of green hydrogen. The global green hydrogen market size is currently estimated at over USD12 billion in 2025 and is expected to expand at a CAGR of 41% from 2025 to 2034.

Projected growth of green hydrogen market size from 2024 to 2034.

There are national policies in place that favour green hydrogen: Germany’s hydrogen strategy targets at least 10 GW production of green hydrogen by 2030; the UK’s hydrogen strategy requires at least half of its 10 GW target to come from green hydrogen by 2030; Japan’s hydrogen strategy focuses on achieving carbon neutrality by 2050 through the widespread adoption of hydrogen across various sectors.

There are three main types of electrolysis used for green hydrogen production: Proton Exchange Membrane (PEM), Alkaline and Solid Oxide. Advantages of PEM electrolysis specifically are that it uses a solid polymer electrolyte membrane and operates at higher current densities, making it suitable for dynamic and intermittent renewable energy sources. Major players in the PEM segment include Plug Power, Nel Hydrogen, Cummins and, one of our holdings, ITM Power PLC (ITM LN).

ITM Power is a pure-play in green hydrogen and manufactures electrolyzers based on PEM technology; it’s known for its work with Linde on large-scale PEM electrolyzers. Germany is its biggest market generating 37% of total sales, followed by the UK, Austria, Australia and rest of Europe.

Countries prioritizing initiatives for renewable energy, sustainable infrastructure and electrification will look to work with companies specializing in these sectors. We feel that the holdings within our Sustainable Global Small Cap Strategy are well positioned to benefit from this global effort toward a greener future.

UK money momentum has weakened alarmingly. The broad non-financial M4 measure – comprising holdings of households and private non-financial corporations (PNFCs) – grew by just 1.9% annualised in the three months to May. Non-financial M1 contracted at a 2.7% pace – see chart 1.

Chart 1

Chart 1 showing UK Narrow / Broad Money & Bank Lending (% 3m annualised)

Three-month bank lending growth held up but is likely to fall sharply as a large monthly rise in March – related to the end of the stamp duty holiday – drops out of the calculation. Lending typically follows money trends.

It is unusual for narrow money to lag broader measures when interest rates are falling – lower rates reduce the opportunity cost of holding more liquid forms of money, encouraging a shift out of time deposits and savings accounts. 21% of non-financial M1 is non-interest-bearing. The average interest rate on the stock of household time deposits fell by 31 bp between August and May, according to BoE data.

The demand to hold narrow money is driven mainly by the need to finance future spending, so weakness despite rate cuts is ominous for economic prospects. Put differently, money trends support the view here that MPC policy easing has been too slow, providing insufficient support for activity and increasing the risk of an inflation undershoot.

The monetary relapse could partly reflect payback for temporary factors that boosted growth in late 2024 / early 2025.

A jump in money numbers in October appears to have been related to asset sales in anticipation of changes to capital taxes in the Budget at the end of that month. An asset disposal can boost broad money if financing by the purchaser involves – directly or indirectly – an expansion of banks’ balance sheets*. The effect, however, would be expected to reverse as the seller of the asset deployed the proceeds.

Mortgage lending and broad money were boosted in Q1 by front-loading of housing transactions ahead of the end of the stamp duty holiday. Increased activity may also have resulted in a temporarily higher demand for narrow money.

A reversal of these effects may explain broad money stagnation and a narrow money decline in April / May. Still, annual rates of change should be free of such influences and have slowed to 2.5% for non-financial M1 and 3.6% for M4, from recent peaks of 3.4% and 4.8% respectively. Eurozone annual non-financial M1 growth, by contrast, has risen further to 4.3%.

The sectoral breakdown shows that the recent fall in narrow money reflects a switch by households into time deposits / cash ISAs – their aggregate money holdings have continued to expand, though at a slower pace. By contrast, corporate broad money contracted in April / May, consistent with a negative financial impact from NI and minimum wage hikes – chart 2.

Chart 2

Chart 2 showing UK Household & PNFC* Money (% 3m annualised) *PNFCs = Private Non-Financial Corporations

The annual rate of change of corporate broad money is back in negative territory, following small positive readings over December-April, suggesting further weakness in employment and fading capex prospects.

*More precisely, an expansion of banks’ domestic lending or net foreign assets, or a fall in their net non-deposit liabilities.

The latest signal from monetary data is that global economic momentum will inflect weaker from around late 2025. Cyclical considerations suggest that this will mark the beginning of a sustained downswing into 2027.

Lagged money trends argue that underlying inflation will fall further and remain low through 2026. Nevertheless, central banks may be slow to offset economic weakness with additional policy stimulus because of concerns about tariff effects and fiscal indiscipline, as well as scarring from the 2021-22 inflation surge.

The suggestion is that equity markets face rising headwinds, with another sustained bull phase unlikely before 2027, when key cycles are scheduled to bottom. An appropriate strategy may be to underweight markets where monetary trends are relatively weak – Japan and the UK currently – while overweighting sectors with lower earnings sensitivity to expected cyclical weakness.

Elaborating on the above, global six-month real narrow money momentum – a key leading indicator in the approach followed here – reached a local high in March, falling sharply in April / May – see chart 1.

Chart 1

Chart 1 showing G7 + E7 Real Narrow Money (% 6m)

The rise from October 2024 into March suggested that the global economy would regain some momentum from around mid-2025, based on the recent average lag. A June rise in manufacturing PMI new orders could mark the start of such a shift, although results from national (as opposed to S&P Global) surveys were mixed. Still, April / May monetary weakness argues that any near-term recovery will be short-lived, with economic indicators likely to deteriorate again from around late 2025 – chart 2.

Chart 2

Chart 2 showing Global Manufacturing PMI New Orders & G7 + E7 Real Narrow Money (% 6m)

The latest fall in real money growth has been broadly based across countries, reinforcing the negative signal. Momentum is notably weak in Japan and the UK, arguing for economic underperformance. Eurozone growth has held up but hasn’t yet crossed above the US, cautioning against “europhoria” – chart 3.

Chart 3

Chart 3 showing Real Narrow Money (% 6m)

From a cyclical perspective, the stockbuilding cycle is in the window for a peak in terms of both time since the last low (Q1 2023) and the contribution of inventory accumulation to annual G7 GDP growth – chart 4. The latter has been boosted by front-loading to avoid tariffs, which appears to have continued in Q2.

Chart 4

Chart 4 showing G7 Stockbuilding Cycle G7 Stockbuilding as % of GDP (yoy change)

The cycle should turn down by early 2026 at the latest and the baseline assumption here remains for a low in H1 2027, implying that the current cycle will be slightly longer than the 3.5 year historical average, balancing a shorter-than-average prior cycle. Stockbuilding cycle downswings are usually associated with significant slowdowns (or worse) in global economic growth and underperformance of risk assets.

A key question is whether the coming downswing will be accompanied by weakness in the housing and / or business investment cycles, in which case a 2026-27 recession becomes the baseline. A housing downturn is more likely, given the maturity of the current cycle (16 years versus an 18-year average) and downward pressure from elevated longer-term interest rates. The business investment cycle is less advanced (year five versus a nine-year average), with corporate financial balances still healthy and AI deployment providing a tailwind.

Close attention, therefore, should be paid to housing indicators. The six-month rate of change of G7 housing permits / starts recently turned negative, suggesting a darkening outlook – chart 5.

Chart 5

Chart 5 showing G7 Industrial Output & Housing Permits / Starts* (% 6m) *Permits for US, Germany, France, Italy; Starts for Japan, UK, Canada

Inflation follows money growth with a roughly two-year lag, according to the simplistic monetary rule, which outperformed every other forecasting approach in 2021-22. Annual broad money growth bottomed in mid-2023 in the G7 and a year later globally, with limited subsequent recoveries. The suggestion is that underlying inflation will fall further and remain low through 2026.

On the analysis here, therefore, central banks could limit economic weakness by delivering timely additional policy stimulus while still meeting, or even undershooting, their inflation objectives. The US Fed, however, may continue to drag its feet amid uncertainty about near-term tariff effects and counterproductive political pressure, with a knock-on effect on the pace of easing elsewhere.

Both global “excess” money flow indicators used here to assess equity market prospects are currently negative, having been mixed three months ago. Specifically, global six-month real narrow money momentum has crossed back below industrial output momentum, while 12-month real money momentum remains beneath its long-run average – chart 6.

Chart 6

Chart 6 showing MSCI World Cumulative Return vs USD Cash & Global “Excess” Money Measures

The indicators were misleadingly negative in 2023-24 because of a stock overhang resulting from the 2020-21 money growth surge. The assessment here is that there is no longer any excess relative to current levels of nominal GDP and asset prices.

Arial view of bank towers in Frankfurt, Germany.

Germany has embarked on a historic transformation of its fiscal and economic landscape with the passage of its latest infrastructure bill in March 2025. This legislation, resulting from a rare constitutional amendment, is poised to have profound and far-reaching effects on the German economy, public services and the broader European region over the next decade.

The new law creates a €500 billion infrastructure fund, to be deployed over twelve years, aimed at modernizing Germany’s aging infrastructure and stimulating economic growth. This fund operates outside the traditional constraints of Germany’s “debt brake,” a constitutional rule that previously limited new government borrowing to 0.35% of GDP. The reform also allows for increased borrowing by the federal states and exempts defence spending above 1% of GDP from debt restrictions, thereby freeing up additional fiscal resources for investment.

Last week, the government coalition agreed to borrow almost €500 billion to raise the defence budget to the new NATO target of 3.5% of GDP by 2029, and to borrow almost €300 billion for infrastructure over the same period.

This fiscal expansion should boost domestic demand for many years and more than compensate for weaker external demand. Fixed investment in machinery and equipment, as well as in construction, are likely to benefit from this fiscal impulse.

The infrastructure bill is expected to have positive spillover effects across the European Union. Improved transport links, increased demand for goods and services and a more competitive German economy could strengthen the EU’s overall economic resilience. Furthermore, the focus on energy transition and digitalization aligns with broader European climate and innovation goals.

Konecranes PLC (KCRA HE), one of our holdings in our international strategy, is well positioned to benefit from this massive infrastructure spend.

Konecranes is a global leader in material handling solutions, serving a broad range of customers across several industries. Its product portfolio lifts, handles and moves goods in a safer, more productive and sustainable way. The company reports under three business segments:

  • Industrial services: It provides maintenance services and spare parts for any kind of cranes and hoists. With presence in more than 23 countries, Konecranes has one of the most extensive maintenance coverages globally. This segment represents 36% of revenue but more than 56% of income.
  • Industrial equipment: It provides industrial cranes and hoists for a wide range of customers, including general manufacturing, logistics, distributors, construction and engineering, metals and transportation equipment. This segment represents 29% of revenue and 20% of income.
  • Port solutions: It provides heavy cranes, mobile equipment, software and services for the container handling industry. Konecranes remains the only western player with a broad end-to-end offering for port terminals. Most of the world’s automated container terminals run on Konecranes product. This segment represents 35% of revenue and 24% of income.

Konecranes is exposed to structural growth through increasing automation and digitalization in industry, where its smart lifting and IoT solutions are in high demand. The global rise in e-commerce and logistics boosts demand for its port and warehouse equipment. Sustainability trends drive customers to modernize with Konecranes’ energy-efficient and low-emission solutions. Additionally, infrastructure investment and industrial growth in emerging markets continue to expand its long-term customer base. We believe it is well-positioned to benefit from higher defence and infrastructure spending globally.

A further rise in China’s trade surplus over the past year has been accompanied by bumper growth of US dollar deposits in Hong Kong, suggesting that Chinese entities have been building a hedge against RMB depreciation – see chart 1.

Chart 1

Chart 1 showing China Trade Balance in Goods (12m sum, $ bn) & Hong Kong Customer Deposits in US$ (yoy change, $ bn)

US dollar deposits grew by $139 bn or 15.6% in the year to April to stand at $975 bn, equivalent to 4.5% of US M2. They have risen much more strongly than Hong Kong dollar deposits, now representing 92% of the value of the latter, up from 79% at end-2022.

Low inflation has allowed China to gain competitiveness without nominal depreciation, with the BIS real effective rate at a 13-year low – chart 2.

Chart 2

Chart 2 showing China Broad Effective Exchange Rate (BIS, 2020 = 100)

Is demand for US dollar balances starting to wane? The recent fall in Hong Kong rates is consistent with a switch into local dollars. The one-year Hong Kong / US rate differential is the most negative since 2005, before a sustained appreciation of the RMB – chart 3.

Chart 3

Chart 3 showing Hong Kong / US 1y Deposit Rates & USD/CNY

Chinese f/x settlement numbers, meanwhile, indicate that the authorities intervened to hold down the RMB for a second month in May. Upward pressure had been signalled by a forward premium on the offshore RMB, which has persisted in June – chart 4.

Chart 4

Chart 4 showing China Net F/x Settlement by Banks Adjusted for Forwards ($ bn) & Forward Premium / Discount on Offshore RMB (%)

The onshore spot rate has moved from the weak end to the middle of the PBoC’s trading band, with the central parity rate edging higher – chart 5.

Chart 5

Chart 5 showing USD/CNY & PBoC Central Parity Rate

Any signal from the Chinese authorities of acquiescence to an appreciating trend could quickly become self-fulfilling by encouraging a further unwind of hedges, including via a reduced US dollar share of Hong Kong deposits.

Chinese monetary trends suggest a continuation of lacklustre economic growth with negligible inflation.

Six-month momentum of narrow and broad money picked up strongly during H2 2024, raising hopes of a reflationary scenario. Growth rates, however, have fallen back since Q1, to around the middle of ranges in recent years – see chart 1.

Chart 1

Chart 1 showing China Nominal GDP* (% 2q) & Money / Social Financing* (% 6m) *Own Seasonal Adjustment

May activity numbers confirm an economic slowdown, with six-month growth of industrial output and fixed asset investment falling again, and home sales contracting at a faster pace. Retail sales were boosted by subsidy programmes and promotions, with payback likely – chart 2.

Chart 2

Chart 2 showing Chinese Activity Indicators* (% 6m) *Own Seasonal Adjustment

House prices haven’t stabilised. The three-month change in new house prices has stalled below zero, with that for existing homes becoming more negative – chart 3.

Chart 3

Chart 3 showing China House Prices

Monetary developments don’t yet warrant pessimism. Six-month broad money momentum remains respectable, at 4.0% – 8.2% annualised – in May. This could be consistent with nominal GDP growth of c.6.5% pa, based on a long-run trend rise of 1.75% pa in the money to GDP ratio.

Narrow money momentum has weakened more sharply but the sectoral breakdown is reassuring, showing stable growth of household and enterprise money, with the aggregate slowdown due to a fall in demand deposits of government-related bodies – chart 4.

Chart 4

Chart 4 showing China New M1 Components (% 6m)

This fall is unlikely to be a leading indicator of reduced spending by these bodies, particularly as their overall deposit growth – i.e. including time as well demand deposits – has remained stable.

The money numbers, moreover, exclude fiscal (i.e. central government) deposits, six-month growth of which has picked up since Q1. Demand deposits of government-related bodies could recover as funds are transferred to finance spending projects.

Colorful alleys and streets in Guanajuato city, Mexico.

We have written extensively in recent months on how monetary and currency signals may be hinting that we are on the cusp of a “virtuous circle” for performance in EM equities. For any who missed it, a few recent pieces below:

Implications of Asian currency tremors

‘Beautiful’ tariffs and the end of exceptionalism

Are emerging markets on the cusp of a ‘virtuous circle’?

This is the most bullish we have been on the outlook for emerging market equities in over a decade.

Recent momentum has been positive, with MSCI EM up 9% to the end of May, part of a broader upswing in markets outside of the United States.

MSCI Price Indices
USD Terms, 31 December 2024 = 100
Line graph showing MSCI price indices from December 31, 2024.
Source: LSEG Datastream

Macquarie Capital investment strategist Viktor Shvets wrote earlier this month that, in May, EM excluding China recorded the largest net inflow since December 2023. India ($2.3 billion), Taiwan ($7.6 billion) and Brazil ($2 billion) received the largest flows, helping to buck a trend of selling through 2024 and early 2025.

EM ex-China Net Foreign Flows (US$ bn) – strong flow reversal
Line graph showing the net flows of emerging markets excluding China.
Source: Bloomberg; Macquarie Global Strategy (May 2025)

Persistent negative outflows over the past decade from EM into the United States have driven what by many measures is an unprecedented valuation gap.

US relative to the rest of the world forward PE and dividend yield
Line graph showing the US relative to the rest of the words forward PE and dividend yield.
Source: CLSA (April 2025)

Some premium is no doubt deserved given stronger US growth versus the rest of the world post-GFC, along with a better environment for capital and innovation. However, such extreme valuations imply lofty relative future growth expectations and leave US equities vulnerable to negative catalysts.

As John Authers wrote in his Points of Return column for Bloomberg:

Ultimately, EMs benefit most from the decline of US exceptionalism, giving central banks room to cut rates, as noted by Points of Return, and letting fiscal authorities spend without worrying about tanking the currency.

In a world where no one is exceptional, as Macquarie’s Shvets puts it, EMs are no longer penalized. At best, he calls the fall of American exceptionalism a process, not a collapse — creating conditions for a gradual rise in US risk premia while avoiding disorderly asset repricing. Investors will continue narrowing spreads between US and non-US assets, supporting EMU and Japan. Ditto for EMs, especially those with stronger secular drivers, with India, Korea, and Taiwan standouts.

Currency tailwind for EM

Line graph showing East Asia currency values versus the US dollar from December 31, 2024 to present.
Source: NS Partners & LSEG

Winners and losers

Despite being caught up in Liberation Day tariff chaos, MSCI China has returned 13.1% over the same period. Since 2023, China has been one of the strongest equity markets in the world. Despite the rally, valuations in many of the high-quality businesses that we like remain modest.

Two line graphs illustrating the 12-month forward PE for the MSCI China and MSCI China private sector.

Source: Jefferies (March 2025)

Having led the way for EM over the last few years, Indian stocks returned just 3% as sentiment moderates.

South Korea bounced 18.7% as domestic political risks eased following the impeachment of former president Yoon Suk Yeol following his failed attempt to impose martial law in December 2024. Former opposition leader Lee Jae-myung was elected to the presidency in early June and will immediately grapple with a contracting economy which has been hit further by US tariffs.

Taiwan has been a laggard, its market flat over the period which includes the DeepSeek shock that hit AI supply chain stocks on fears of lower demand for the hardware used to power the technology.

Stocks in Southeast Asia are yet to fire this year despite being beneficiaries of a falling USD and improving global liquidity. Perhaps investors remain fearful that these smaller, open trading economies risk getting trampled at the feet of the two fighting elephants in the United States and China. In a meeting with our CIO Ian Beattie earlier this year in London, Malaysian Prime Minister Anwar explained what a difficult position his country is in. China is Malaysia’s biggest trading partner and second largest investor, while the United States is its largest investor and second largest trading partner! If trade tensions between China and the United States cool, then these markets should soar.

Elsewhere, South African stocks have boomed, rising 24.4% powered in part by the country’s gold miners, along with a tentative improvement in politics under the ruling national ANC/DA coalition.

Brazil and Mexico have largely avoided president Trump’s ire and have rallied despite challenging political and economic backdrops, up 20.0% and 28.3% respectively.

Huge rallies in Greece (47.5%) and Poland (43.3%) have been driven by a powerful cocktail of geopolitical realignment between Europe and the United States and fiscal stimulus combined with cheap valuations. The most notable catalyst has been Germany’s dramatic policy shift under Chancellor Friedrich Merz. His government has proposed a sweeping €500 billion infrastructure investment plan and a major increase in defence spending. Crucially, the proposal includes exempting defence expenditures exceeding 1% of GDP from the constitutional “debt brake,” a move that would allow for significantly more fiscal flexibility.

Turkey bucked the trend (-15%), the market tanking on news President Erdogan jailed a political rival on trumped up corruption charges. The portfolio is zero-weight Turkey, and we are not tempted by ever cheaper valuations while Erdogan threatens the rule of law.

Finally, the GCC was a mixed bag with Saudi Arabia (-5.2%) hit by a weaker oil price, while the UAE (14.9%) was much stronger.

Caveat

Monetary data in the United States had been signalling a slowdown this summer, and this is now likely to be exacerbated by tariffs with a muted recovery in the latter half of 2025. The best-case scenario for EM at present would be contained US economic weakness, a slowdown in underlying inflation and a sustained pace of rate cuts. The story would be one of a late-cycle catch-up in EM performance, as illustrated by the table below.

Stockbuilding cycle & markets: EM, small caps, industrial commodities lagging – catch-up potential?
Chart illustrating the percentage changes of various indices over previous cycles.
Source: LSEG Datastream, own calculations / dating, as at 2 June 2025

We would expect EM to underperform in a hard-landing scenario, although this might be temporary given the lack of prior outperformance, followed by a strong early cycle phase. The chart from CLSA below shows prior phases of early cycle outperformance.

Emerging equities are an early cycle play: EM equity outperformance phases post US recessions
Line graph showing prior phases of early cycle performance.
Source: CLAS, MSCI, NBER

Mexico’s scorching rally belies deteriorating institutional quality

Ducking US tariffs and in prime position to benefit from US friendshoring, Mexico has been one of the top performing emerging markets this year. Strong stock picking in our portfolio allowed us to keep up despite an underweight to the country. However, we have used the rally as an opportunity to take profits and increase our underweight on a view that investors underestimate the impact of recent judicial elections.

In June last year we flagged the potential for Morena’s dominance in congressional and presidential elections to expose investors to rising institutional risks – Political risks in EM spike as Indian, South African and Mexican elections surprise:

Crucially for investors, AMLO and Morena are pursuing policies that could threaten Mexico’s institutions. Institutional quality is a key factor in determining whether a country moves up the economic development ladder. …

Investors fear that a strengthened mandate will allow Sheinbaum (or even an outgoing AMLO) to undermine judicial independence,and pursue plans to eliminate autonomous government agencies overseeing telecoms, energy and access to information, as well as weaken electoral supervisory bodies.

Morena under president Sheinbaum pushed ahead with an unprecedented judicial overhaul, with Mexican citizens voting in early June to elect judges including for the Supreme Court. As reported by Bloomberg on the 2nd of June – Mexico Judicial Election Sees 13% Turnout in Historic Vote:

The controversial election asked voters to pick judges among several thousand hopefuls which marked a first of its kind experiment for a large democracy. The judicial overhaul could give Sheinbaum broad influence over a revamped judiciary, the only branch of government the leftist Morena party does not control.

Critics of the process argue that this will undermine the rule of law by injecting more politics into legal and constitutional disputes.

Only 13% of registered voters turned out to participate, tasked with choosing between thousands of candidates, while accounting for specialties while selecting an equal number of men and women.

Politicising the selection of the judicial officers compromises Mexico’s separation of powers between the executive, congress and judiciary. This is a step backward as it undermines the institutional pluralism within the country’s system of government, where different power centres provide checks and balances and ways for the system to self-correct.

Regressive judicial reform coupled with a fragile economy hit by tariff uncertainty, falling remittances from a deteriorating US labour market and deportation fears is the basis for added caution.

Risks are to the downside for Mexico’s industrial production in 2025
Chart comparing current performance of various sectors to their performance last year.
Source: GBM (June 2025)

Exposure to Mexico in our portfolio is now c. 1% versus c. 2% for the benchmark.

Given the direction of travel in macro risk, we will debate whether to downgrade our country rating for Mexico further in the coming weeks. We are always seeking competition for capital in the portfolio, and in LatAm we are seeing interesting opportunities emerge in places like Argentina, Peru and Brazil, all competing for risk budget.

Photo of Bryce Walker.

We would like to announce that Bryce Walker has taken on the role of President and CEO of Connor, Clark & Lunn Funds Inc. (“CC&L Funds”) and has been named Ultimate Designated Person (“UDP”).

Tim Elliott is joining Connor, Clark & Lunn Investment Management Ltd. (“CC&L Investment Management”) in a role on its institutional client solutions team, effective July 1, 2025.

Bryce Walker joined CC&L Funds in 2012 as Vice President, Business Development, leading sales and service efforts in Western Canada. In 2018 he became Senior Vice President, Business Development, taking on the leadership of the sales and service teams across all of Canada.

Tim Elliott originally joined Connor, Clark & Lunn Financial Group Ltd. (“CC&L Financial Group”) in 2007 and founded CC&L Funds in 2012 with the aim of delivering unique and proven institutional investment strategies to the Canadian wealth management market through full-service investment dealers and the multi-family office channel. Since that time, the firm has grown rapidly in assets, strategies and people, to be recognized as a leader in the market for separately managed accounts (“SMAs”) and in liquid alternative and niche investment fund strategies.

“I’m very proud of the team and business that we have built at CC&L Funds in delivering unique, institutional-calibre investment solutions and in creating strong partnerships with some of the best Advisors and organizations in Canadian wealth management,” said Tim Elliott. “I’m really excited to be joining CC&L Investment Management at a time of rapid institutional growth for the firm, and also to see where Bryce and our terrific team can take the CC&L Funds business from here.”

“Tim and I have worked closely together for the past 12 years in building a business that is relatively unique in Canada, given our specialized approach in the wealth market, backed by one of Canada’s largest privately owned asset managers. I’m excited to lead the business forward through this next phase of growth and expansion,” said Bryce Walker.

This transition will support the strong growth for both CC&L Investment Management, particularly in the institutional market, and for CC&L Funds in Canadian wealth management, and is consistent with CC&L Financial Group’s long-term approach to succession planning.

About Connor, Clark & Lunn Funds Inc.

Connor, Clark & Lunn Funds Inc. partners with leading Canadian financial institutions and their investment advisors to deliver unique institutional investment strategies to individual investors through a select offering of funds, alternative investments and separately managed accounts.

By limiting the offering to a focused group of investment solutions, CC&L Funds is able to deliver unique and differentiated strategies designed to enhance traditional investor portfolios. For more information, please visit www.cclfundsinc.com.

About Connor, Clark & Lunn Investment Management Ltd.

Connor, Clark & Lunn Investment Management Ltd. is one of the largest independent partner-owned investment management firms in Canada with $78 billion in assets under management. Founded in 1982, CC&L Investment Management offers a diverse array of investment services including equity, fixed income, balanced and alternative solutions including portable alpha, market neutral and absolute return strategies. For more information, please visit cclinvest.cclgroup.com.

About Connor, Clark & Lunn Financial Group Ltd.

Connor, Clark & Lunn Financial Group Ltd. is an independently owned, multi-affiliate asset management firm that provides a broad range of traditional and alternative investment management solutions to institutional and individual investors. CC&L Financial Group brings significant scale and expertise to the delivery of non-investment management functions through the centralization of all operational and distribution functions, allowing talented investment managers to focus on what they do best. CC&L Financial Group’s affiliates manage over $142 billion in assets. For more information, please visit www.cclgroup.com.

Contact

Lisa Wilson
Manager, Product & Client Service
Connor, Clark & Lunn Funds Inc.
416-864-3120
[email protected]

Technician holding white hat safety hard hat.

Last week, we visited Federal Signal’s flagship manufacturing facility alongside a select group of investors. Touring the plant floor, seeing the latest innovations in action and engaging directly with the teams driving Federal Signal’s record-setting growth gave us invaluable insights that numbers alone can’t provide. This on-the-ground approach reflects our commitment to deep diligence and transparency – values that set us apart in the investment community.

Our group witnessed not only the impressive scale of production, but also the operational excellence and culture of continuous improvement that permeate every corner of the company. From the hum of new automated machinery to the pride in the eyes of long-tenured employees, the visit reaffirmed why Federal Signal remains a leader in its field and a valuable investment.

Decorative.
Vactor Manufacturing production plant in Streator, IL. Source: Global Alpha.

Decorative.
A truck outside the Vactor Manufacturing production plant. Source: Global Alpha.

Decorative.
Another section of the production plant, highlighting other brands produced by Federal Signal. Source: Global Alpha.

Decorative.
A specialized truck produced by Federal Signal. Source: Global Alpha.

Who is Federal Signal?

Federal Signal Corp. (FSS NY) makes specialized vehicles and equipment that help keep communities safe, clean and running smoothly. In simple terms, the company builds things like street sweepers, sewer-cleaning trucks, fire rescue vehicles and emergency warning systems. Their products are used by cities, governments and businesses to clean streets, manage waste, respond to emergencies and alert people to danger.

Federal Signal: A platform built for power and agility

Federal Signal’s story is one of transformation and resilience. Over the past decade, the company has built a powerful platform that combines organic growth, strategic acquisitions and a robust aftermarket business. Since 2016, net sales have grown at a compound annual rate of 13%, reaching a record $1.86 billion in 2024. The company’s ability to scale quickly has been critical in overcoming challenges and seizing new opportunities.

Inside the plant: Innovation, efficiency and teamwork

During our visit, we saw firsthand how Federal Signal’s operational strategies translate into real world results:

Production efficiency: The Streator, Illinois facility set a new record for unit production in 2024, thanks to improved supply chains and process enhancements.

Lean initiatives: The Federal Signal Operating System, including 80/20 programs and lean manufacturing, is driving efficiency, cost savings and reduced lead times across the organization.

Electrification and new product development: The company continues to invest in electrification, with new offerings like the fully electric Broom Bear street sweeper and Rugby Vari-Class dump platform.

Safety and security: The Safety and Security Systems Group (SSG) posted a 7% sales increase, with EBITDA margins rising by 170 basis points, reflecting strong demand for public safety equipment and operational discipline.

These achievements are not abstract – they are visible on the plant floor, in the streamlined workflows and in the pride of the workforce.

Strategic growth: M&A and aftermarket expansion

Federal Signal’s disciplined approach to mergers and acquisitions (M&A) has been a key driver of its growth. Since 2016, about half of top-line growth has come from M&A, with a focus on integrating and strengthening acquired businesses. The recent acquisition of Hog Technologies, a leader in road marking and water blasting equipment, expands Federal Signal’s reach into new geographies and end-markets, such as airports.

The company’s aftermarket business – parts, service, rentals and training – continues to expand, providing stable, recurring revenue and deeper customer relationships. This diversification of revenue streams helps buffer the company against economic cycles and positions it for long-term sustainability.

Positioned for the future: Resilience and opportunity

Federal Signal’s future is bright, supported by a robust backlog, a healthy M&A pipeline and a diversified customer base. The company is well-positioned to benefit from ongoing infrastructure investment, including federal stimulus funds and the bipartisan Infrastructure Bill, which are driving demand for essential equipment like sewer cleaners, street sweepers and safe digging trucks.

A key differentiator is Federal Signal’s ability to adapt – whether by bringing more production in-house, optimizing distribution or leveraging cross-selling opportunities among its brands. The company’s platform approach ensures that every new acquisition and product line strengthens the whole.

What sets Global Alpha apart: The value of being there

Our recent plant visit is more than a symbolic gesture – it’s a core part of our investment philosophy. By engaging directly with Federal Signal’s people and processes, we gain a nuanced understanding of the company’s strengths and opportunities that goes beyond financial statements. This hands-on diligence gives us – and our investors – confidence in the company’s trajectory and our decision-making.

In a world where many rely solely on remote analysis, our willingness to “walk the floor” sets us apart. It’s how we build conviction, spot emerging trends early and ensure we’re investing alongside the best teams in the business.

Conclusion: Moving forward together

Federal Signal’s journey is one of continuous growth, innovation and resilience. As we saw firsthand this week, the company’s success is driven by a powerful platform, a culture of excellence and a commitment to serving customers and communities.

We are excited to continue this journey with you – on the ground, in the field, and at the forefront of industry leadership. Thank you for your trust and partnership.

Businessman reviewing analytics data with futuristic AI projection images from a computer & tablet.

Artificial intelligence (AI) represents technological advancements that enable machines to emulate how our brains work, mimicking the way we receive data, solve problems and make decisions. AI is acknowledged as the latest general-purpose technology (GPT*), following previous innovations like the steam engine, electricity and the Information and Communication Technology (ICT) revolution. This article examines how AI is expected to contribute to economic productivity and its implications for the asset management industry.

GPT and the economy

The economic productivity benefits of a GPT unfold in three phases:

  1. Initial phase: During this phase, the technology is new and not widely adopted, resulting in minimal benefits.
  2. Growth phase: As technology improves, implementation costs decrease, and it becomes more widespread, leading to significant productivity gains.
  3. Maturity phase: The pace of improvements and rollouts slow, causing productivity gains to taper off.

Historically, it took several decades for GPT productivity gains to materialize. However, the timeframe for AI is shorter due to its software-based nature, allowing advancements to be deployed quickly and efficiently.

AI is anticipated to impact the economy in several ways:

  • Efficiency savings: AI will boost productivity through one-time efficiency savings, either by maximizing existing resources or performing tasks with fewer resources.
  • Human-AI collaboration: In some cases, AI will replace humans, while in others, it will help humans become more efficient in their jobs. Despite concerns about AI, 95% of workers recognize the value of working with AI.
  • Complementary innovations: The full benefit of AI is not likely to be realized until there are complementary innovations, like how the development of web browsers and search engines helped maximize the potential of the internet.

PwC forecasts that global GDP will be up to 14% higher in 2030 due to the adoption of AI, equivalent to an additional USD15.7 trillion. It is expected that over half of the gains will come from improved labour productivity. However, the economic benefits of AI will not be evenly distributed, with the United States anticipated to gain the fastest and possibly the most due to its substantial private and public investment in AI research and development and its large number of AI start-ups.

AI and equities

Equity managers can be broadly classified into two styles: fundamental and systematic (quantitative). Fundamental managers conduct in-depth research on individual companies, sometimes using AI tools to complement their analysis. In contrast, systematic managers have long advocated for the use of technology, using computer-driven models to analyze a large universe of stocks.

For example, technological advancements have enabled the Connor, Clark & Lunn Investment Management Quantitative Equity Team to enhance its investment process through increased computing power and greater availability of data. This has led to the team equally valuing their investment philosophy and technology philosophy, with portfolio managers collaborating closely with machine learning and other computing professionals in a fully collaborative environment.

As computers have become smarter and faster, the scope of analysis has expanded. The team has transitioned from using several fast individual machines to a large internal grid for parallel computing, located both in their office and in the cloud, allowing access to thousands of CPUs on demand in a cost-effective manner.

Data has always been central to equity investment management. Today the team can utilize significantly more data due to the increased sophistication of algorithms. The challenge for all asset managers is to narrow thousands of dataset candidates to the ones most likely to provide unique insights and then verify the selected data. This is where machine learning tools excel by transforming large and complex datasets and capturing non-linear relationships to reveal valuable information or organize unstructured data to better assess insights. Data sources are validated through multiple layers, including direct dialogue with data vendors, emphasizing the importance of both human and machine involvement in the process.

While greater availability of data and more powerful computing resources have elevated the systematic equity investment process, it still relies on the collaboration between humans and technology at this stage in the AI evolution.

AI and infrastructure

AI is significantly enhancing the efficiency of various infrastructure assets. There is also a need for substantial investment in the infrastructure network to support AI, including data centres, the electricity required to power them and fibre networks to connect them to users.

The demand for storage and computing power in data centres has surged. McKinsey estimates that global demand could quadruple by 2030. This presents challenges for powering data centres due to their huge appetite for energy. For instance, Microsoft has established a deal with Constellation Energy to supply power for its new data centre in Virginia, and Amazon has similar arrangements with Talen Energy Corporation.

There are many ways in which AI is contributing to enhancing the efficiency of infrastructure assets. For example, while a functioning elevator is important in an office building, it is critical in a hospital where it transports patients to life-saving surgeries. This type of infrastructure asset operates on an availability basis, meaning that if it is not working, deductions are taken from the revenue. AI is being used to predict when an elevator would benefit from early maintenance, thereby reducing potential income deductions due to non-working elevators and improving the return earned on the infrastructure asset.

At airports, AI models are being used to optimize staffing at security checkpoints to match the number of passengers at different times of the day, significantly reducing wait times. The time required to go through airport security will be further reduced when biometric AI technology to capture face-prints is more broadly introduced.

Risks of AI

While AI is making significant contributions in many areas, it is not without risks. A McKinsey survey found that nearly a quarter of respondents were most concerned about data inaccuracy, while cybersecurity was the second-ranked risk.

The concern with data inaccuracy is that “garbage in” implies “garbage out,” meaning we need to be wary of misinformation which occurs when AI unintentionally produces false information. An even bigger concern is disinformation, where unscrupulous people intentionally generate false information using AI. For asset managers, this underscores the importance of verifying any data source being used.

Opportunities and challenges of AI

The economic impact of AI is expected to materialize more rapidly than that of past GPTs, primarily because AI is software-based and can be deployed quickly and efficiently. As the volume of data continues to multiply, it will present both opportunities and challenges. AI is contributing to efficiencies in the asset management industry, particularly in certain segments of equities and infrastructure. However, its influence is expected to extend to many more asset classes over time. Staying abreast of technological advancements is crucial to avoid being left behind or, worse, being replaced by AI.

* Not to be confused with the “GPT” at the end of “ChatGPT” which, in that case, stands for Generative Pre-trained Transformer.