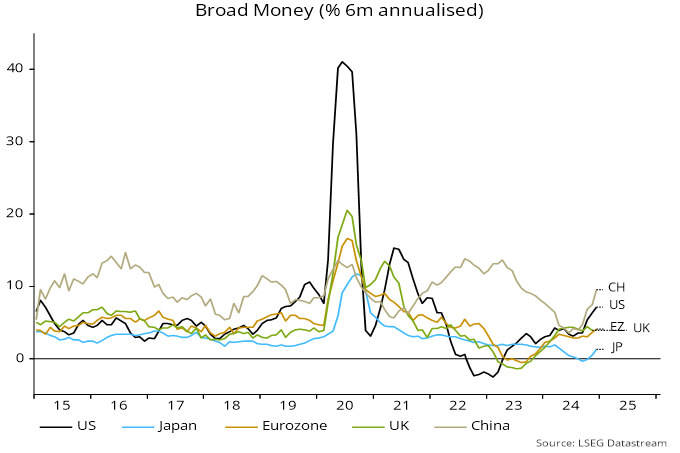
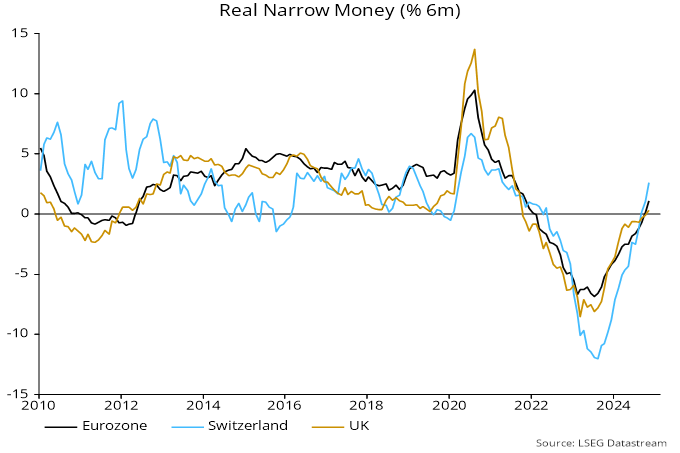
The forecast of global manufacturing acceleration into H1 2025 is playing out but lagged money trends suggest that the pick-up will stall over the spring / summer before resuming in late 2025. A trade war could turn a stall into a more serious set-back.

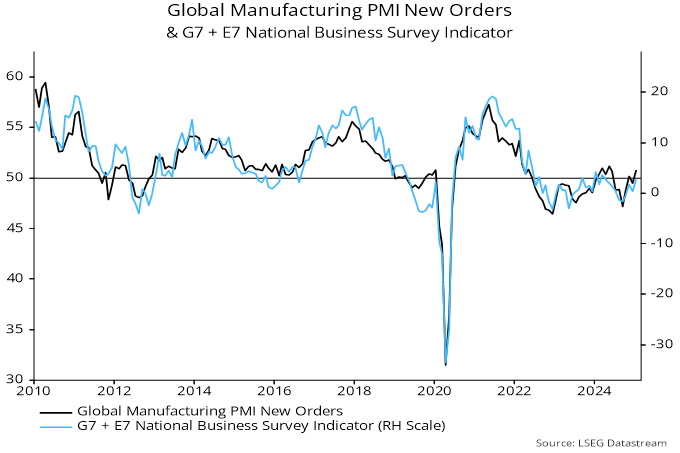
The global manufacturing PMI new orders index crossed back above the 50 level in January, reaching its highest level since May. An alternative indicator combining new orders or output expectations components of national business surveys (ISM for the US, Ifo for Germany, CBI for the UK etc) mirrored the PMI increase – see chart 1.

Chart 1

Chart 1 showing Global Manufacturing PMI New Orders & G7 + E7 National Business Survey Indicator

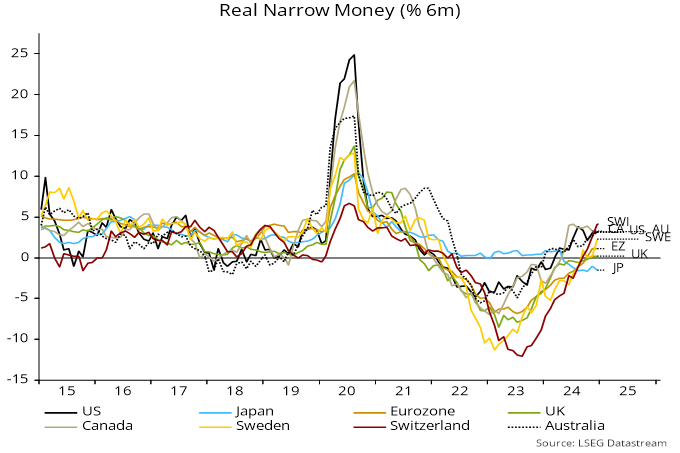
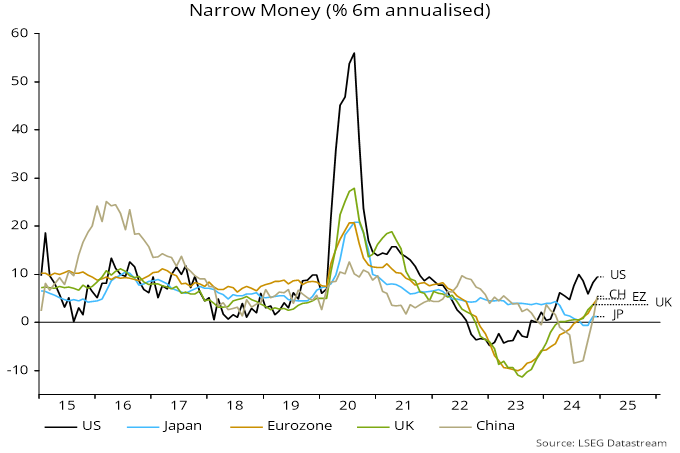
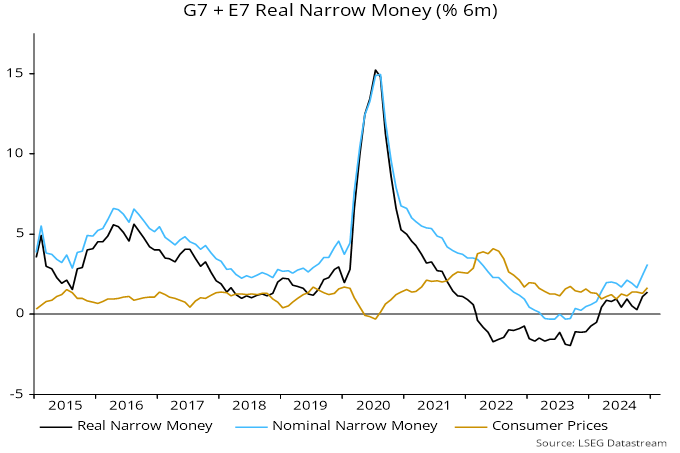
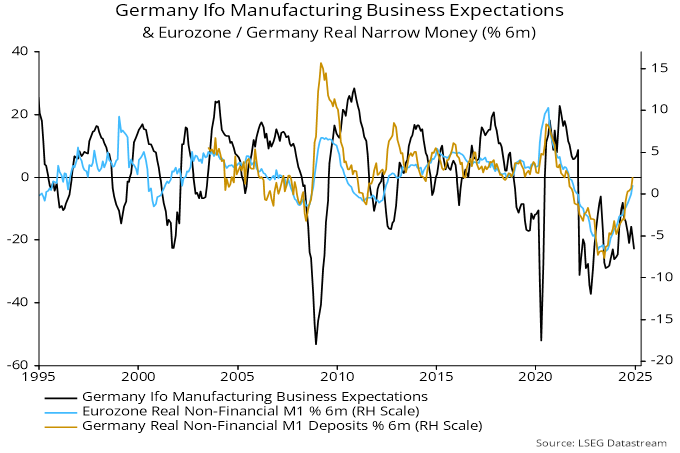
The forecast of a pick-up was based on a rise in global six-month real narrow money momentum from September 2023 through April 2024. Turning points in real money momentum have led survey turning points by 11-13 months in recent years. The survey lows in September 2024 arrived on schedule – chart 2.

Chart 2

Chart 2 showing G7 + E7 National Business Survey Indicator & Real Narrow Money (% 6m)

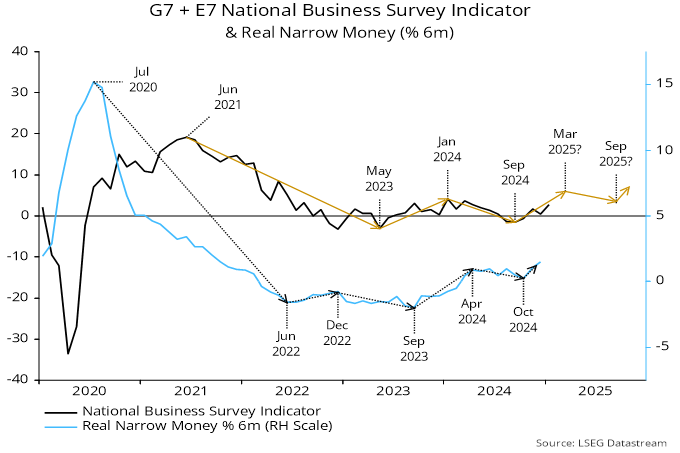
The leading relationship had been the basis for an earlier forecast of a “double dip” in the survey indicators into H2 2024.

The upswing in six-month month real narrow money momentum, however, stalled between April and October 2024, before resuming in November / December. Based on recent lead times, this suggests a local peak in PMI new orders / the alternative indicator around March 2025 and a minor fall through Q3.The latest money numbers are giving a positive signal for late 2025.

This profile, of course, takes no account of possible trade disruption from a US-led global tariff war, which could accentuate mid-year weakness and might also affect monetary prospects (to the extent that negative confidence effects cause households and firms to defer spending, reducing their demand to hold narrow money).

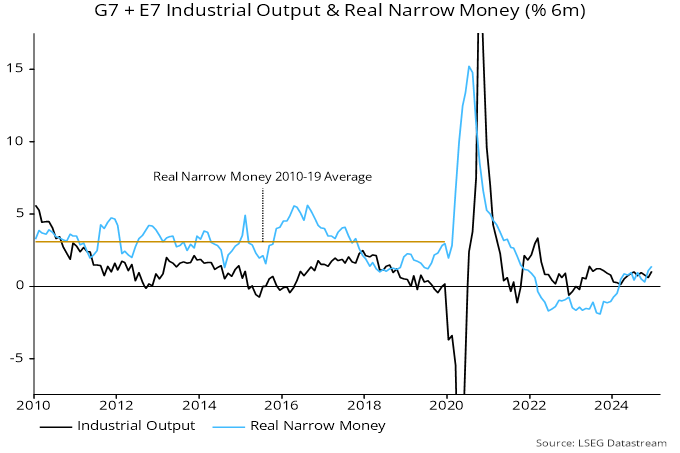
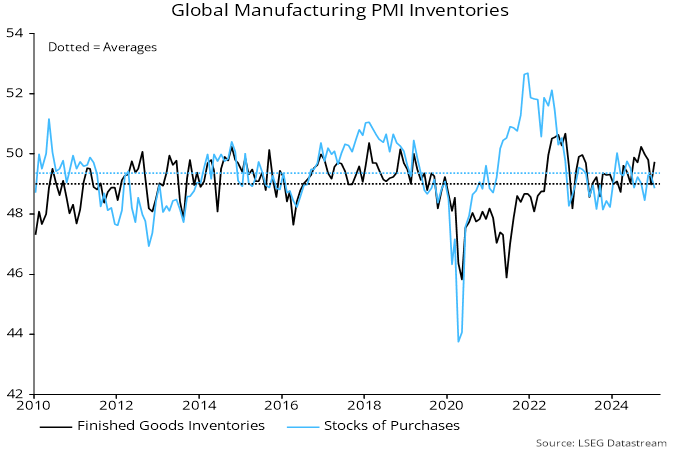
An alternative explanation for the recent manufacturing pick-up is that demand / production has been pulled forward as importers stockpile ahead of new or higher tariffs. Inventories components of business surveys, however, don’t currently suggest unusual behaviour – chart 3.

Chart 3

Chart 3 showing Global Manufacturing PMI Inventories

The forecast of a minor peak in global manufacturing momentum this spring could imply relief for US Treasuries.

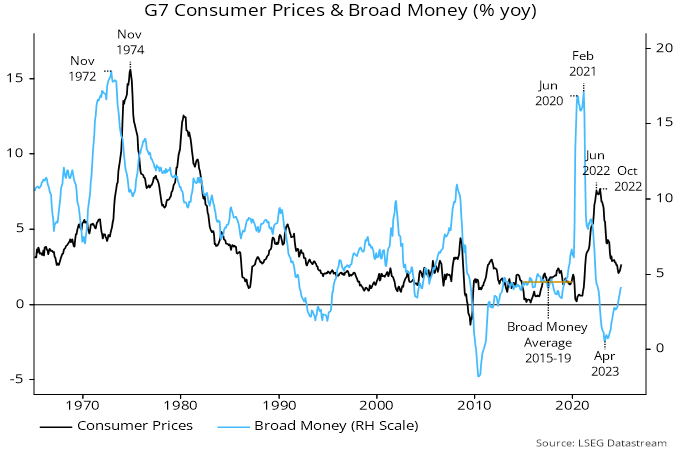
The low / stable inflation environment of the 2010s was associated with a strong positive correlation between Treasury yields and economic momentum. This broke down in 2021-22 as surging inflation became the dominant driver of yields – chart 4.

Chart 4

Chart 4 showing G7 + E7 National Business Survey Indicator & US 10y Treasury Yield

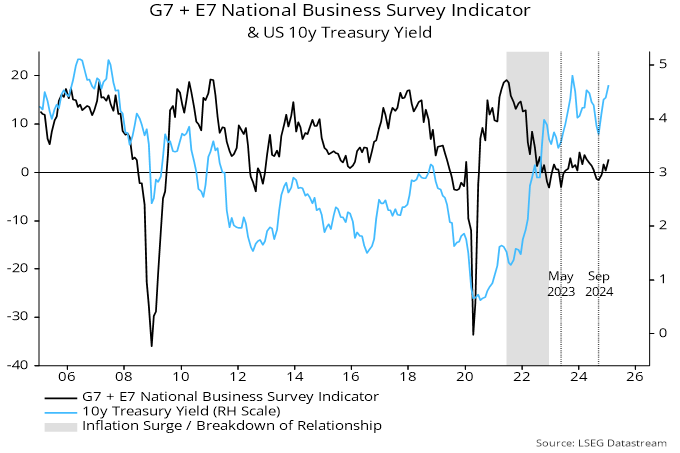
With inflation normalising, the 2010s relationship may be returning. Lows in the business survey indicator in May 2023 and September 2024 were reflected in nearby lows in Treasury yields.

An approaching local peak in the survey indicator coupled with expected further favourable inflation news could open up downside for yields into H2.

UK money trends remain relatively weak, arguing that the MPC bears significant responsibility for economic underperformance.

Narrow and broad money – as measured by non-financial M1 / M4 – rose by 0.4% and 0.3% respectively in December, below gains of 0.9% and 0.6% for equivalent Eurozone measures,

UK six-month real narrow money momentum was static and barely positive in December, in contrast to higher and rising momentum in the Eurozone, Sweden and Switzerland, where policy rates fell by 100-150 bp during 2024 versus the UK’s 50 bp – see chart 1.

Chart 1

Chart 1 showing Real Narrow Money (% 6m)

Six-month growth of (nominal) broad money is similar in the UK and Eurozone (4.1% and 4.0% annualised respectively) but the UK sectoral breakdown is unfavourable – the increase was entirely attributable to households, with corporate money holdings stagnant.

The narrow money decomposition is worse. Six-month momentum of corporate real narrow money remains negative and has weakened since July. Eurozone momentum, by contrast, turned positive in October, rising further into year-end – charts 2 and 3.

Chart 2

Chart 2 showing UK GDP (% 2q) & Real Narrow Money (% 6m)

Chart 3

Chart 3 showing Eurozone GDP (% 2q) & Real Narrow Money (% 6m)

Corporate money weakness suggests that companies were under financial pressure to retrench before the Budget national insurance raid.

The contention here is that household money holdings were boosted by asset sales in anticipation of possible tax changes in the Budget – see previous post. This effect may still be inflating six-month household and aggregate broad money growth.

Households, in any case, are unlikely to be in the mood to spend “excess” money holdings against a backdrop of corporate gloom and rising job losses – unless the MPC accelerates rate cuts.

The MPC’s inappropriately restrictive stance encompasses its QT operations as well as rate policy. The Bank of England’s gilt holdings fell by the equivalent of 3.2% of the broad money stock in the 12 months to December versus comparable reductions of 1.8% and 2.0% respectively in the US and Eurozone (i.e. in Fed holdings of Treasuries and Eurosystem holdings of Eurozone government securities).

Monetary financing of the fiscal deficit (i.e. taking into account commercial banking system transactions in securities and changes in fiscal deposits as well as QE / QT) subtracted from broad money growth in the UK in the latest 12 months versus a neutral impact in the Eurozone / Japan and a significant positive contribution in the US – chart 4.

Chart 4

Chart 4 showing Monetary Financing of Fiscal Deficits* (12m sum, % of broad money) *Monetary Financing = Purchases of Government Securities (ex Agencies) by Central Bank & Other MFIs minus Change in Government Deposits

Brazilian economy, a 1 Real coin over a line chart graphic in a newspaper.

Brazil, the largest economy in Latin America, faced a mixed economic outlook in 2024. With low population growth, inflationary pressures and government overspending, the country navigated through significant challenges. However, certain sectors such as agriculture exhibited resilience, and the government, under President Luiz Inácio Lula da Silva (commonly known as “Lula”), worked on implementing policies to manage inflation and drive economic recovery.

In this recap, we will review Brazil’s economic performance, inflation dynamics, the effects on various sectors and explore potential opportunities for 2025.

Population growth and demographic trends

As Brazil’s population growth slows and the proportion of older individuals rises, the country will face a shrinking working-age population. This poses a significant challenge for the labour market as fewer people will be available to fill jobs and contribute to the economy.

Two line graphs illustrating population growth. Graph 1 shows total population growth of Brazil with a predicted growth past 2025. Graph 2 shows population growth of Brazil by broad age groups, with predicted growth per group past 2025.

2024 performance

Brazil went through a tough year in 2024 with a yearly performance of -29.47% (USD) (MSCI Brazil Index). Consumer discretionary performed the worst out of all sectors with -44.23% (USD). The main driver of the weak performance was linked to a weak Brazilian real. Brazil was one of the first countries to start reducing rates back in August 2023, while the United States had just finished increasing rates back in July 2023.

The currency performance against the USD was nearly -22%, and the currency remains under pressure, reflecting investor skepticism over Lula’s ability to address Brazil’s ballooning budget deficit, reaching a high of 10% of GDP in July 2024. The country faced false hopes when attempting to contain inflation as it reversed back in April 2024. Between January and April, inflation decreased by almost 80 bps, only to shoot up by 110 bps (April to December 2024), ending the year at 4.83% as per the Central Bank of Brazil.

MSCS Brazil sector performance

Sector weights
Sectors 01/31/202401/31
2024
12/31/202412/31
2024
2024 Return (USD)
MSCI Brazil Index 100.0% 100.0% -29.47%
Finance 27.4% 35.3% -38.40%
Energy 22.4% 18.8% -27.20%
Materials 17.0% 14.4% -38.60%
Industrials 9.9% 9.9% -24.30%
Utilities 8.0% 9.2% -30.47%
Consumer staples 7.7% 7.1% -32.06%
Healthcare 2.4% 2.0% -41.51%
Communications 2.6% 1.6% -32.18%
Consumer discretionary 1.9% 0.9% -44.23%
Information technology 0.9% 0.8% -37.53%

Source: Bloomberg

Despite signs of inflation increasing, it took the Central Bank of Brazil until September to increase the Selic rate by 25 bps, followed by 50 bps in November and a final increase of 100 bps in December. Starting the year off with a sentiment of rates reducing to a swift change of aggressive increase caught investors by surprise.

MSCI Brazil Index sector weights (2024 – present)
Line graph showing the different MSCI Brazil Index sector weights over 2024 to present day.
Source: Bloomberg

A company we like in Brazil: Vivara Participações S.A. (VIVA3.SA)

Vivara is Brazil’s number one jewelry retailer with around 435 stores and approximately 21% market share. Vivara was launched in 1962, with new segments such as Life by Vivara, watches, accessories and fragrances completing the product range. Vivara enjoys high returns and strong consumer brand recognition.

During 2024 the company suffered a performance of -46.3% (USD). The performance was attributed to a weak consumer and unexpected management changes. The company is reorganizing the selling space (optimizing the stores) and improving customer experience. It also changed the inventory level in order to support the same-store sales growth acceleration seen in recent quarters (Q3 +13.5%, Q2 +11.6%, Q1 +9.4%) and to reduce stockouts.

SWOT analysis
Strengths

  • Market leader, benefiting from scale
  • Brand recognition with over 60 years in the industry
  • Close to 80% of vertical product integration (lower cost)
Weakness

  • Cannibalization of stores between Life and Vivara brands
Threats

  • Macro and political instability
  • High exposure to gold and silver prices
Opportunities

  • Expanding outside Brazil (Latam countries)
  • Rapid adaptability of life brand
  • Store expansion (aiming for 70 in 2025)

SWOT analysis table

The cycles framework used here suggests a window for global economic strength in H2 2025 / H1 2026 as the stockbuilding and business investment cycles move towards peaks – see previous commentary. This scenario, however, requires confirmation from a pick-up in global real money momentum into mid-2025.

December money numbers are tentatively supportive. Six-month growth rates of narrow and broad money rose across the US, Japan, Eurozone and China – charts 1 and 2.

Chart 1

Chart 1 showing Narrow Money (% 6m annualised)

Chart 2

Chart 2 showing Broad Money (% 6m annualised)

Based on monetary data covering 84% of the aggregate, global (i.e. G7 plus E7) six-month real narrow money momentum is estimated to have reached its highest since 2021 (October). The rise in nominal growth in December was partly offset by an energy-driven increase in six-month consumer price momentum – chart 3.

Chart 3

Chart 3 showing G7 + E7 Real Narrow Money (% 6m)

Several qualifications are in order. The positive signal from the recent pick-up relates to economic prospects for H2 2025, based on the usual six to 12 months lag. H1 performance is expected to be weak, reflecting stalled real narrow money momentum between April and October 2024.

Real money momentum, moreover, remains low by historical standards. A rise at least to the 2010-19 average is necessary to validate a late 2025 / H1 2026 economic “boomlet” scenario – chart 4.

Chart 4

Chart 4 showing G7 + E7 Industrial Output & Real Narrow Money (% 6m)

The rise in longer-term interest rates in the US and Europe since the start of December, meanwhile, could slow or reverse the money growth pick-up.

Despite rising in November / December, US six-month real narrow money momentum remains below its August peak. With China / Europe catching up, US economic and / or equity market outperformance may fade or reverse – chart 5.

Chart 5

Chart 5 showing Real Narrow Money (% 6m)

It is much too early to worry about a money growth revival fuelling another inflation pick-up. G7 annual broad money growth is still slightly below its average over 2015-19, a rate of expansion associated with below-target headline / core inflation outcomes – chart 6. The roughly two-year lag in the relationship suggests further downward pressure on inflation in 2025 and no serious upside threat before late 2026 at the earliest.

Chart 6

Chart 6 showing G7 Consumer Prices & Broad Money (% yoy)

Bab Bou Jeloud gate (The Blue Gate) located at Fez, Morocco at sunset.

MENA equity markets finished the fourth quarter with returns of 0.7% (S&P Pan Arabian Index Total Return), significantly outperforming the MSCI Emerging Markets Index, which was down 8.0% in the same period. For the full year of 2024, MENA equity markets ended up 6.3%, a slight underperformance relative to the MSCI EM Index which was up 7.5%. Through to the end of 2024, MENA markets outperformed the MSCI EM Index by 43.4% and 17.3% over the last five and three years respectively.

Annual return dispersion among the major MENA markets (at the index level) continued to be high this year. The performance differential between the best (Dubai) and the worst (Qatar) market was 29% in 2024. Interestingly, this has also been the quantum range of returns between best and worst in 2023 and 2022. This high level of dispersion is a particularly desirable feature of investing in the region and one we believe is likely to remain given the composition of listed securities in each market (providing different earnings-factor sensitivities), the presence of domestic capital pools dedicated to each market and, more generally, the relatively low levels of foreign ownership in the region.

MENA equities were put to the test this year as they grappled with an escalation in political risk, lower oil price, high interest rates and incremental supply of shares from initial public and secondary offerings. Our view on this was articulated in our fourth quarter letter of 2023 wherein we described our approach to the Saudi market in particular:

Since the end of the first quarter of 2023, we have become more vocal about our concern on valuation levels in Saudi. During this period, we’ve seen an increase in geopolitical risk, persistently high interest rates, and lower oil prices. None of those factors seem (for the time being) to temper local and regional investor enthusiasm for Saudi stocks, particularly mid-caps and IPOs. We believe it is prudent to avoid being overly exposed to situations where, by our estimates, investor positioning and expectations are excessively high. While we remain constructive on the quality of the Saudi-based businesses we own and the country’s structural growth story…we enter 2024 with lower exposure to these stocks. The Saudi market is highly dynamic, and we expect there will be opportunities to rebuild our exposure to those stocks throughout year.

In the same letter, we cited a preference for owning the UAE:

“We are relatively more bullish on the UAE, focusing primarily on banks and quasi-monopoly businesses like utilities and infrastructure. Benign liquidity conditions and strong economic growth favour UAE banks with a solid deposit franchise and strong lending opportunities in 2024.”

Fortunately, that view has largely played out in 2024 (with some exceptions of course), and we now find ourselves in a situation where our relative preference has reversed in favour of Saudi as valuations appear more reasonable. We spoke about this more constructive stance on Saudi in our third quarter letter last year following our trip there in October 2024:

There are three factors working for the strategy at the moment. Firstly, there are growing profit pools resulting from reforms and demographics which is critical to our investing style – growth. Secondly, in the last two months, the market has begun the long-awaited process of recalibrating its expectations of earnings to levels that we deem realistic and interesting – reasonable valuations. Lastly, the strategy has already begun shifting the portfolio to areas where there is a healthy combination of growth, risk-reward and low investor positioning.”

In other markets, we continue to favour Morocco in the portfolio as it represents one of the best structural economic development and equity stories in emerging markets and certainly the region. While the portfolio in Morocco has experienced some turnover in 2024 (primarily due to an exit of a long-held position in the retail sector), we remain committed to our long-term holding in technology and have expanded the portfolio to include companies in healthcare and financial services.

In Qatar and Kuwait, our statement from last year’s letter remains largely relevant today:

We remain selective, with growth remaining constrained, though we see potential in Qatar’s liquified natural gas value chain and are more optimistic about Kuwait following the appointment of a reformist royal as the new Emir in late 2023.

While our optimism on Kuwait may have proven pre-mature, we believe the direction of travel is positive and have continued to build selective exposure over the year, primarily in banks and financial services.

As for Egypt, we expressed an openness to increasing our small ownership last year, subject to the devaluation of currency and a correction of the imbalances in the country’s trade and capital positions.

Egypt remains a wildcard, with an imminent devaluation likely to be the first step in a long journey towards rebuilding policy credibility with investors. That said, we remain open to increasing our ownership in our preferred Egyptian healthcare and technology businesses if opportunities arise later this year.

The Central Bank and the government of Egypt did eventually capitulate and devalued the currency from just above 30/USD to 50/USD. The devaluation came two weeks after the government sealed a mega property deal with one of Abu Dhabi’s sovereign wealth funds. As a result, we felt more comfortable with the medium-term outlook for US dollar returns on Egyptian assets and stepped up our exposure to our technology company by way of a discounted block transaction in June last year that so far has proven rewarding for the portfolio.

In conclusion, the region passed a particularly testing year in 2024. The structural story for the region remains sound and we are confident it will underpin a powerful combination of a multi-year growth in earnings and a low equity risk premium relative to emerging markets. While it is too early to determine what happens in 2025, a strong US dollar, stable oil price and a Trump presidency all bode well for MENA equities.

We wish you a prosperous 2025 and look forward to sharing updates on our strategy with you.

High angle view of illuminated buildings during sunset in Makati City, Philippines.

The strategy focuses on investing in frontier and emerging market companies that our team expects will benefit from demographic trends, changing consumer behaviour, policy and regulatory reform and technological advancements.

Below, we explore several key factors that influenced returns in 2024 and share observations on the portfolio and the markets.

Internet and technology portfolio

The portfolio’s investments in the internet and technology sector propelled returns in 2024. This was driven by FPT Corporation (FPT), the Vietnamese IT services company, which established a relatively early mover advantage in the AI consultancy space. This placed the company firmly in the AI winner camp in 2024 and led to a re-rating of its shares. FPT also benefited from continued IT capex recovery from its traditional markets in the APAC region as well as strong execution in the US and Europe, which drove a ~30% growth in the company’s global IT services revenue in the nine-month period ending September.

The sector also saw strong contribution from Kenya due to improvement in the macroeconomic environment there. This was reflected in a strong appreciation of the Kenyan Shilling and a lower cost of equity that transmitted favourably into the valuation of Safaricom PLC (SCOM) (which we own primarily for its fintech asset, M-Pesa). We took advantage of the macro-induced rally and reduced our exposure to Safaricom in the first half of 2024.

We were also fortunate to have the opportunity to participate in discounted share sales by the private equity owners of Baltic Classifieds Group PLC (BCG), the leading online classifieds group in the Baltics. This helped the strategy increase its investment in the company at attractive prices. BCG continued to flex its market leadership in auto and real estate classifieds through calculated price increases and the introduction of value-added services which translated to an 18% growth in operating profits in the six-month period ending October.

We experienced a drag in returns from our investment in Allegro.eu S.A. (ALE), the leading Polish online marketplace. Allegro’s management provided relatively downbeat commentary in their guidance with their nine-month report which it attributed primarily to competition from Chinese players (mainly Temu). The stock had already come under pressure from the unexpected resignation of Roy Perticucci from his CEO role, and so the incremental negative news on competition put extra pressure on the stock. Fortunately, we decided to reduce exposure to Allegro following the news of the departure of the CEO but the strategy still experienced a drawdown from the stock’s reaction post the nine-month results. We still have a small position in Allegro as we believe it will weather the current competitive pressures given its dominant position in the Polish online marketplace.

While we made changes to our internet and technology portfolio during the year to reflect relative valuation preferences and make room for new ideas, the sector remains the largest bet in the portfolio entering 2025 (the end-of-year exposure to the sector is equal to the average exposure in the year). The combination of improving macro, evolving consumer habits, benign regulatory environment and strong management execution is likely to drive another year of strong earnings growth in 2025.

Retail portfolio

Retail was the second major contributor to returns in 2024, but contribution was top heavy, with the shares of Philippine Seven Corp (SEVN) and Mr D.I.Y. Group (M) Berhad (MRDIY) in Malaysia generating nearly all the returns. With Seven, the resumption of dividend payments (via a special dividend) after a three-year hiatus proved to be a powerful catalyst that woke the market up to the company’s strong fundamentals and growth prospects (14% growth in EPS in the nine-month period ending September 2024 and one of the fastest growing 7-11 convenience store networks in the region).

Mr D.I.Y. Group’s shares benefited from the anticipation of a recovery in demand from the B40 group of Malaysian households (B40 refers to the bottom 40% income group) and the entry of the company in a 49% joint venture with Chinese retailer KKV, as well as a supportive equity market environment in Malaysia last year.

We took decisive action to reduce exposure to this sector in the second half of last year, emboldened by what we deemed to be full valuations following the rally in our core holdings above, and better opportunities emerging inside and outside the sector.

We also saw some pressure on consumer wallets and increased competitive intensity in some areas of the retail portfolio including in the home improvement and grocery categories which we deemed to be persistent and as such triggered selling of underperformers in the portfolio. One such example is Wilcon Depot Inc. (WLCON), the Philippine’s largest home improvement retailer, which is experiencing significant pressure on sales densities as demand for home renovations appear to have stalled after the post-Covid demand pull.

We also exited our long-held investment in Moroccan grocery retailer Label Vie S.A. (LBV) on a combination of slowing growth and concerns on capital allocation decisions that we deemed would be dilutive to minority shareholders.

While we end the year with exposure that is well below the average exposure in the year for the sector, we are bullish on some of the additions we made to the portfolio in the year in UAE grocery retailing and Indonesian variety retail which we hope we can share more information on in 2025.

Fast moving consumer goods portfolio

Consumer goods were the third largest contributor to returns this year, driven by long-term holdings Philippines’ Century Pacific Food Inc. (CNPF) and Indonesia’s Industri Jamu dan Farmasi Sido Muncul Tbk PT (SIDO), or Sido Muncul. Century Pacific’s consistency in delivering on their guidance of low- to mid-teens yearly growth proved to be extremely valuable this year as most other Philippine consumer companies experienced significant headwinds from lower disposable incomes and commodity price pressures. The consistency in delivering is the result of a diversified portfolio of consumer products (mainly canned seafood and meat, and dairy), an exposure to institutional demand from developed markets (mainly canned marine and coconut water) and the large consumer market in the Philippines. This creates natural hedges in the company’s cost structure and foreign currency exposure.

Sido, the herbal medicine company that we have discussed extensively in the past, emerged from a difficult 2023 with operating income growth of ~29% in the nine months ending September. Sentiment on the shares also benefited from a transaction in which the controlling shareholder Irwan family bought out the full 17% stake of Affinity Equity Partners, a private equity investor that had come to the end of its investment cycle in the company. The transaction was done at a 30% premium to the three-month average price, signalling confidence from the family in the prospects of the business, and removing the overhang on the shares that typically arises with late-stage private equity ownership of public companies in our markets.

We remain highly selective in this sector and continue to see pressure on profit pools due to increasing competitive pressures, changing consumer behaviour, and the rise of new distribution channels that are disrupting the competitive advantage that many leading companies have historically enjoyed.

Healthcare portfolio

Healthcare was the fourth largest contributor to returns in the year driven mainly by Morocco’s Aktidal S.A. (AKT) and Turkey’s Medical Parks – MLP Care (MPARK).

Aktidal listed its shares on the Casablanca stock exchange at the end of 2022 and came back to the market for a follow-on offering (USD100 million) last year as growth exceeded the company’s initial expectations. Management at Aktidal expects its bed capacity to increase 2.5x between 2023 and 2026 as it capitalises on the structural undercapacity in the market and a supportive regulatory environment for private healthcare investments that is leading to quick utilisation ramp-ups and strong unit economics.

We invested in MLP early in 2024 as we started seeing encouraging signals from the Turkish government on its intent to reverse course and pursue market-friendly economic policies. MLP benefited from improving sentiment toward Turkish assets as the country received its first credit rating upgrade in over a decade from Moody’s in July. Fundamentally, MLP has established itself as the market leader with a 40% share in the lucrative top-up insurance segment which is the fastest growing payor group in the Turkish healthcare market. MLP has also been making sensible single-site acquisitions which it is successfully integrating into the network.

We experienced some drag in returns from the sector from investments in Indonesia and Thailand where weak equity market sentiment and pressure on payors (insurers and medical tourists in the case of Thailand) led to a de-rating of our stocks at the end of the year. That being said, our position size in that region is relatively small and we are oriented to be buyers of this weakness as growth drivers around demographics and regulations remain intact.

Outlook

We are constructive on the strategy’s positioning in 2025. While the global market environment is uncertain, we believe earnings visibility from our portfolio companies is relatively high in the next two years. As in every year, we reduced valuation risk when appropriate (reducing exposure to areas where share prices ran ahead of fundamentals), and exited underperforming positions where fundamentals are likely to worsen. Positively, we found many areas to invest in and, as a result, find ourselves with low levels of cash relative to the history of the strategy.

We look forward to updating you on the strategy over the rest of the year.

Photo of TJ Sutter and Carolyn Kwan sitting down talking to each other

Introducing our new video series, Viewpoints. Portfolio managers TJ Sutter and Carolyn Kwan discuss what they see as possible trends for the markets in 2025. They look at how the year is shaping up with regard to risks for the Canadian economy, fixed income trends and the impact of potential tariffs.

Market outlook

A look at projected 2025 economic trends and policies in the US and Canada, focusing on interest rates, consumer growth and labour markets. View.

Photo of Carolyn Kwan and TJ Sutter.

Risks

Risks to the Canadian economy include increased volatility, policy uncertainty and inflation, not to mention the political changes in the US and Canada. View.

Photo of TJ Sutter.

Tariff war

The impact of US tariffs on Canada and potential economic responses. View.

Photo of Carolyn Kwan and TJ Sutter.

Fixed Income

In a volatile market, active fixed income strategies consider the risks and expectations for inflation, interest rates and market reflexivity. View.

Photo of Carolyn Kwan.

Young business professionals working together in a in modern co-working space in Sweden.

Amid the overall pessimism toward European economies, one of the reasons provided most often for the underperformance relative to the United States is a lack of innovation and entrepreneurship. Many data points tend to confirm this:

  • Over three times as many patents are filed in the United States annually than the entirety of Europe.
  • Research and development (R&D) is 2.8% of GDP in the United States vs. only 2.2% for Europe.
  • Average time to go through filings to start a business is 3-5 days in the United States and up to multiple weeks in Europe.
  • The United States attracts the lion’s share of global venture capital (VC) investment; over three times of the $50 billion attracted by Europe in 2023.

It is worth noting, however, that Europe has one large outlier when it comes to innovation: Sweden. Within Europe, Sweden easily stands out as one of the most entrepreneurial and innovative countries, raising questions from its neighbours as to how their success can be replicated. While entrepreneurship metrics have, by some measures, declined in the United States over the past 30 years, Sweden has seen the opposite trend.

So, what differentiates Sweden from its neighbours, and can it be replicated?

There is a case to be made that part of it stems from a cultural aspect. Swedish demographics have historically been described as high on social trust and cohesiveness, driven by a small historical level of immigration, similar to Japan or South Korea, but it is probably only part of the overall picture. Other likely factors include:

  • Entrepreneurship training in Sweden being taught in high school since 1980, with over 30% of students today participating in such programs. Other Nordic countries, on the other hand, started this type of program only in the mid-1990s and on a much smaller scale than Sweden did.
  • Risk-taking being socially encouraged and celebrated, with a common perception that opportunities are plentiful. Social safety nets also allow for failure and risk-taking.

Possibly as a result of this, Sweden’s VC market is more vibrant than other Nordic countries and has contributed directly to building Sweden’s reputation as a hub for technological innovation through its higher focus on early-stage investments. Furthermore, VC investment is well supported by the government through tax-incentives, grants and funding programs. Consequently, Sweden has the largest private equity capital raised as a share of GDP in Europe, trailing only Luxembourg. On its own, Swedish VC is estimated to have contributed 1.5% of total GDP growth on its own and has had a direct impact on creating more highly skilled, specialized jobs than its neighbouring countries.

Circle graph of private equity investments in Swedish countries.

It is therefore no surprise that Global Alpha is quite positive on Sweden’s long-term prospects and has had no trouble finding quality names for our portfolios. We profile two such names here.

Sdiptech AB (SDIPB SS) is a so-called industrial “serial acquirer,” a unique Sweden-based business model that consists of growth mostly through small, niche acquisitions without necessarily seeking material synergies or trying to integrate with the existing businesses. It acts as a forever-owner of companies where the founder is looking to sell their business, make sure their employees are well taken care of and don’t want to sell to private equity. Sdiptech focuses on acquiring businesses that are already cash-flow generative, as it finances its acquisitions purely through debt and not equity dilution. Its acquired companies operate along one of the four segments of its reporting structure: supply chain & transportation, water & bioeconomy, safety & security and energy & electrification. Most of its sales are aligned with the UN societal development goals. The company also differentiates itself from other serial acquirers through its comparatively strong organic growth profile (in addition to consistent M&As) and its lower leverage than peers, resulting from its smaller scale and more focused end-markets.

Another company we own in Sweden is Biogaia AB (BIOGB SS), a producer of probiotic supplements founded in 1990 by Peter Rothschild and that is present in over 100 markets. Probiotics is a USD71 billion global market with an expected CAGR of 8% over the next five years, driven by higher health awareness and shifting preference toward preventive healthcare. Biogaia differentiates itself from peers on two aspects: its global reach and its science-driven, innovative approach to product development. Biogaia is the only probiotic provider that continuously collaborates with universities globally on research to maintain its differentiated product from more generic peers who usually spend less than 1% of their sales on R&D, allowing it to sell at a premium with less discounting than its competitors.

It is probably an overstatement to say that Sweden is better today at fostering innovation than its North American counterpart. Nonetheless, it is noteworthy that Sweden has been trending more toward a dynamic bottom-up approach to innovating whereas observers tend to agree that the US economy has evolved into an environment that tends to favour incumbents over new entrants, thanks to softer regulations around lobbying and a higher rate of regulatory capture. We remain globally diversified and are optimistic on the growth prospects of both the United States and Sweden going into this new year.

Hiker looking off at the sun over the horizon.

2024 marked another landmark year for Banyan Capital Partners. We continued on our journey of strategic growth, adding new investments and delivering long-term value to our investors.

New to Banyan and recent promotions

Photo of David Beaumont
David Beaumont
to Director
Photo of Marat Altinbaev
Marat Altinbaev
to Partner
Photo of Scott Morrison
Scott Morrison
to Principal
Photo of Igor Verechaka
Igor Verechaka
to Vice President
Photo of Gordon Yee
Gordon Yee
to Associate
Photo of Miranda Li
Miranda Li
to Associate
Photo of Alizeh Haider
Alizeh Haider
has joined as Senior Analyst
Photo of Alex Gelmych
Alex Gelmych
has joined as Analyst
Photo of Kye Johnston
Kye Johnston
has joined as Accountant

These promotions and additions reflect our culture of professional growth and recognizing the contributions of our team members. Our team’s development is integral to our ongoing success and capacity for identifying and nurturing promising investment opportunities and growing our investment portfolio.

Learn more about our team and their roles.

New platform investment

Decorative.

Stagevision

Founded in 1984, Stagevision provides a range of services in professional audiovisual production and management, including the assembly of sets and soft goods products, short-term rental of audiovisual equipment, and simultaneous interpretation services to businesses and related agencies across both Canada and the United States.

We’ve partnered with the Company’s CEO, Scott Tomlinson, who has served in this role since 2021, to execute on the business’s next phase of both organic and M&A-driven growth.

Portfolio spotlight

Decorative.

Oakcreek

In November 2024, Oakcreek was pleased to announce the promotion of Patrick Nolan to President and CEO. Patrick was formerly CFO of the business and will be succeeding Barrie Carpenter who will serve as Chairman of the Board of Directors.

Decorative.

Second Nature Designs

In January 2024, Second Nature was pleased to announce the appointment of Guido Romagnoli to the position of President and CEO. Guido was formerly COO of Hunter Amenities International, a global manufacturer of health and beauty products.

Learn more about our current investment portfolio.

Looking ahead

As we move into 2025, our focus remains on identifying new investments in middle-market businesses across North America while maintaining our commitment to long-term value creation. We will continue to leverage our expertise and network to foster strategic partnerships, ensuring sustainable success for our portfolio companies and investors.

New investments

We continue to actively seek to invest in businesses with EBITDA of at least $5 million.

Do you have an opportunity in mind? Explore our investment criteria or connect with us today.

Whisper it softly but Eurozone economic prospects are improving.

Six-month momentum of real non-financial M1 turned positive in October, reaching a three-year high in November. The recovery has been broadly-based across countries, with German momentum slightly above the Eurozone average – see chart 1.

Chart 1

Chart 1 showing Germany Ifo Manufacturing Business Expectations & Eurozone / Germany Real Narrow Money (% 6m)

The sectoral breakdown shows that real M1 deposits of both households and non-financial corporations have returned to growth – in contrast to the UK, where corporate narrow money is still contracting, in nominal as well as real terms.

Economic news supports further policy easing. Six-month headline / core CPI momentum is close to target (2.1% / 2.2% annualised respectively in December) and there are signs of labour market softening, including a pick-up in consumer unemployment expectations – chart 2.

Chart 2

Chart 2 showing Eurozone Unemployment Rate & Consumer Survey Unemployment Expectations

The Swiss National Bank started cutting rates in March, three months before the ECB, with the cumulative reduction now 125 bp versus 100 bp in the Eurozone. Swiss six-month real narrow money momentum is stronger and likely to be matched by the Eurozone soon – chart 3.

Chart 3

Chart 3 showing Real Narrow Money (% 6m)

The UK is lagging because the backward-looking MPC started later with cuts of only 50 bp. A stall in six-month real narrow money momentum from last spring signalled that the economy was heading for renewed stagnation well before the end-October Budget.

Improving Eurozone economic prospects may partly explain a spate of upgrades to corporate earnings forecasts by equity analysts. A positive January revisions ratio contrasts with negative readings in the US / UK and supports the monetary suggestion of a recovery in manufacturing surveys – chart 4.

Chart 4

Chart 4 showing Germany Ifo Manufacturing Business Expectations & MSCI EMU Earnings Revisions Ratio (IBES, sa)