This is a two-part series on small caps. This week, we look at historical small caps performance, recent small caps performance and the reasons behind the unexpected. Next week, we’ll dive into what this means for allocators and skeptics.
The case for a meaningful small-cap allocation in institutional portfolios
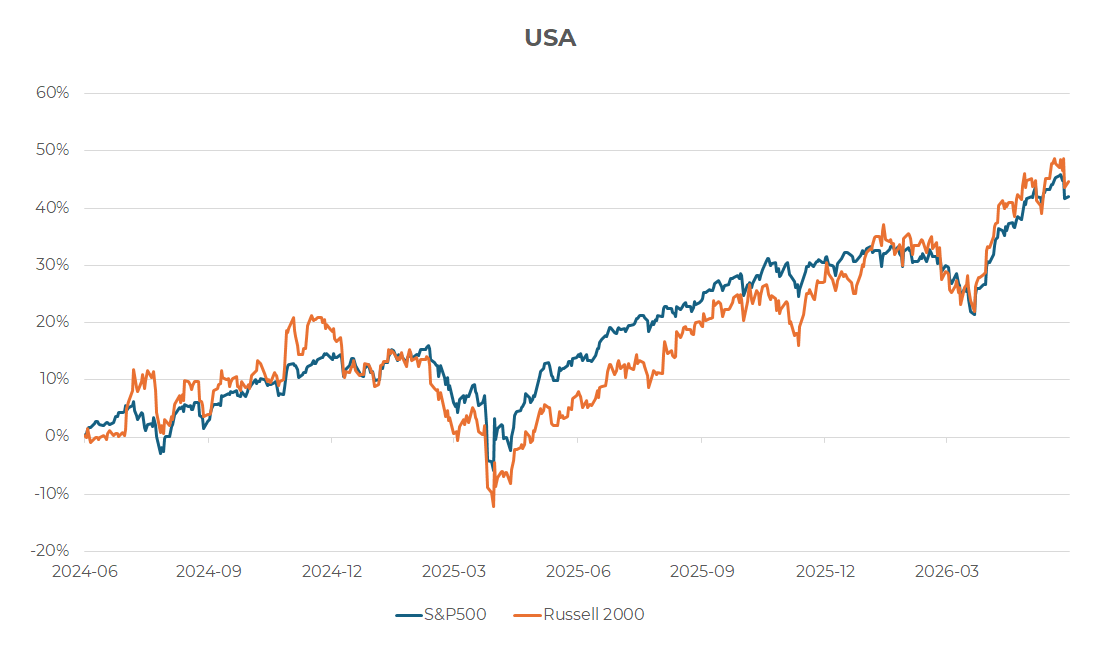
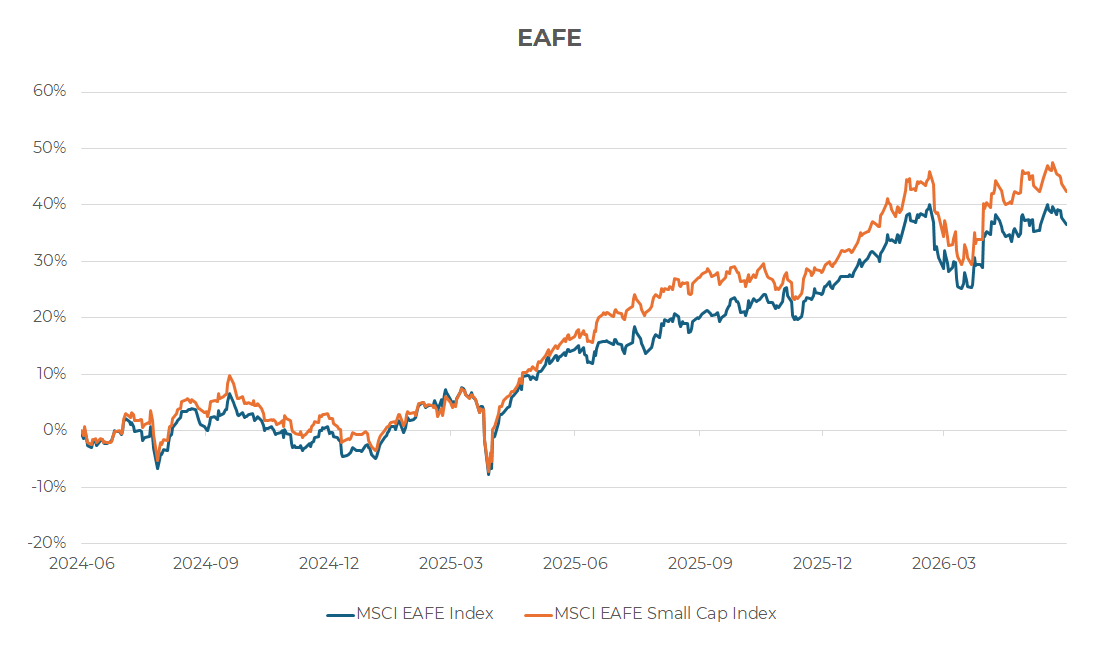
Small caps have just done something the textbook says they should not have. Since the Middle East conflict began at the end of February 2026, small caps have outperformed large caps on both sides of the Atlantic – through an oil-price spike, a sharp re-pricing of European front-end rates and deeply negative eurozone economic surprises. Inside those headline numbers, that is not the behaviour of an asset class to be avoided.
Source: Bloomberg
Small caps have outperformed large caps on both sides of the Atlantic for the last two years.
Source: Bloomberg
Crowded at the top, despite a universe of options
MSCI’s classification methodology defines small caps as roughly the bottom 14% of free-float market capitalization in each country it covers. This creates a universe that spans over 12,000 listed companies and the institutional allocation to that universe has, if anything, contracted. Even within the S&P 500, long-only funds remain overweight the largest quintile by market cap and underweight the smallest. The result is a public-equity allocation that, for all its sophistication, is structurally tethered to the same fifty or so mega-caps that everyone else owns.
As we observed in our September 2025 article, “Why small caps are built for what’s next,”* three of the four episodes of extreme S&P 500 top-ten concentration over the past century – the Go-Go conglomerate years, the Nifty Fifty, and the dot-com boom – were each followed by extended periods of small-cap leadership. Top-ten concentration at the dot-com peak reached 37.0%; today it stands at roughly 40%. The fourth episode, today’s AI-and-Mag-7 configuration, has not yet resolved. An allocator who treats the current setup as permanent is implicitly betting that this time is different, despite repeated historical evidence.
Why small caps matter through the cycle, not just at the turn
Small caps earn a place in the policy mix on three grounds independent of timing the next rotation.
- Breadth of opportunity.
The small-cap universe is where most listed companies actually live, offering diversified factor and theme exposure that a mega-cap-dominated large-cap book does not provide. Further, the sector composition is materially different from large caps; US small caps carry more industrials, financials and real estate than US large caps, against an underweight in technology. - Direct, undiluted exposure to the themes that matter.
Reshoring, European fiscal expansion, defence, grid and AI-infrastructure build-out and Japanese corporate reform all get expressed more purely through small caps than through the large-cap index, because the pure-play, picks-and-shovels companies in these themes are typically not listed at large-cap market capitalizations. - Differentiated economic exposure.
According to research by Kepler Cheuvreux, European small caps generate roughly 60% of revenues from within Europe, versus roughly 33% for the blue-chip 50. This domestic tilt has become a feature rather than a bug in a world of recurring trade frictions, and the pattern broadly extends across EAFE.Bloomberg data indicate that Japanese small caps generate roughly 65–75% of their revenues domestically, compared with about 45% for TOPIX large caps. That domestic exposure leaves them well positioned to benefit from the emerging global order.
Unexpected outperformance: How are small caps doing it?
The cyclical setup we identified previously – technological disruption, top-of-market concentration, valuations well above long-run averages – remains in place. The conditions since end-February 2026 have been textbook unfavourable for small caps. Per Kepler, European front-end rate expectations re-priced sharply higher, eurozone economic surprises turned deeply negative, and oil spiked before partially retracing. Kepler’s analysis of monthly relative returns since 1994 shows European small caps have, on average, underperformed large caps by roughly -0.29% per month in OECD-defined “downturn” phases and -0.43% per month in “slowdown” phases. That headwind has not materialized.
And yet, small caps are outperforming large caps. Two features of the outperformance are worth flagging:
- Outperformance has been broad-based across sectors rather than carried by a narrow theme: Kepler’s sector-level data since February 27, 2026 shows positive median small-cap performance against negative median large-cap performance, with European small caps outperforming large caps in nearly every sector.
- Small caps’ historical sensitivity to bond yields has visibly weakened – per Kepler, the relative performance of European small caps versus large caps has materially decoupled from the German Bund yield since early 2025, breaking a relationship that had held for most of the post-2021 period.
The asset class is no longer waiting for rate cuts.
The valuation picture is the cleanest piece of the case. On Kepler’s data, European large caps trade at roughly 15.2x forward earnings against a long-term average since 2009 of 13.2x. European small caps trade at 14.4x against an average of 14.8x. The US picture is similar: BofA Global Research reports the relative forward P/E of the Russell 2000 versus the Russell 1000 is approximately 0.82x, and historically the relative forward P/E explains roughly 46% of the variability in subsequent 10-year relative returns.
Next week: turning the case into allocation
Small cap performance has been unexpected, but not entirely surprising. As investment managers specializing small caps, we know what small caps are capable of. Now that this market segment is regaining the attention of investors, what does this information mean for portfolio allocations? How can allocators adjust their underweight? We’ll discuss those details in next week’s commentary.
Global Alpha was founded on the conviction that small caps are an inefficient asset class in which an experienced team can generate alpha across a full cycle. We are happy to discuss how a small-cap allocation can be sized within a particular plan’s constraints, and how our Global and International Small Cap strategies have navigated the recent environment.
* Contact us for a copy of this article.


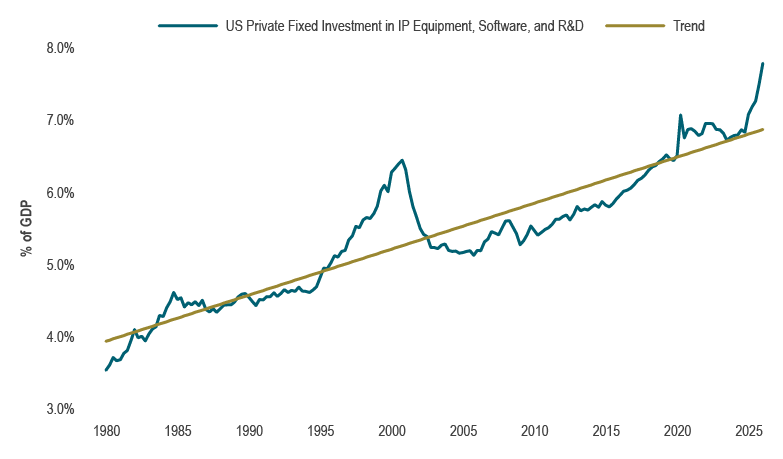 Source: US Bureau of Economic Analysis, Macrobond
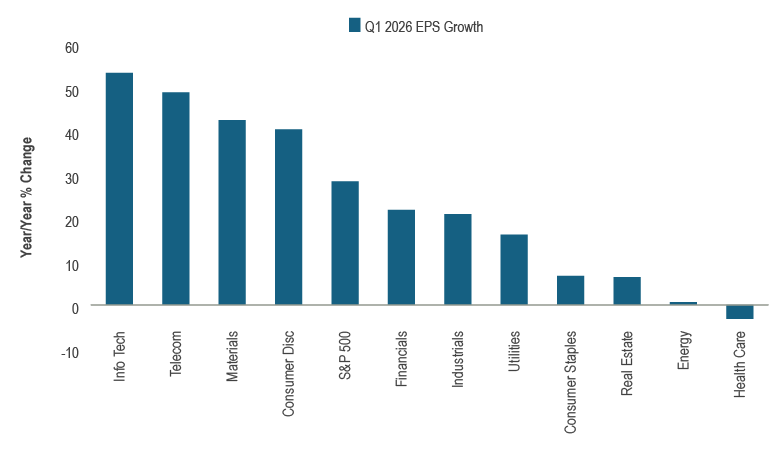 Source: FactSet. Note: As of May 21, 2026
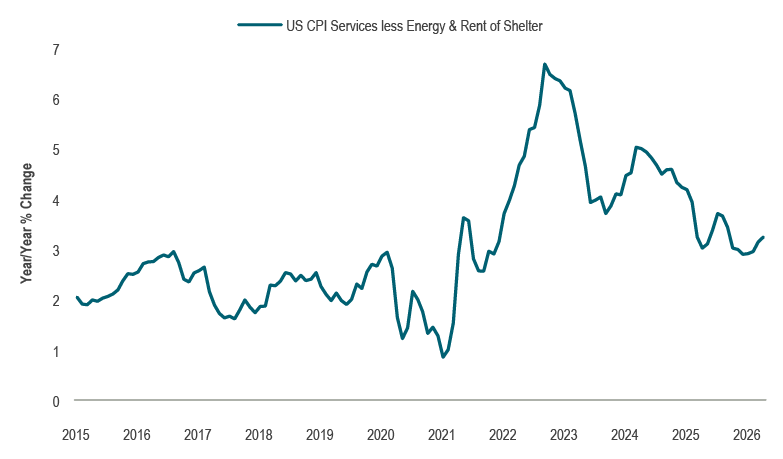 Source: US Bureau of Labor Statistics, Macrobond
 Source: US Bureau of Labor Statistics, Macrobond