Commentary
November 2023 Outlook: Asset markets as the end of the cycle approaches
November 16, 2023

Markets have long anticipated an economic downturn, and looking beyond it to a potential decline in interest rates as central banks step in to support the economy. A key indicator has been the deeply inverted yield curve over the past year and a half. In the last couple of months, the US Federal Reserve, Bank of Canada and other major central banks seem to have reached the peak of their rate-hiking cycles. We are now in a late stage of the business cycle where central banks have stopped raising rates, but are not yet easing policy. Over the last 40 years, this transitional period has lengthened because central banks generally have not overtightened, which would necessitate an immediate and sharp U-turn to an easing cycle. Before 1985, the median period from the last rate hike to the first rate cut was about two months, but this extended to eight months after 1985 (see Chart 1). Thus, in the past few decades’ business cycles, there have been times when markets, absorbing new data, anticipated a soft landing. However, initial signs of slowing can also forewarn of a more severe downturn.
Chart 1: Longer lags between policy shifts
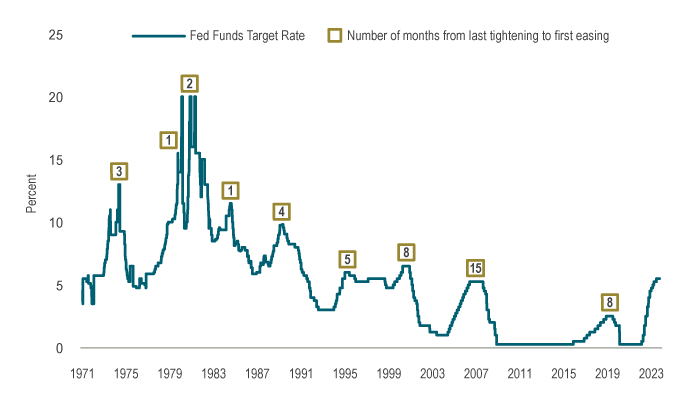
Source: Federal Reserve, Minack Advisors, Macrobond
If a yield curve inversion signals economic slowdown, its normalization often coincides with that slowdown. As the yield curve transitions from inverted to flat, and then back to normal (where long term bond yields are above short term yields), unemployment tends to rise, economic activity falls and inflation decreases. Notably, the two-year to 10-year US Treasury yield curve moved from a -93 basis points (bps) inversion in July to just -20 bps at the end of October (see Chart 2).
Chart 2: Normalization is a precursor to recessions
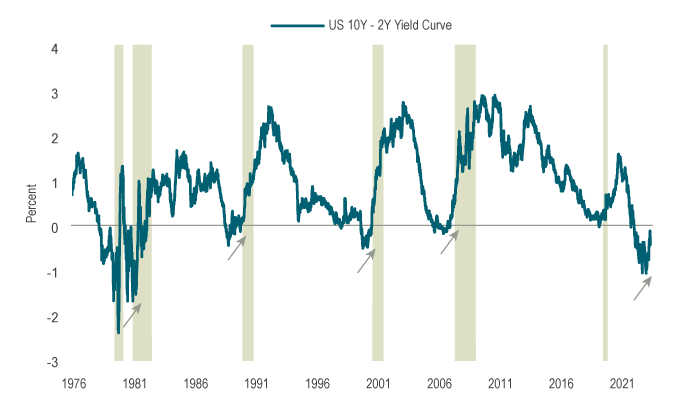
Note: Shaded area represents US recessions.
Source: US Department of Treasury, Macrobond
Equities weaken in a downturn but fare better in a soft landing. However, even if, in today’s cycle, we end up in a soft landing scenario, the strength of equities is uncertain due to considerable optimism already priced into the market. Forward earnings, especially in the US, appear overly optimistic. For instance, 2024 earnings are forecasted to rise by 12.5% above this year, but if a recession materializes, earnings are likely to decline outright. This is evident as third quarter earnings report marginally weaker revenues, despite a strong 4.9% quarter-on-quarter annualized real GDP growth. Additionally, current equity valuations remain high by any metric. Thus, the asymmetry of outcomes stands out — in a hard landing, equities could face material declines, while even with a soft landing, upside may be limited.
Within the S&P 500 Index, the “Magnificent Seven” large-cap tech stocks have driven all year-to-date gains, now comprising nearly half of the Russell 1000 Growth Index, up from 12% a decade ago. This late-cycle phase has also seen small-cap stocks underperforming, in line with the latest NFIB survey of small and medium-sized businesses remaining low. Higher wages and operating costs are weighing on profit margins, with interest paid on loans reaching 10% in October (see Chart 3), the highest since the early 2000s. The full impact of higher rates on companies is still unfolding, but is becoming increasingly evident.
Chart 3: Interest costs are biting
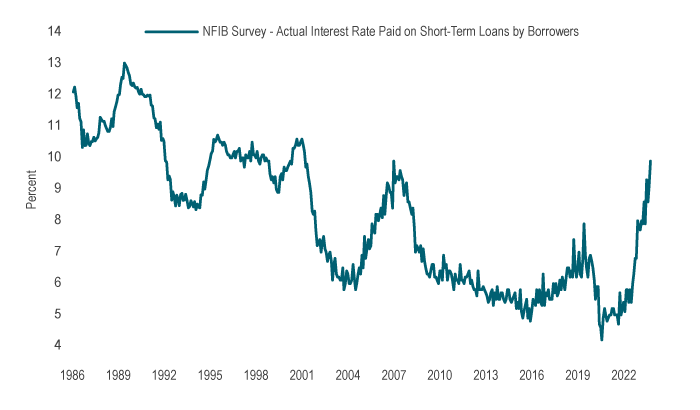
Source: National Federation of Independent Business, Macrobond
In contrast, bond returns have been weak for an unprecedented third straight year driven by a sharp increase in yields, which are now back at long-run averages. In October, US 10-year yields crossed above 5%, with real yields at 2.1%, the most attractive levels in over 15 years and comparing favourably relative to earnings yields on equities (see Chart 4). The FTSE Universe Bond Index in Canada and the Bloomberg US Aggregate Bond Index yielded 5.1% and 6.5%, respectively, at the end of October, a significant increase from around 1% a few years ago. While investors can assess for themselves whether interest rates will go up or down from here, it is certainly true that bond yields are more attractive today than before, with greater potential for capital gains, especially if a downturn occurs. Recent data, notably in the US labour market, is demonstrating the excess demand conditions are moving back towards balance with the gap between labour demand and supply halving since its peak. A modest rise in continuing jobless claims suggests that, on the margin, jobs are becoming harder to find. Given these factors, we are increasingly cautious on risk assets, including small-cap stocks, and more positive about bonds as the year concludes.
Chart 4: Bond yield and earnings yield gap is closing
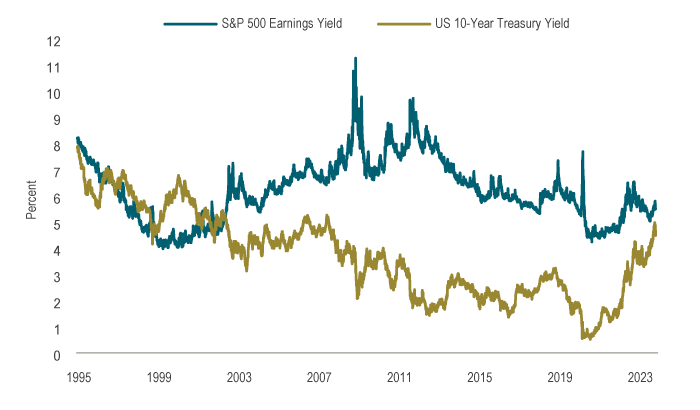
Source: US Department of Finance, I/B/E/S, Macrobond
Capital Markets
October was another tough month for markets, with both equities and fixed income showing weakness. The horrific attack by Hamas on Israel early in the month raised concerns about a wider conflict in the Middle East, and elevated geopolitical risks. However, the direct market impact of this so far appears to be muted, with efforts made to limit a broader escalation in the region. The effect on oil, and safe-haven assets such as gold was generally subdued, with initial short-lived rallies followed by a decline in prices, ending the month only modestly higher.
In Canada, two-year interest rates fell 16 bps and rose by 5 bps at the 10-year term, leading to a 0.37% gain in the FTSE Canada Universe Bond Index. In the US, 10-year Treasury yields surged 33 bps over the month, marking the sixth consecutive month of increase, and closed October at 4.93%. This surge in yields was a response to strong economic indicators, such as the third-quarter GDP report. The rising yields contributed to equity markets ending lower for the third straight month, a trend not seen since March 2020. The S&P 500 fell 2.1%, while the S&P/TSX Composite Index dropped 3.2%.
Portfolio Strategy
The market is still adjusting to the new reality of higher interest rates (and responding very favourably when yields fall). The path for risk assets depends heavily on the unfolding economic scenario. The US is holding in, aided by strong fiscal policy thrust. However, the longer interest rates stay elevated, the greater the risk of a hard landing. Against that backdrop, equity markets seem to be anticipating a very optimistic outcome. Thus, our asset mix for balanced funds remains overweight cash while equities are underweight. At the same time, current bond yields are becoming more attractive, prompting us to assess the opportunity to increase our bond allocation. Our fundamental portfolios continue to focus on stable, defensive companies as we anticipate an increase in equity market volatility. Fixed-income portfolios are looking to add to positions that will benefit from the yield curve moving toward normalization, and remain underweight credit, anticipating wider spreads.
As we approach the late cycle phase, the high level of interest rates is dominating both the macroeconomic and investing environment. We remain vigilant on the growing risks as the year closes out.