Commentary
June 2023 Outlook: Resilient economy, but resilient markets?
June 15, 2023

An Apple (plus FAMNNGT*) a day keeps the doctor away.
Recession talk has given way to discussions on the resilience of economies and the reasons behind it. The reasons include excess household savings, companies holding on to workers, reduced labour market friction with the ability to source skilled workers remotely and still obliging fiscal support. Equity markets, especially in the US, have broadly cheered the economic stability. As growth defies expectations, the S&P 500 Index has risen 11% year-to-date (YTD), which lags the even more buoyant European and Japanese equity markets. The upbeat sentiment was helped, at least until mid-May, by interest rates that took a breather to start the second quarter following a turbulent first quarter. This equity market resilience has come despite the counterpart to economic strength: inflation. Both the US core PCE Deflator and the Federal Reserve’s (the Fed’s) “supercore” measure, which follows underlying services prices excluding shelter costs, are struggling to fall below 4.5% year-on-year.
The equity market enthusiasm has been supported by strong fundamentals compounded by a new bullish narrative surrounding anything related to artificial intelligence (AI). Indeed, there has been a rotation in market leadership since early in the year from energy, materials, financials and industrials to the technology juggernaut. To be sure, our fundamental outlook is supportive of the significant opportunities arising from AI-induced productivity enhancements. It is also aligned with our secular theme of the coming capital spending boost, that to date had encompassed building resilient and redundant supply chains, alongside greening of energy sources and now investments incorporating AI.
More recently however, equity market leadership has become extremely narrow. One way to see this is in the performance of the S&P 500, where constituent weights float with the market capitalization. The S&P 500 is up 10% YTD as of the end of May. However, when each company in the Index is given equal weight, the Index has slightly negative performance for the same period, creating a gap of a hefty 10 percentage points (see Chart 1). Another way to illustrate this is by splitting the S&P 500 into the top eight performers and the remaining 492 companies (see Chart 2). The market value of these eight megacap tech stocks as a share of the Index has surged from 22% in January to 30% in June.
Chart 1: Largest capitalization stocks driving gains
Indexed at 100 on 12/30/2022
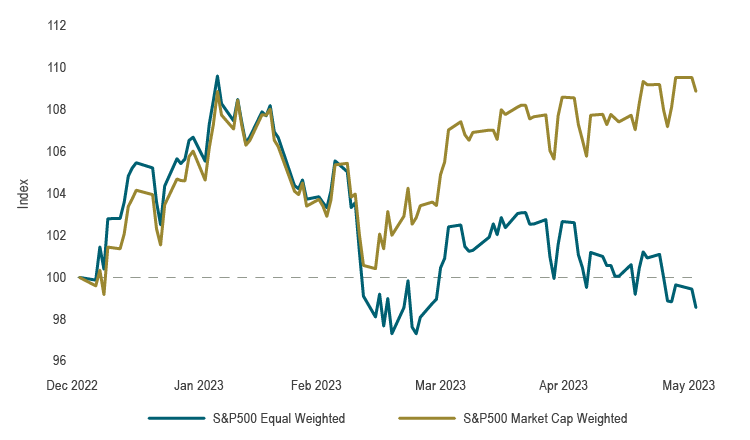
Source: S&P Global, Macrobond
Chart 2: Megacap tech stocks have surged
Indexed at 100 on 12/30/2022
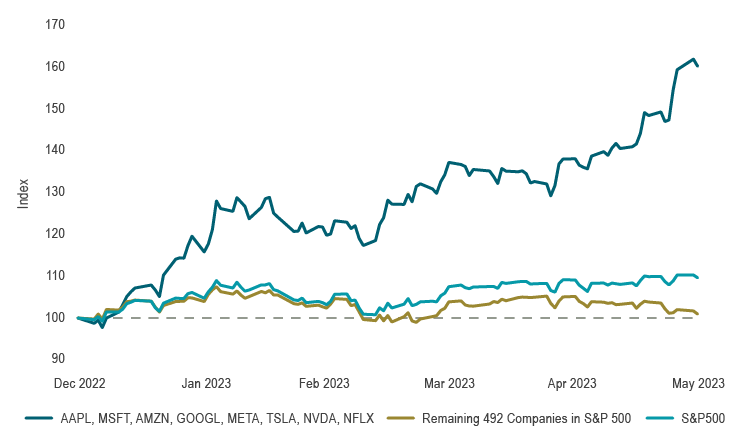
Source: S&P Global, Macrobond
Only a handful of companies driving the Index’s is not healthy. When market breadth is broadly based, it is a signal of broad-based growth across various industries and the overall economy. In contrast, the increased concentration of market leadership implies rising risk and scarcity of growth. Evaluating the premium valuations of these high-flying stocks becomes challenging, as their prices become disconnected from fundamental historical relationships. Indeed, if AI is a ‘gamechanger’ in terms of the way companies will operate, productivity benefits should accrue broadly, and not only within the immediate AI-winners. We do not disagree with the potential upsides to come from the AI revolution, but this current market rally appears fragile, despite a recent improvement in market breadth in early June.
Short-term hazards remain
There is growing evidence of credit contraction (see April Outlook), and a recession continues loom closer. While the latest earnings season provided better-than-expected earnings, corporate profits are set to decline during an economic downturn. The vast majority of companies in the S&P 500, the “S&P 492,” may not be buoyant, but they have also not yet fully priced in the economic slowdown, as earnings forecasts remain optimistic. Interest rates are once again on the upswing as central banks reassess whether current levels are sufficiently restrictive (see May Outlook, as well as recent moves by the Reserve Bank of Australia and the Bank of Canada).
More immediately, the resolution of the US debt ceiling gridlock has buoyed sentiment, but also presents a potential market risk. While the US Treasury was prohibited from borrowing after hitting its limit, it had to deplete its chequing account held at the Fed, known as the Treasury General Account. The balance of this account stood at approximately US$39 billion at the end of May and needs to be replenished to about $600 billion. In addition, the Treasury was unable to issue bonds since hitting the debt ceiling. Now that issuance has resumed, this new bond supply comes at a time when banks are being asked to raise cash reserves to avoid further bank failures. Coupled with ongoing quantitative tightening, elevated recession risks and already high valuations, liquidity will be withdrawn from the markets, posing short-term risks.
Capital markets
Apart from the enthusiasm over AI-fueled tech stocks, markets were generally weak during a month with no shortage of headlines. Most notable were the US debt ceiling negotiations, which created significant stress on US one-month T-bills, causing their yields to surge to 7% at one point. However, the resolution and the smooth passage in the House of Representatives and Senate were welcomed by markets. The month also saw consistently higher-than-expected inflation readings and decent momentum in economic activity, which led to interest rate hikes from both the Fed and the European Central Bank (ECB). Additionally, there were renewed concerns over US regional banks earlier in the month, as First Republic Bank, the third bank to fail, was acquired by JPMorgan.
While the tech sector exhibited remarkable strength, equity markets saw little upside elsewhere. The Nasdaq Composite Index headed up the leaderboard with a 5.9% gain, with megacap tech stocks also helping the S&P 500 stay positive. Elsewhere has been marked by sell offs. Commodity prices have been declining, due to a weaker-than-expected economic reopening in China and a contraction in German GDP. Energy prices continued to slide as WTI fell 11.3% in May and metals such as copper declined by 6%. As a result, the materials and energy sectors were among the worst performers.
In Canada, bank earnings releases were below consensus expectations, putting downward pressure on the financial sector. Consequently, financials, in tandem with energy and materials, pulled down the broader Canadian equity market. The S&P/TSX Composite Index declined 4.9% in May, with only the information technology sector delivering a positive return.
Economic releases, including inflation data in both Canada and the US showed strength, with inflation notably rising due to contributions from services and an unexpected increase in goods prices. This put upward pressure on interest rates. The Fed raised its target interest rate by 25 bps to over 5%, and is now in a range consistent with the Fed’s March projection of its terminal rate. Bond yields climbed across the yield curve, with two-year yields up 52 bps in Canada and 33 bps at the 10-year term. Credit performed well as demand rebounded, providing support for spreads. The FTSE Canada Universe Bond Index declined 1.69% in May.
Portfolio strategy
Key indicators of jobs and growth are broadly positive, although there is conflicting data across various economic indicators, including manufacturing surveys and leading indicators. During the late stages of business cycles, it is common to see volatile and contradictory data as different sectors experience the lagged impact of higher interest rates at different times. The full effects of the rate hikes over the past year have not been fully felt by the economy, and certain factors, such as extended amortizations for some variable-rate mortgages in Canada, are mitigating the direct impact of monetary tightening. Nonetheless, tighter lending standards by banks and central banks’ resolve to control inflation suggest that a recession is likely within the next year.
We maintain a cautious outlook for equity markets, anticipating declining profit margins, sticky wages but diminished pricing power, and further negative earnings revisions in the coming quarters. Thus, balanced portfolios remain underweight equities. Fundamental Canadian equity portfolios remain focused on stability and own companies with resilient earnings and dividend profiles. Fixed-income portfolios are underweight corporate and provincial bonds. While the equity market has demonstrated remarkable resilience to date, it is becoming increasingly evident that risks to equities persist beneath the surface. We are therefore taking a more cautious approach to portfolio positioning.
*Acronym for the current largest capitalization technology stocks (Apple, Facebook/Meta, Amazon, Alphabet/Google, Microsoft, Netflix, Nvidia, Tesla).