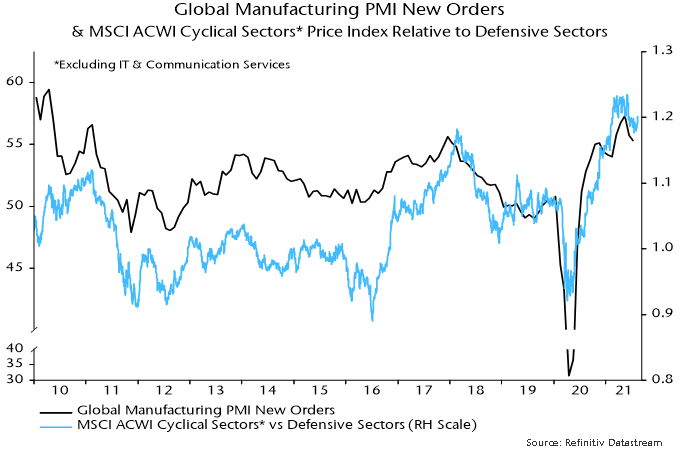
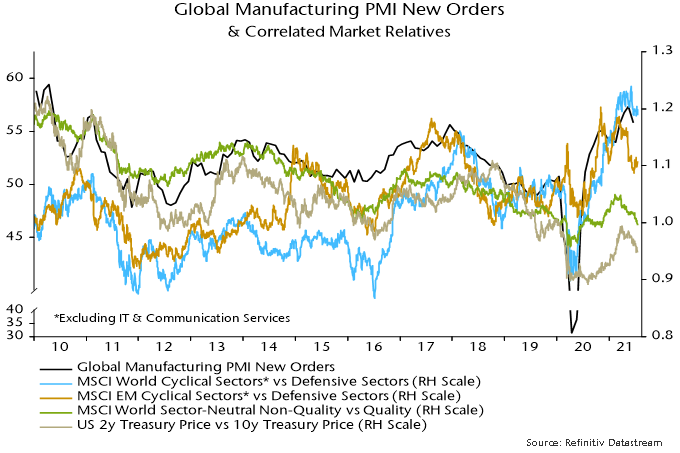
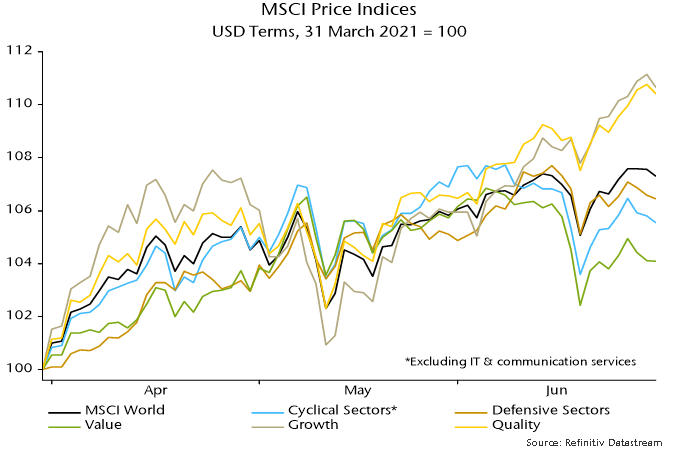
Investors appear to be in more optimistic mood about economic prospects, judging from recent relative strength of equities versus bonds and cyclical versus defensive sectors.
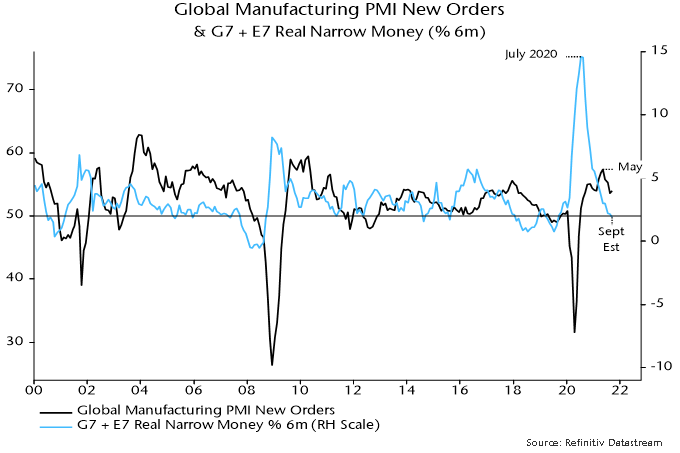
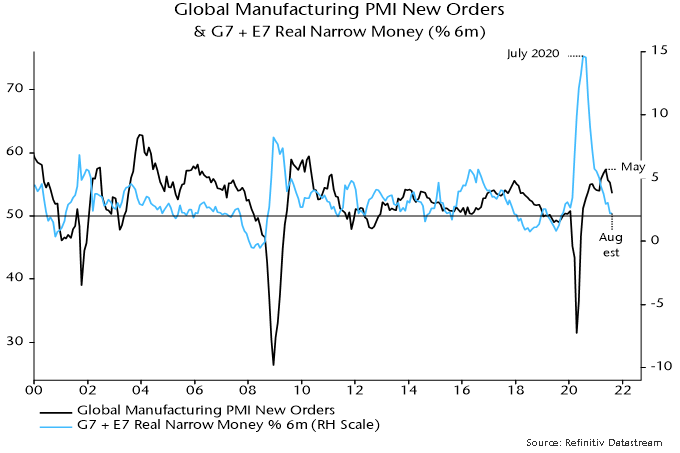
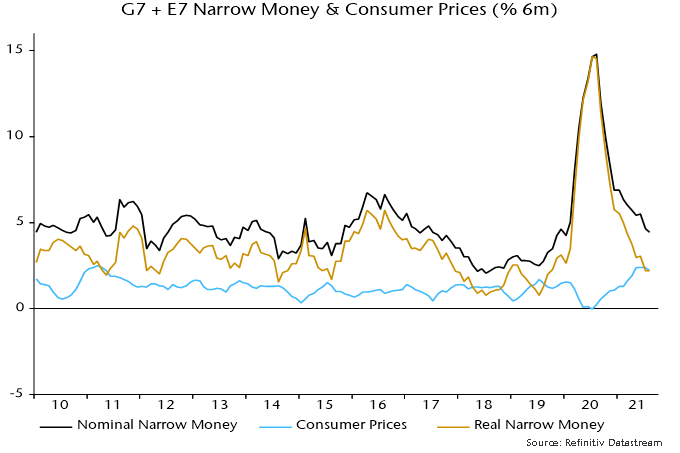
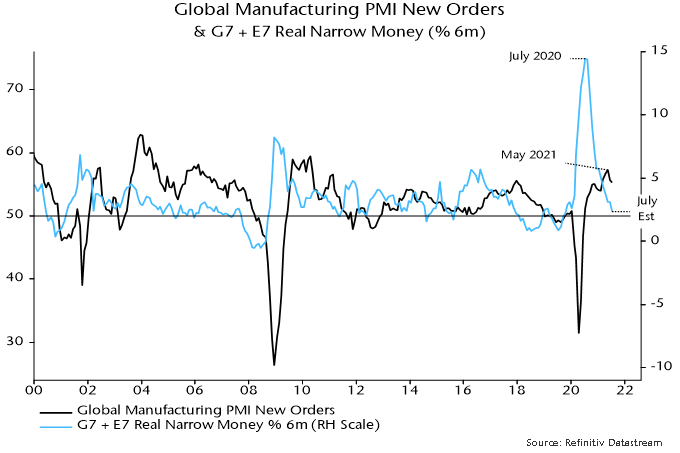
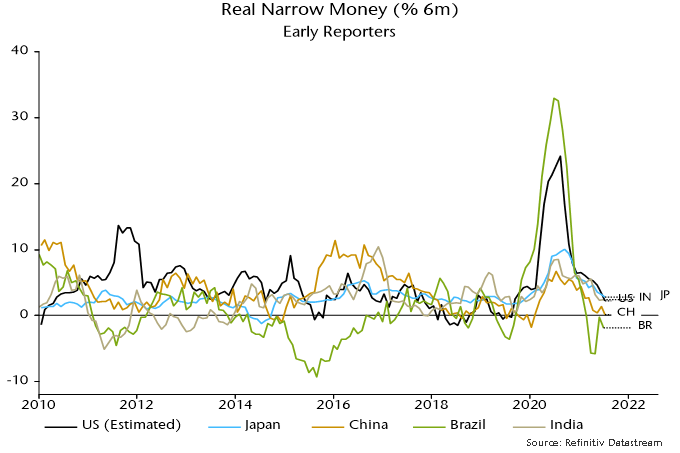
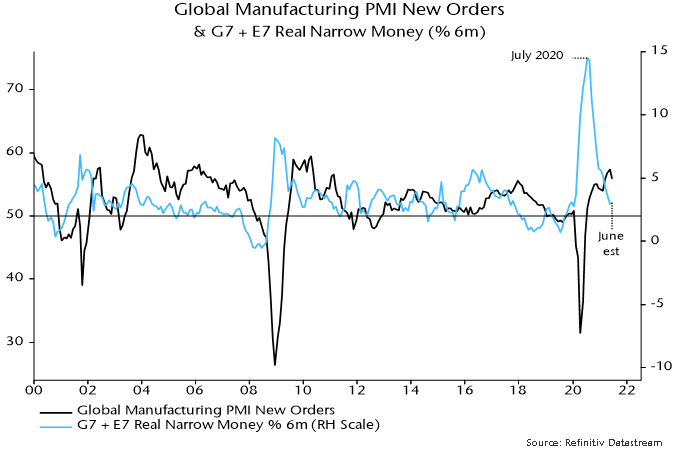
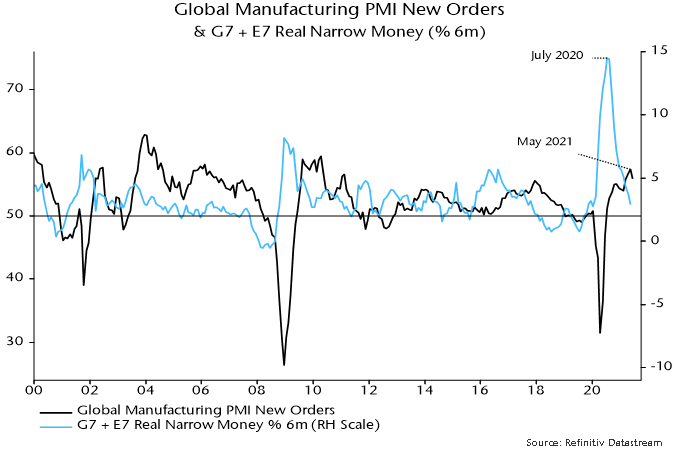
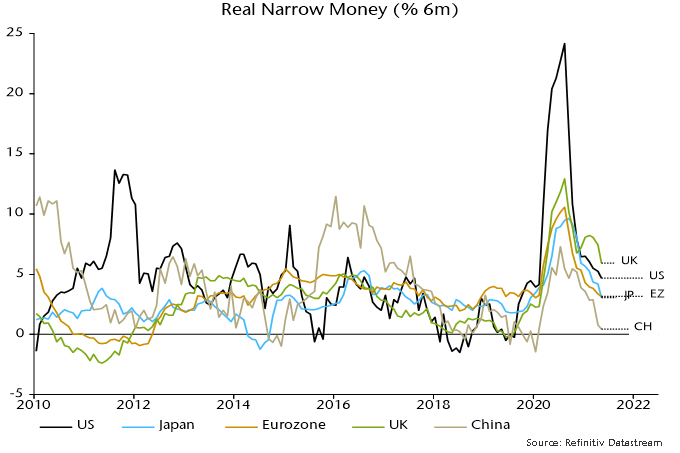
This revival of cyclical optimism is not supported by monetary trends. Global six-month real narrow money growth is estimated to have fallen slightly further in September, having reached a 22-month low in July and moved sideways in August – see chart 1. (The September estimate is based on monetary data covering 70% of the aggregate and near-complete inflation data.)
Chart 1
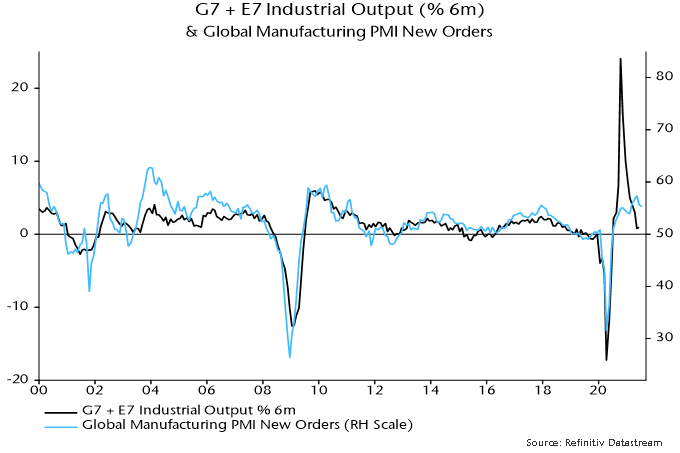
The fall in real money growth into July was the basis for a forecast here that global industrial demand momentum – proxied by the manufacturing PMI new orders index – would slow further into early 2022. The weak September reading, if confirmed, suggests that the slowdown will extend through end-Q1.
The rise in cyclical optimism is not attributable to policy news: the US spending bills remain stalled in Congress and more central banks are signalling hawkishly. PBoC officials last week played down the prospect of policy easing despite weak economic data.
The most likely explanation for the cyclical rally is growing evidence that supply chain blockages are easing. The global manufacturing PMI suppliers’ delivery times index bottomed in June / July, recovering marginally in August / September (lower readings = longer delivery times). October flash reports this week may show a further increase.
Industrial output momentum will rebound as sectors hobbled by supply constraints – autos in particular – normalise production. This pick-up, however, will be short-lived if demand growth continues to slow, as suggested by monetary trends.
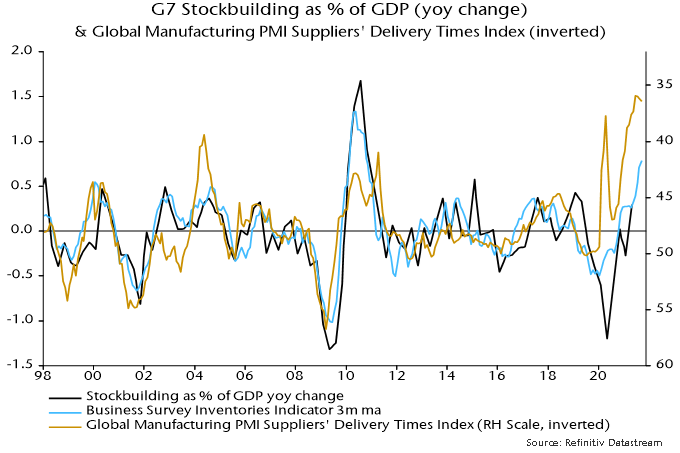
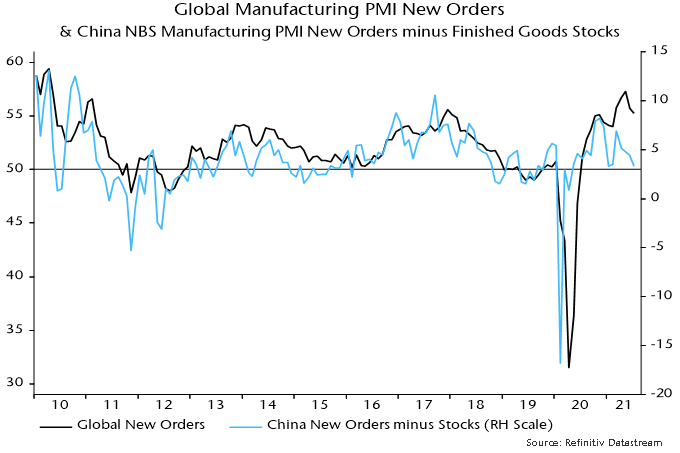
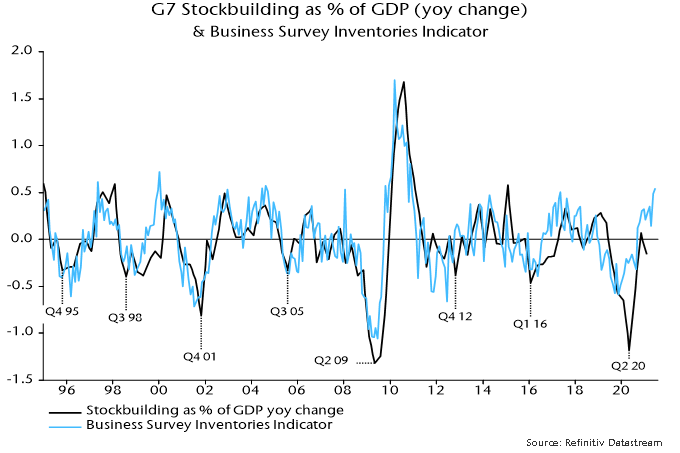
The easing of supply pressures, moreover, carries its own warning for demand prospects. The PMI delivery times index is inversely correlated with the rate of change of G7 stockbuilding – chart 2. Recent long delivery delays reflect not only pandemic-related disruption but also a scramble to boost inventories following intense destocking. The easing of blockages, therefore, is indirect evidence that the demand growth boost from the stockbuilding cycle is at or near a peak.
Chart 2
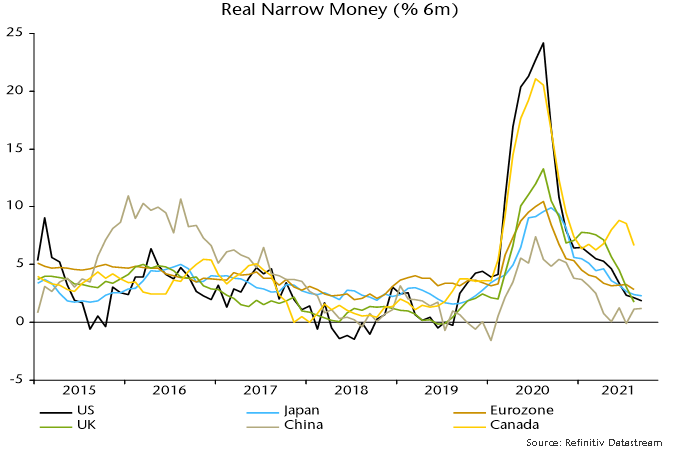
The global six-month real narrow money growth estimate for September incorporates further falls in the US / Japan and a stable Chinese reading – chart 3. The US / China gap – which surged last year, warning of divergent economic / equity market prospects – has almost closed. Eurozone and UK September monetary data will be released on 27 and 29 October respectively. Canadian numbers appear with a one-month lag: real money growth remained relatively strong in August (just released), suggesting that the Bank of Canada will be under pressure to hike rates soon.
Chart 3
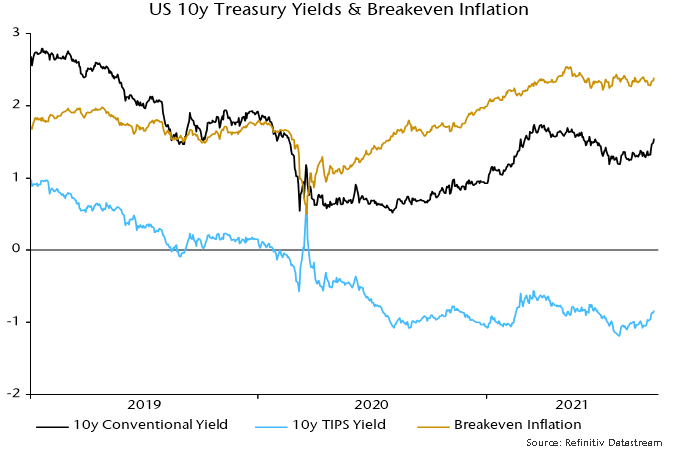
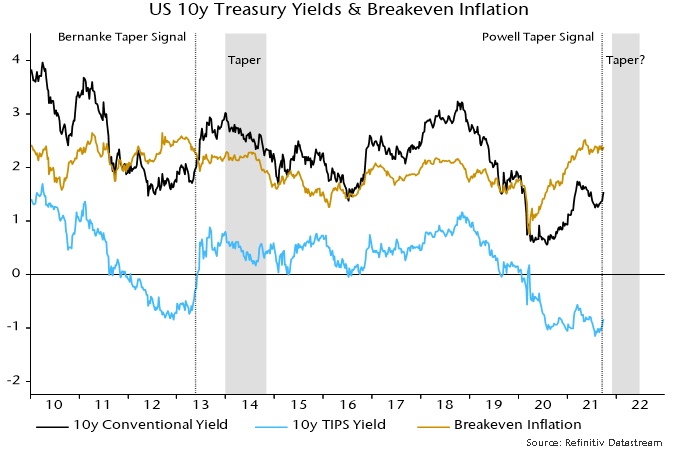
US Treasury yields have risen sharply since Fed Chair Powell’s signal last week of a likely tapering decision at the November or December FOMC meeting. The move higher mainly reflects an increase in real yields, with inflation break-evens range-bound – see chart 1.
Chart 1
The reaction recalls a surge in nominal and real yields when former Chair Bernanke signalled that the Fed was considering tapering in Congressional testimony on 21 May 2013. Inflation breakevens, which had been falling into the announcement, declined further before recovering – chart 2.
Chart 2
Bernanke’s signal was a catalyst for real yields – which had reached negative levels similar to recently – to return to positive territory. The yield surge triggered a short-lived “risk-off” move in markets, focused on emerging markets and credit (the “taper tantrum”).
The market response spooked the Fed, causing the taper decision to be delayed until December 2013. When tapering finally started in January 2014, nominal and real yields embarked on a sustained decline. Inflation breakevens moved sideways but also fell later in 2014.
Cyclical sectors of equity markets outperformed defensive sectors between Bernanke’s May announcement and the start of tapering in January.
The view here, though, is that investors should be cautious about drawing parallels between 2013-14 and now.
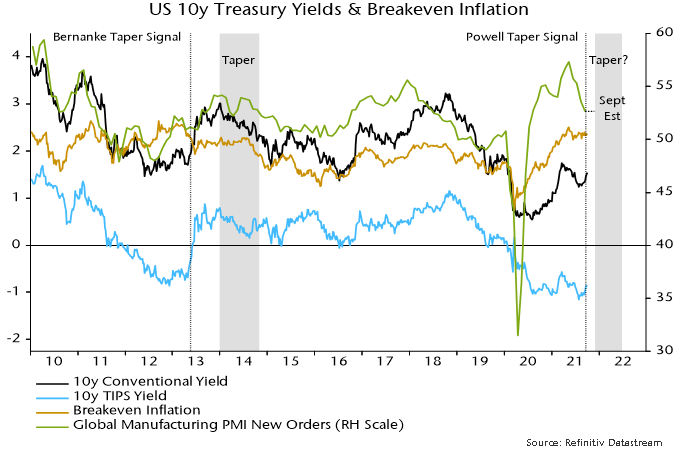
The economic backdrop is a key difference. The global manufacturing PMI new orders index was about to embark on a significant rise as Bernanke gave his taper signal in May 2013 – chart 3. So it is difficult to disentangle the taper effect on yields from the usual correlation with cyclical momentum.
Chart 3
Economic momentum is slowing currently, with money trends suggesting a further PMI decline into early 2022.
This suggests that 1) the yield increase won’t mirror 2013 because the taper announcement effect is offset by a weakening cyclical backdrop, and 2) any rise in real yields could be dangerous for cyclical assets because – in contrast to 2013 – a higher discount rate is unlikely to be balanced by positive economic / earnings news.
Partial data indicate that global six-month real narrow money growth was little changed in August, following July’s fall to a 22-month low. Allowing for the usual lead, the suggestion is that the global economy will continue to lose momentum into early 2022, with no reacceleration before late Q1 at the earliest.
Global PMI results for August were consistent with the slowdown forecast, with the manufacturing new orders index falling for a third month – see chart 1.
Chart 1
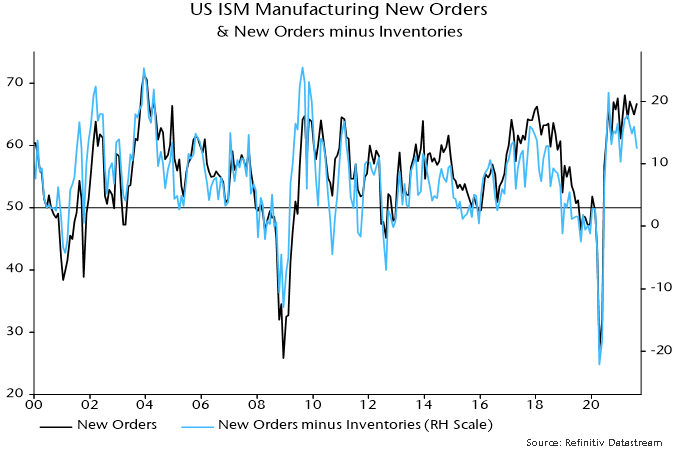
The US ISM manufacturing new orders index unexpectedly rose in August but this appears to have been driven by a rise in inventories: the new orders / inventories differential, which often leads, fell to its lowest since January – chart 2.
Chart 2
The US, China, Japan, Brazil and India have released monetary information for August, together accounting for 70% of the G7 plus E7 aggregate calculated here*. CPI data are available for all countries bar the UK and Canada.
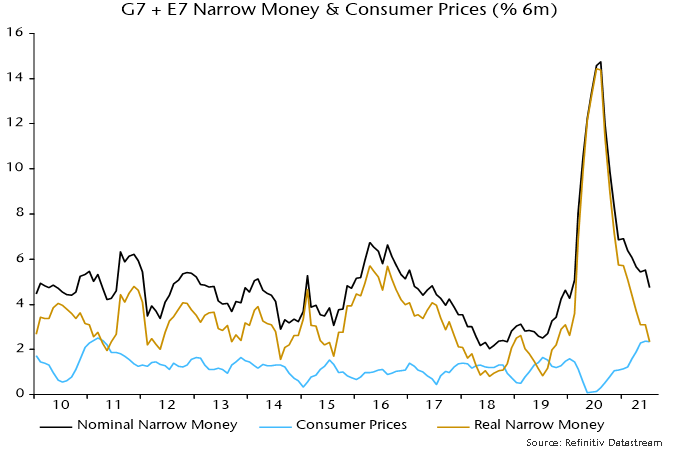
The stability of six-month real narrow money growth in August conceals a further slowdown in nominal money expansion offset by a small decline in CPI momentum – chart 3.
Chart 3
Previous posts discussed the possibility that real money growth would rebound during H2 2021, warranting optimism about economic prospects for 2022 and supporting another leg of the “reflation trade”. The monetary data have yet to validate this scenario.
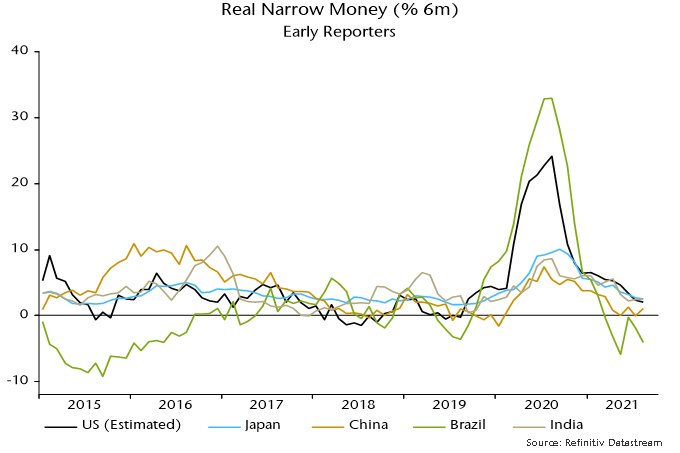
The real money growth rebound scenario depended importantly on a pick-up in China in response to recent and prospective policy easing. Chinese six-month real narrow money growth does appear to have risen slightly in August** but there were offsetting declines in the US, Japan and Brazil – chart 4.
Chart 4
*The US number is estimated from weekly data on currency in circulation and commercial bank deposits. **The household demand deposit component is estimated pending release of full data.
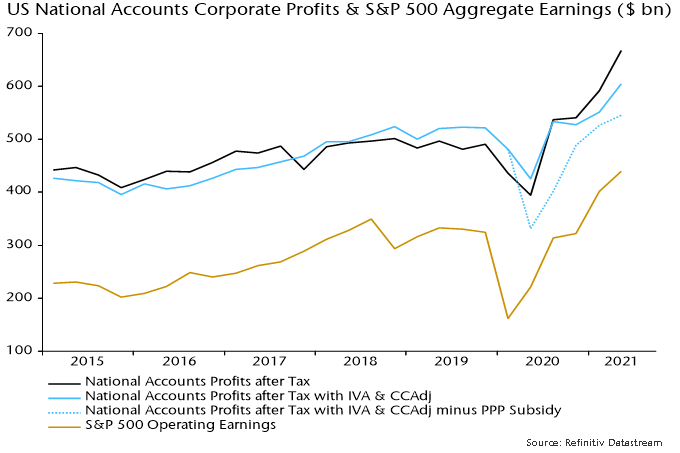
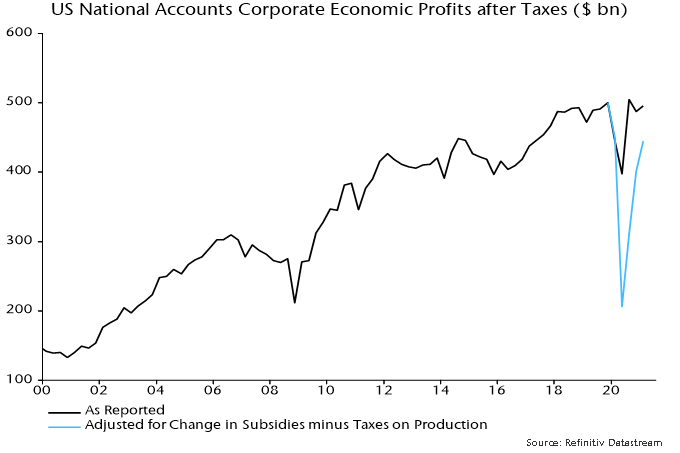
National accounts profits numbers for Q2 released last week mirror recent strength in company earnings reports. The concept closest to S&P 500 earnings – corporate profits after tax – rose by 13% in Q2 to stand 36% above its level in Q4 2019. The national accounts series covers all corporations but S&P 500 operating earnings also grew by 36% between Q4 2019 and Q2 this year – see chart.
The national accounts analysis additionally contains a measure of “economic profits”, i.e. excluding inventory gains and adjusted for the difference between reported and economic depreciation*. Reflecting commodity price strength, inventory profits have been significant in recent quarters, while overreporting of depreciation (to minimise tax bills) fell in 2020 and has remained at a lower level in H1 2021.
This economic profits measure, therefore, has performed less impressively than “headline” earnings, rising by 10% in Q2 to stand 16% above its Q4 2019 level.
This measure, however, still overstates underlying profits strength because it includes government subsidy payments to corporations under various pandemic response schemes, the most significant of which has been the now-closed Paycheck Protection Program. The subsidy payment to corporations under this scheme accounted for 10% of economic profits in Q2 but will fall to zero over coming quarters**.
Q2 profits were also supported by payments under the Employee Retention Tax Credit scheme and grants to air carriers, among other emergency measures.
Excluding only the PPP subsidy, growth of economic profits between Q4 2019 and Q2 this year falls to just 4%.
The level of headline national accounts profits was 22% higher than this adjusted economic profits measure in Q2. A reasonable base case assumption is that this overshoot will be eliminated by Q2 2022.
The consensus forecast is for S&P 500 operating earnings to rise by a modest-sounding 3% in the year to Q2 2022. For national accounts profits to grow at the same pace, underlying profits – i.e. excluding inventory gains, subsidies etc. – might have to increase by more than a quarter. Such strength is implausible, requiring the unlikely combination of rapid economic growth with no associated downward pressure on margins from a tightening labour market.
*Profits after tax with inventory valuation adjustment (IVA) and capital consumption adjustment (CCAdj). **The subsidy payment is recorded as occurring over the term of the loan, not when it is forgiven.
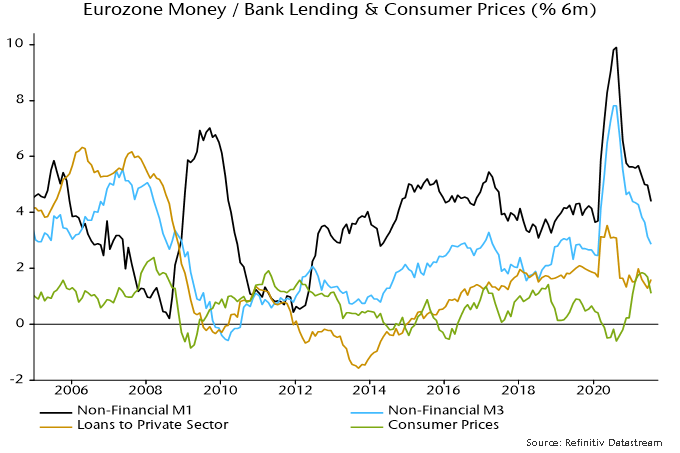
Eurozone monetary trends have been suggesting an economic slowdown through end-2021. A recent moderation of consumer price momentum, however, has stabilised six-month real narrow money growth, hinting at a bottoming out of business surveys and other coincident indicators in early 2022.
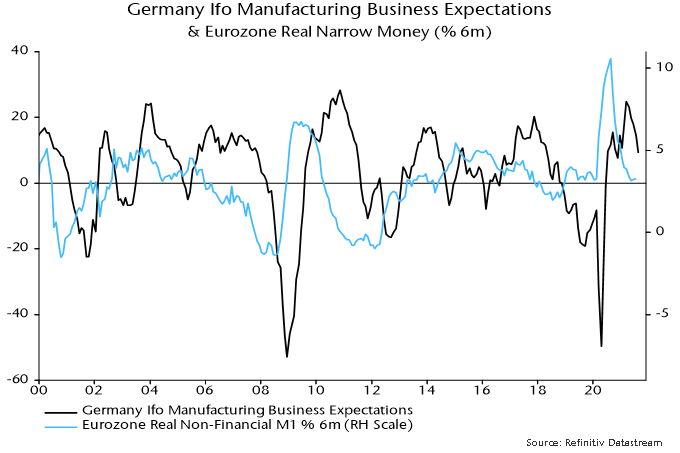
The Ifo manufacturing survey is a timely indicator of German / Eurozone industrial momentum, displaying a strong contemporaneous correlation with German / Eurozone manufacturing PMIs (but with a longer history). The business expectations component peaked in March, falling for a fifth month in August – see chart 1.
Chart 1
The March peak is consistent with an August 2020 peak in Eurozone six-month real narrow money growth. The implied seven-month lead is slightly shorter than the historical average – the correlation between Ifo business expectations and Eurozone real money growth is maximised by applying a nine month lag to the latter.
Real narrow money growth, however, has moved sideways since May (July money numbers were released yesterday). The suggestion is that the Ifo indicator – along with PMIs and other business surveys – will weaken further during H2 but bottom out in early 2022.
The recent stabilisation of real money growth is not entirely convincing: nominal money trends continued to weaken in June / July but this was offset by a slowdown in six-month consumer price momentum – chart 2.
Chart 2
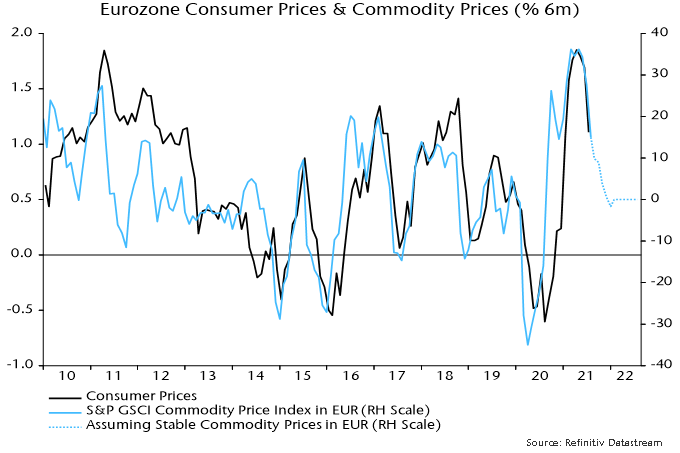
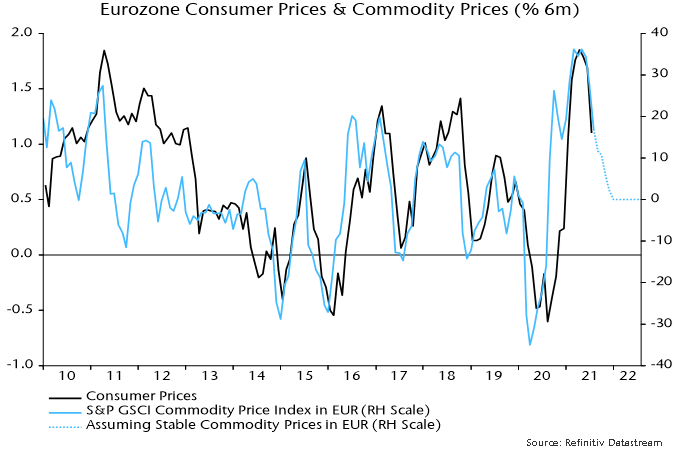
The inflation slowdown, however, could extend, assuming that commodity prices (in euro terms) stabilise at their current level – chart 3.
Chart 3
A recovery in nominal money growth is required to warrant shifting to a positive view of economic prospects. Such a signal would relate to H1 2022 – earlier real money weakness has “baked in” likely economic disappointment over the remainder of 2021.
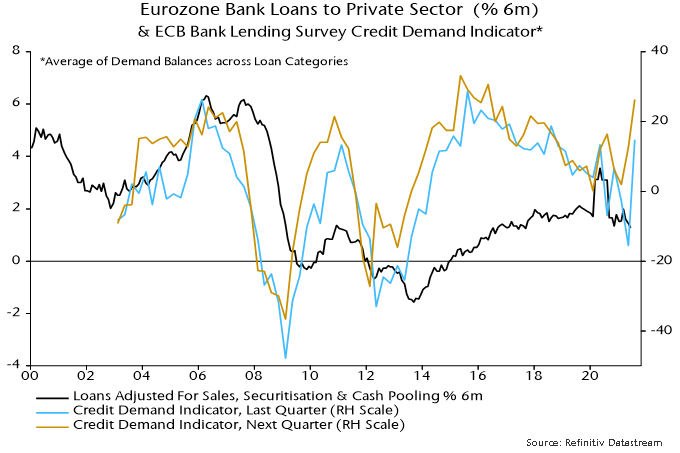
What could lift money growth? The most likely candidate is a pick-up in bank lending. Six-month growth of loans to the private sector recovered in July – chart 2 – while the most recent ECB bank lending survey reported the strongest expectations for credit demand since 2016.
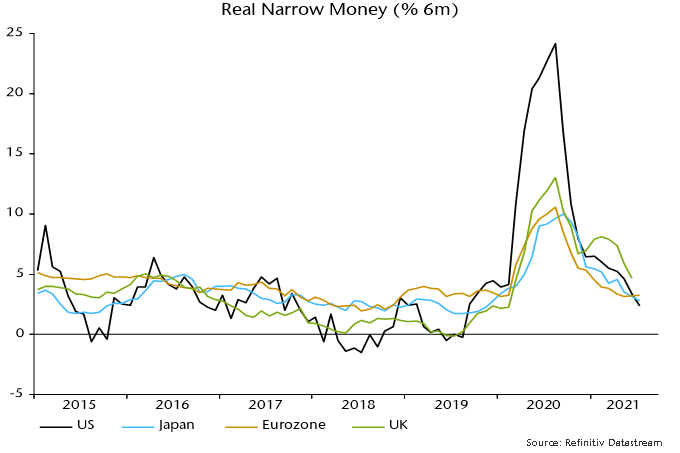
The recent stabilisation of Eurozone six-month real narrow money growth contrasts with a further slowdown in the US – chart 4. The divergence / cross-over suggests improving Eurozone relative economic and equity market prospects, although US real growth could benefit from a faster inflation slowdown over coming months.
Chart 4
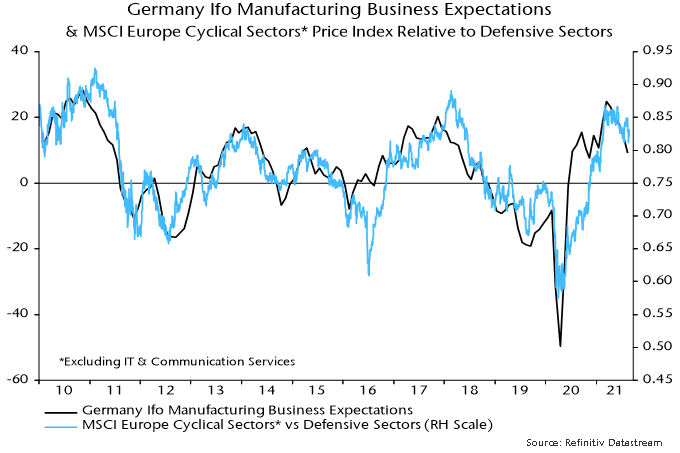
A further fall in Ifo manufacturing business expectations and other survey indicators during H2 would probably be associated with underperformance of European non-tech cyclical sectors relative to defensive sectors – chart 5.
Chart 5
Detailed monetary data for July released yesterday suggest that recent policy easing is beginning to support money growth, in turn hinting at a recovery in economic momentum from end-2021.
A sustained slowdown in six-month narrow money growth from July 2020 correctly signalled “surprise” Chinese economic weakness so far in 2021. The expectation here was that the PBoC would ease policy in Q2, supporting economic prospects for later in 2021. Adjustment was delayed but the reserve requirement ratio cut on 9 July appeared to mark a significant shift. The hope was that July monetary data would confirm a bottom in money growth.
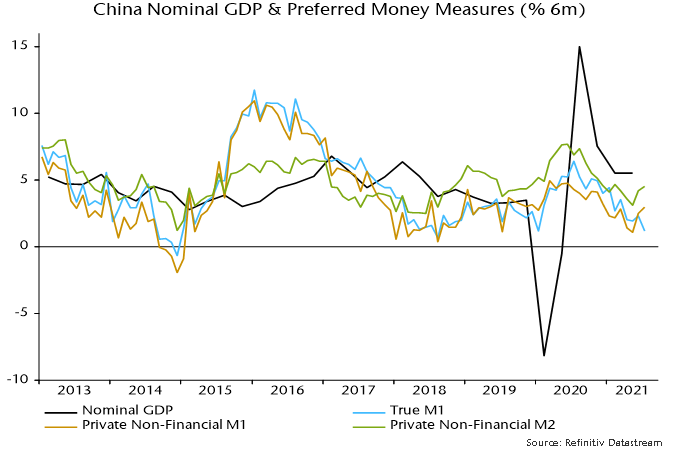
The headline July numbers released on 11 August seemed to dash this hope, with six-month of “true M1” falling to a new low – see chart 1*.
Chart 1
The additional data released yesterday allow a breakdown of the deposit component of this measure between households, non-financial enterprises and government departments / organisations. It turns out that the further fall in growth in July was due to the latter public sector element, which is volatile and arguably less important for assessing prospects for demand and output.
Six-month growth of “private non-financial M1”, i.e. currency in circulation plus demand deposits of households and non-financial enterprises, rose for a second month in July. So did the corresponding broader M2 measure – chart 1.
This improvement needs to be confirmed by a recovery in overall narrow money growth in August, ideally accompanied by a further increase in the private sector measure. One concern is that the rebound in the latter has so far been driven by the household component – enterprise money growth remains weak.
Increased bond issuance and fiscal easing could lift public sector money growth during H2.
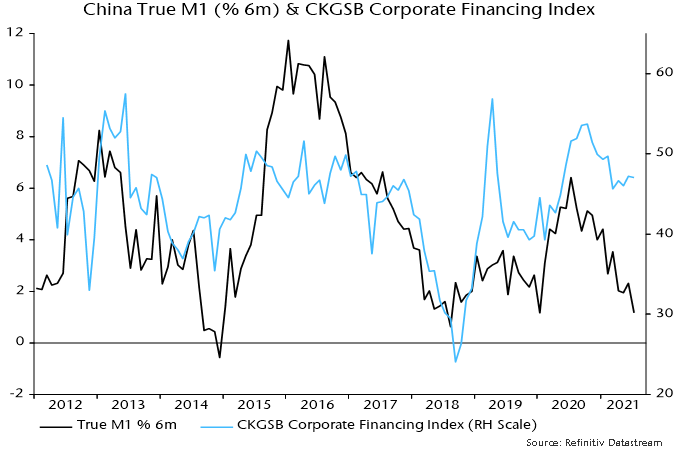
The corporate financing index in the Cheung Kong Graduate School of Business monthly survey is a useful corroborating indicator of money / credit trends – a rise signals easier conditions. The index bottomed in March but has yet to improve much – chart 2. August survey results will be released shortly.
Chart 2
*True M1 includes household demand deposits, which are omitted from the official M1 measure.
The assessment here remains that the global manufacturing PMI new orders index peaked in May and will fall through H2 2021, reflecting a decline in global six-month real narrow money growth from July 2020 through May. Real money growth, however, stabilised between May and June, raising the possibility that a turning point was at hand. A recovery in real money trends during Q3 would be a positive signal for economic prospects for H1 2022 and could support a second leg of the reflation trade.
Incoming monetary news for July is unfavourable for this scenario. Global six-month real narrow money growth is estimated to have fallen further last month to its lowest since October 2019, based on monetary data covering 70% of the G7 plus E7 aggregate monitored here – see chart 1.
Chart 1
A pick-up in six-month consumer price inflation contributed to the fall in real narrow money growth into May / June. Price momentum stabilised in July but there was a further decline in nominal money expansion – chart 2.
Chart 2
Six-month real narrow money growth is estimated to have fallen in the US, China, Japan and Brazil, with India stable – chart 3. (The US July money number is estimated from weekly data on currency in circulation and commercial bank deposits.)
Chart 3
A recovery in the global measure remains plausible in August / September. Recent commodity price stabilisation suggests a decline in six-month inflation, while Chinese money growth may pick up in lagged response to policy easing.
Global six-month real narrow money growth has led turning points in manufacturing PMI new orders by 6-7 months on average historically. The further fall in real money growth in July, therefore, suggests that PMI weakness will extend into early 2022.
The PMI new orders index is a good indicator of underlying industrial momentum but output was held back by supply issues during H1, disrupting the normal relationship – chart 4. Output momentum could rebound temporarily in Q3 as supply constraints ease even as the PMI moderates.
Chart 4
This possibility complicates market analysis. The performance of “traditional” cyclical equity market sectors (i.e. excluding IT and communication services) relative to defensive sectors has correlated better with PMI new orders than industrial output, suggesting that they will lag if the PMI slides – chart 5.
Chart 5
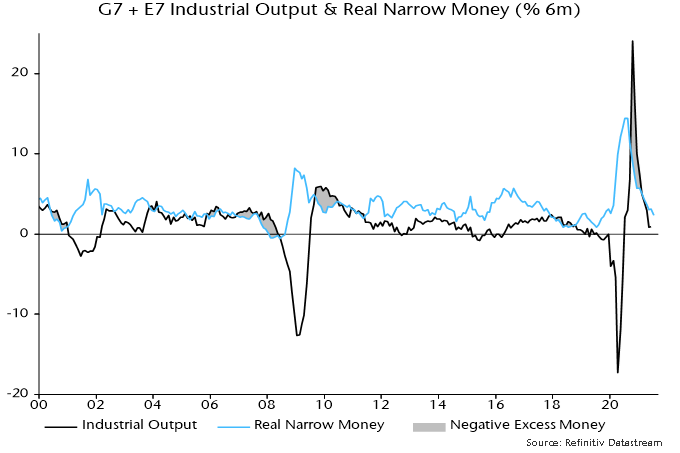
A near-term rebound in output momentum, however, could be relevant for assessing the monetary backdrop for markets. Global six-month industrial output growth fell back below real money growth in April – chart 6. The return to a positive real money / output growth gap may explain continued strength in equity market indices despite signs of economic cooling.
Chart 6
A negative cross-over, however, is possible if there is a large output catch-up effect and real money growth remains weak.
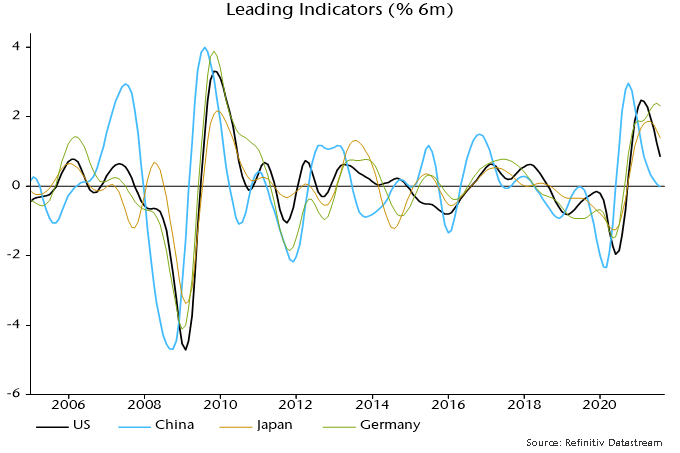
The monetary signal of an economic slowdown is starting to be confirmed by non-monetary leading indicators. Chart 7 shows six-month rates of change of composite indices based on the OECD’s methodology but calculated independently. The suggestion is that the loss of economic momentum now clearly visible in China will be mirrored in the US and the rest of the G7 in H2 2021.
Chart 7
The economic / market view here remains cautious based on 1) an expected slowdown in global industrial momentum through H2 (already apparent in Chinese data) and 2) recent less favourable “excess” money conditions.
Global six-month real narrow money growth, however, may have bottomed in May / June. A Q3 rebound would signal a stronger economy in H1 2022. An associated improvement in excess money could reenergise the reflation trade in late 2021.
The issue can be framed in cycle terms: does the recent top in the global manufacturing PMI new orders index mark the peak of the stockbuilding cycle (implying a shortened cycle) or will the peak be delayed until H1 2022?
Possible drivers of a real money growth rebound include Chinese policy easing, a slowdown in global consumer price momentum and a pick-up in US / Eurozone bank loan expansion.
The H2 industrial slowdown view remains on track. The global manufacturing PMI new orders index fell further in July, confirming May as a top. Chinese orders were notably weak and have led the global index since the GFC – see chart 1.
Chart 1
Global six-month real narrow money growth fell steadily between July 2020 and May but a stabilisation in June has been confirmed by additional monetary data released over the last week – chart 2.
Chart 2
Will PBoC policy easing drive a recovery in Chinese / global money growth? The hope here was that the 15 July cut in reserve requirements would be reflected in an early further fall in money market interest rates and easier credit conditions. Three-month SHIBOR, however, has moved sideways while corporate credit availability is little changed, judging from the July Cheung Kong Graduate School of Business survey – chart 3. July money data, therefore, could show limited improvement.
Chart 3
Global six-month real money growth should receive support from a slowdown in consumer price momentum as commodity price and bottleneck effects fade. Eurozone six-month CPI inflation eased on schedule in July, with further moderation suggested and the move lower likely to be mirrored in other countries (Tokyo July numbers also showed a slowdown) – chart 4.
Chart 4
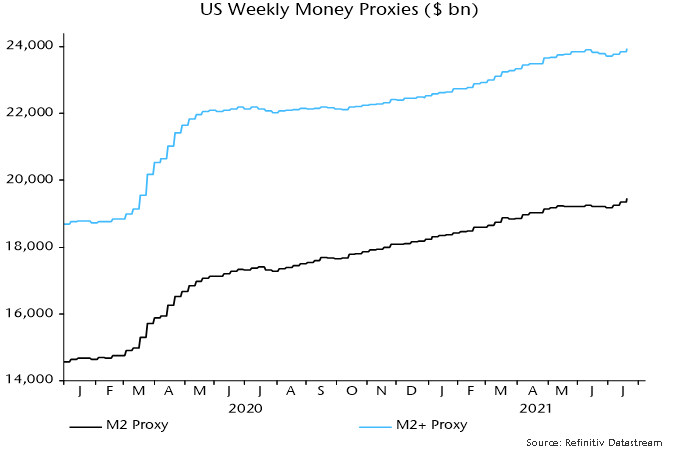
US monetary prospects are foggy. Disbursement of stimulus payments boosted nominal money growth over March-May but there was a sharp slowdown in June. Weekly data indicate a reacceleration in July as the Treasury ran down its cash balance at the Fed to comply with debt ceiling legislation – chart 5. This effect, however, will be temporary and an improving fiscal position suggests a reduced contribution from monetary financing during H2 and into 2022.
Chart 5
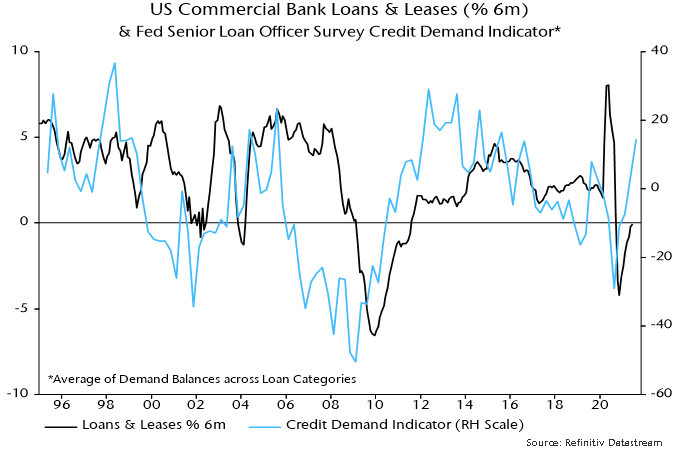
Stable or higher US money growth, therefore, may require a pick-up in bank loan expansion. The Fed’s July senior loan officer survey, released yesterday, is hopeful, showing a further improvement in demand balances across most loan categories (not residential mortgages) – chart 6. The ECB’s July lending survey gave a similar message – chart 7. The survey indicators, however, are directional and the magnitude of a likely loan growth pick-up is uncertain. Actual lending data remained soft through June.
Chart 6
Chart 7
Failure of global real money growth to recover in Q3 – and especially a further slowdown – would suggest that the stockbuilding cycle is already at or close to a peak. The cycle bottomed in Q2 2020 and – based on its average historical length of 3.33 years – might be expected to reach another low in H2 2023, in turn implying a peak no earlier than H1 2022. As previously discussed, however, the current upswing could be short to compensate for a long (4.25 years) prior cycle.
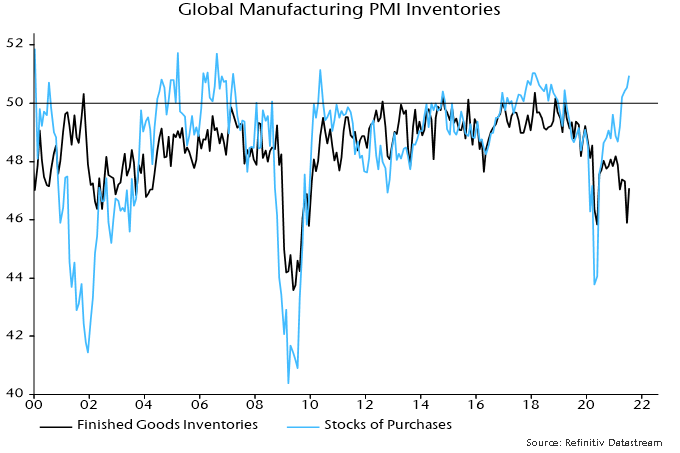
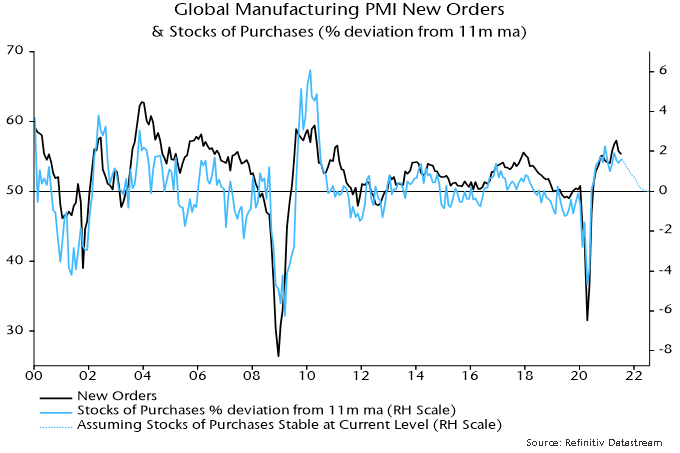
Proponents of the consensus view that replenishment of stocks will underpin solid industrial growth in H2 cite the still-low level of the global manufacturing PMI finished goods inventories index – chart 8. Research conducted here, however, indicates that the stocks of purchases index (i.e. raw materials / intermediate goods) is a better gauge of the stockbuilding cycle and tends to lead the finished goods index. The former index is already at a level consistent with a cycle top and the rate of change relationship with the new orders index is another reason for expecting orders to weaken significantly during H2 – chart 9.
Chart 8
Chart 9
Global six-month real narrow money growth appears to have moved sideways in June and could be bottoming after a 10-month slide. If confirmed, and allowing for the usual lead time, this would suggest a stabilisation of industrial momentum in early 2022 following a H2 2021 slowdown.
The June real narrow money growth estimate is based on monetary data covering 70% of the G7 plus E7 aggregate tracked here and near-complete inflation numbers. The prior fall in real money growth is expected to be reflected in “surprising” weakness in global PMI manufacturing new orders and other coincident indicators of industrial momentum during H2 2021 – see chart 1.
Chart 1
Global stabilisation conceals a June recovery in Chinese six-month real narrow money growth offset by further slowdowns in the US and Japan, with European data yet to be released – chart 2.
Chart 2
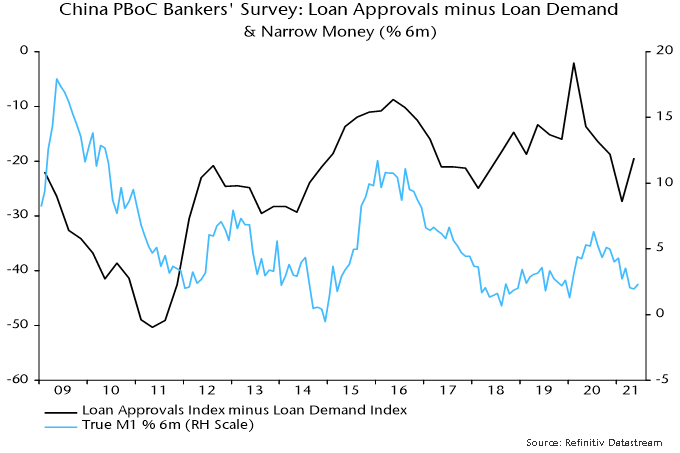
The recent cut in reserve requirements is judged here to confirm a trend shift in Chinese monetary policy, probably heralding a sustained rebound in money growth. Another indication of a policy turn is a rise in the differential between the loan approvals and loan demand indices in the PBoC Q2 bankers’ survey, suggesting that banks have been instructed to loosen credit – chart 3.
Chart 3
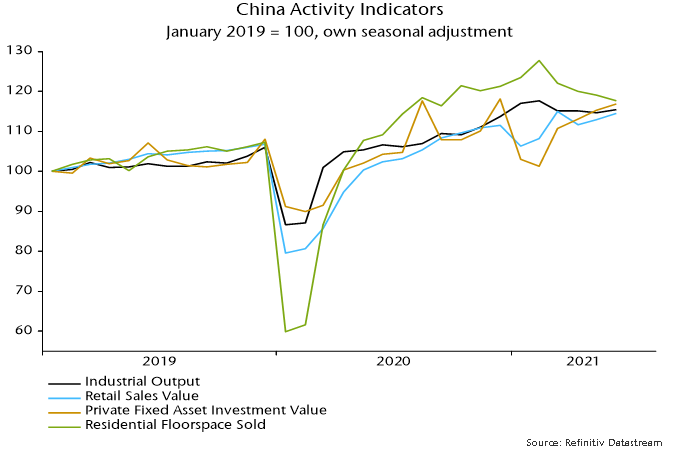
Street claims that last week’s Chinese activity data were solid, implying no need to adjust policy settings, are puzzling. GDP grew by only 3.4% annualised between Q4 and Q2. Monthly indicators are stagnant in real seasonally adjusted level terms – chart 4.
Chart 4
The view here is that the economy faced a “hard landing” without a policy change but the authorities have recognised the risk and will act to avert it.
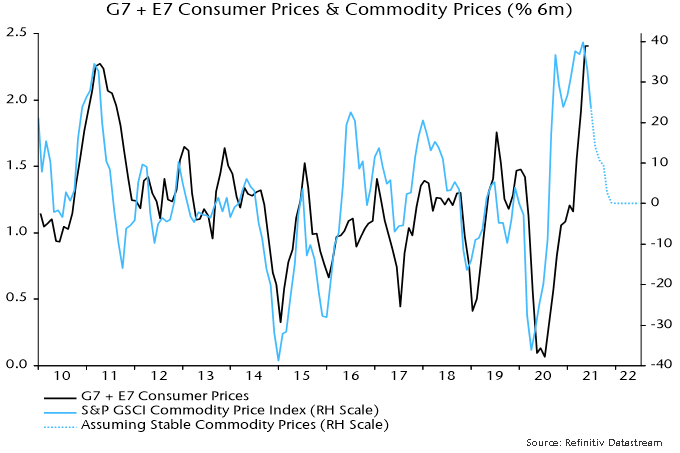
Support to global real money growth from Chinese easing should be supplemented by a slowdown in global six-month CPI inflation in H2, assuming stable commodity prices – chart 5. Commodity prices could weaken as industrial activity decelerates.
Chart 5
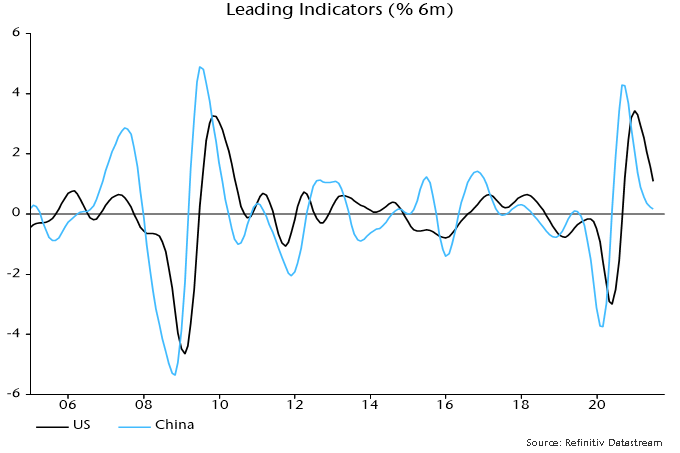
China continues to lead US / global economic momentum. The six-month rate of change of the OECD’s US leading indicator peaked four months after that of a Chinese indicator – chart 6*. This fits with a four-month interval between peaks in 10-year government bond yields – November in China, March in the US.
Chart 6
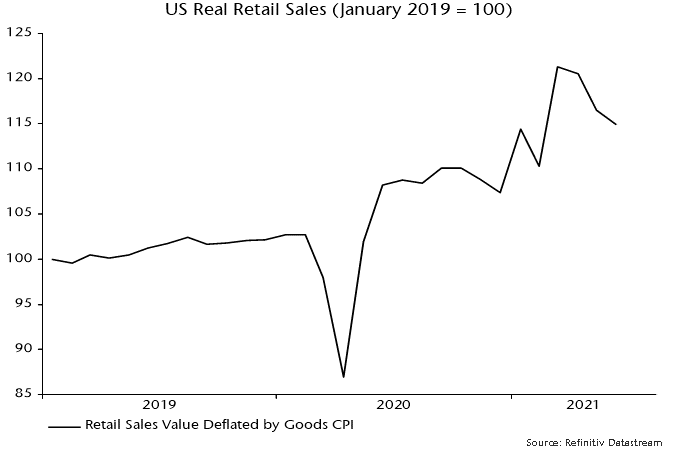
Street descriptions of US June retail sales as “robust” are also questionable. With prices surging, sales fell for a third month in real terms, consisent with a fading boost from March / April stimulus payments – chart 7.
Chart 7
Markets have already partially discounted a H2 economic slowdown, with quality stocks outperforming and bullish flattening of yield curves. Non-tech cyclical sectors of developed equity markets have so far held up against defensive sectors and could be the next shoe to drop – chart 8.
Chart 8
*The indicators shown use the OECD’s methodology but are calculated independently.
Monetary trends continue to suggest a slowdown in global industrial momentum in H2 2021, with a rising probability that weakness will be sustained into H1 2022 – contrary to the prior central view here that near-term cooling would represent a pause in a medium-term economic upswing. Pro-cyclical trends in markets have corrected modestly but reflationary optimism remains elevated, indicating potential for a more significant setback if economic data disappoint. Chinese monetary policy easing is judged key to stabilising global prospects and reenergising the cyclical trade.
Global six-month real narrow money growth – the “best” monetary leading indicator of the economy – peaked in July 2020 and extended its fall in May, dashing a previous hope here of a Q2 stabilisation / recovery. This measure typically leads turning points in the global manufacturing PMI new orders index by 6-7 months but a PMI peak was delayed on this occasion by a combination of US fiscal stimulus and economic reopening. A June fall in new orders, however, is expected to mark the start of a sustained decline, confirming May as a significant top – see chart 1.
Chart 1
The magnitude of the fall in global real narrow money growth and its current level suggest a move in the manufacturing new orders index at least back to its long-run average of 52.5 during H2 (May peak = 57.3, June = 55.8).
China continues to lead global monetary / economic trends, as it has since the GFC. A strong recovery in activity through 2020 prompted the PBoC to withdraw stimulus in H2, resulting in a money / credit slowdown that has fed through to weaker H1 2021 economic data. The central bank, however, has been reluctant to change course, partly to avoid fuelling house and commodity price speculation, and six-month real narrow money growth has now fallen to a worryingly low level, suggesting rising risk of a “hard landing” in H1 2022 – chart 2.
Chart 2
Real narrow money growth remains above post-GFC averages in other major economies but has also fallen significantly, reflecting both slower nominal expansion and a sharp rise in consumer price inflation. Six-month inflation is likely to fall back during H2 but nominal trends could weaken further in response to higher long-term rates and as money-financed fiscal stimulus moderates.
The suggestion from monetary trends of a deeper and more sustained economic slowdown could be argued to be inconsistent with cycle analysis. In particular, the global stockbuilding or inventory cycle bottomed in Q2 2020 (April) and, based on its 40-month average length, might be expected to remain in an upswing through early 2022, at least. This understanding informed the previous view here that a cooling of industrial momentum in mid-2020 would prove temporary.
A reassessment, however, may be warranted to take account of the distorting impact of the covid shock, which stretched the previous cycle to 50 months. A compensating shortening of the current cycle to 30 months would imply a cycle mid-point – and possible peak – in July 2021.
This alternative assessment is supported by a rise in the business survey inventories indicator monitored here to a level consistent with prior cycle peaks – chart 3.
Chart 3
The previous quarterly commentary suggested that cyclical equity market sectors and value were less attractive in the context of an approaching PMI peak, while quality stocks had potential to rally. MSCI World non-tech cyclical sectors lagged defensive sectors during Q2, with quality and growth outperforming value – chart 4. These trends could extend if the slowdown scenario described above plays out. Chinese policy easing would support the cyclical / value trade but the impact could prove temporary unless the Chinese shift resulted in an early rebound in global real narrow money growth.
Chart 4
Counter-arguments to the relatively pessimistic economic view outlined above include the following:
1. Fiscal policy remains highly expansionary and will offset monetary weakness.
Response: Economic growth is related to the change in the fiscal position and deficits, while large, are falling in most countries. Even in the US, President Biden’s stimulus package served mainly to neutralise a potential drag as earlier measures expired. The US fiscal boost peaked with the disbursement of stimulus cheques in March / April.
2. Household saving rates and money balances are high, implying pent-up consumer demand.
Response: Savings rates have been temporarily inflated by government transfers and will normalise as these fall back and consumption recovers to its pre-covid level. High money balances probably reflect “permanent” savings. US households planned to spend only 25% of the most recent round of stimulus checks, according to the New York Fed, using the rest to increase savings and reduce debt. The implied spending boost has already been reflected in retail sales, which may fall back in Q3.
3. Services strength as economies reopen will offset any industrial slowdown.
Response: The services catch-up effect is temporary and momentum is likely to reconnect with manufacturing in H2. Industrial trends dominate economic fluctuations and equity market earnings.
4. Profits are rising strongly, with positive implications for business investment and hiring.
Response: Profits are still receiving substantial support from government subsidies, withdrawal of which will offset much of the additional boost from economic normalisation. An increase in net subsidies relative to their Q4 2019 level accounted for 10% of US post-tax corporate economic profits in Q1, according to national accounts data – see chart 4.
Chart 5
5. Inventories to shipments ratios remain low, implying that the stockbuilding cycle is far from peaking.
Response: Economic growth is related to the change in stockbuilding, not its level. Stockbuilding is highest when inventories are low – the subsequent fall is a drag on growth even though stockbuilding usually remains high until inventories normalise. Low inventories to shipments ratios, therefore, are consistent with a cycle peak.
6. Industry has been held back by supply constraints – output and new orders will surge as these ease.
Response: Supply difficulties have probably resulted in firms placing multiple orders for inputs, inflating PMI readings – this effect will unwind as bottlenecks ease. Historically, manufacturing PMI new orders have fallen, not risen, following a peak in supply constraints.
7. Rising inflation will boost bond yields, supporting cyclical / value outperformance.
Response: Last year’s global money surge was expected here to be reflected in high inflation in 2021-22 but six-month broad money growth has moved back towards its pre-covid average, suggesting that medium-term inflation risks are receding. Bond yields usually track industrial momentum more closely than inflation data so would probably remain capped in a slowdown scenario even if inflation news continues to surprise negatively.