A post in August 2020 suggested that industrial commodity prices were about to surge. The stockbuilding (inventory) cycle appeared to be turning up from a Q2 2020 low, implying rising demand for raw materials, while strong global monetary growth was judged likely to amplify a price increase.
Monetary trends and cycle considerations are much less favourable now.
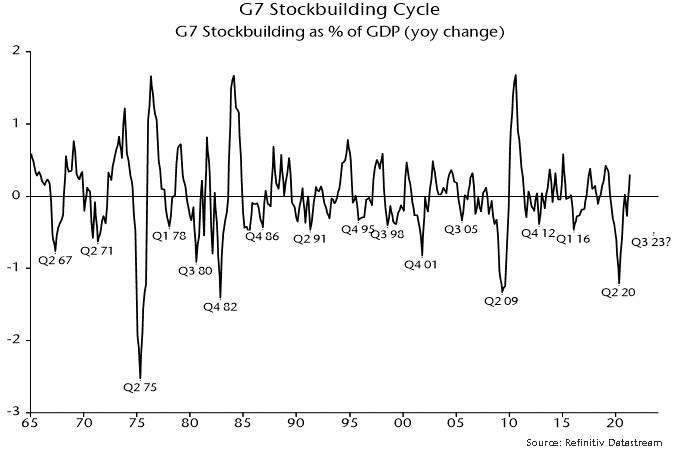
The preferred indicator here for tracking the cycle is the annual change in G7 stockbuilding expressed as a percentage of GDP (which approximates to the contribution of stockbuilding to annual GDP growth) – see chart 1. The cycle low in Q2 2020 suggested in the earlier post has been confirmed. If the current cycle were to conform to the average historical length of 3 1/3 years, the next low would occur in H2 2023.
Chart 1
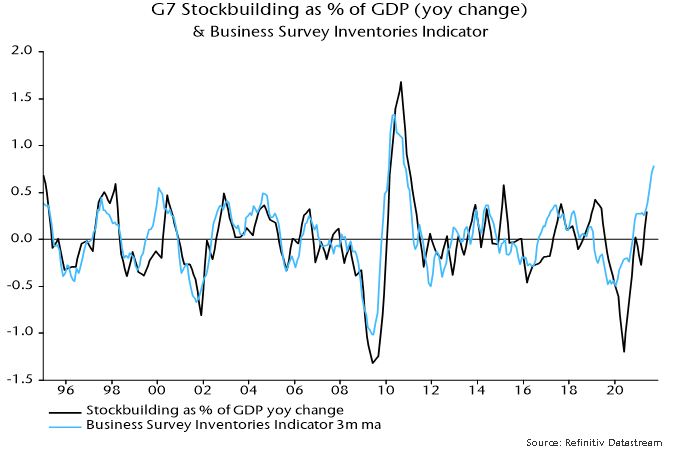
The most recent data point in the chart is for Q2 2021. Chart 2 shows a more timely business survey indicator, which has reached a level consistent with some previous cycle peaks. Any further boost to GDP growth from the cycle is likely to be limited and short-lived.
Chart 2
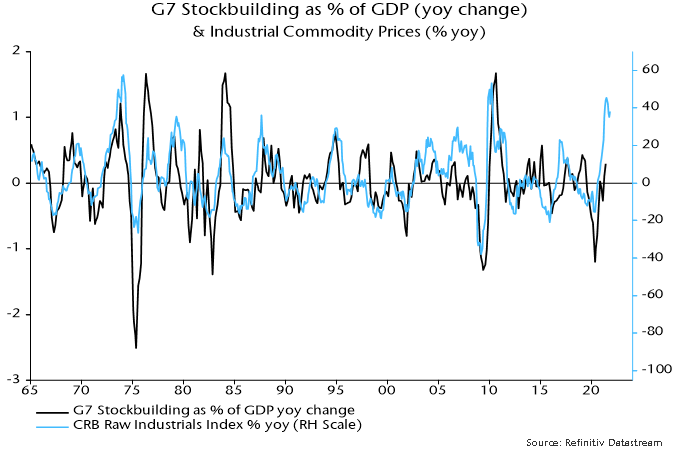
Industrial commodity prices are correlated with the stockbuilding cycle – Chart 3. In the 15 cycles since the mid-1960s (i.e. encompassing the lows from 1967 to 2016), the CRB raw industrials index* fell by an average 7% in the 18 months leading up to a cycle trough but rose by an average 14% in the subsequent 18 months.
Chart 3
The increase since the Q2 2020 cycle low (i.e. almost 18 months) has been exceptional, at 55%. The bull market has been supercharged by “excess” money – created by monetary financing of fiscal deficits – chasing any assets displaying an outperforming trend. In addition, supply chain disruption has probably led to precautionary overordering of inputs.
A next cycle low in H2 2023 would suggest a decline in commodity prices starting in H1 2022. The fall during the downswing could be larger than average to compensate for an overshoot during the upswing.
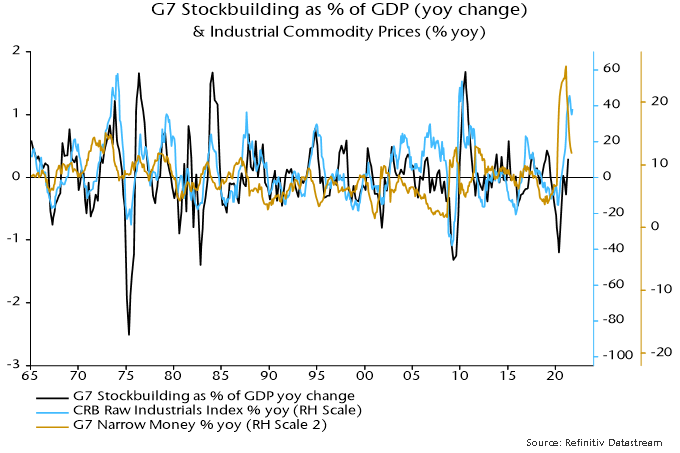
G7 narrow money leads both the stockbuilding cycle and commodity prices by about a year – chart 4. Annual money growth peaked in February 2021, suggesting a peak in annual commodity price inflation in early 2022.
Chart 4
What could delay a peak? The best hope is an early easing of Chinese monetary policy leading to a significant rebound in money growth that offsets slowdowns elsewhere. Recent comments from PBoC officials, however, showed no signs of urgency. Chinese stimulus may arrive too late to offset a drag on commodity prices as the G7 stockbuilding cycle rolls over.
*Includes burlap, copper scrap, cotton, hides, lead scrap, print cloth, rosin, rubber, steel scrap, tallow, tin, wool tops and zinc.
In last week’s commentary we discussed how green hydrogen can help reach net-zero carbon by 2050. This week, we focus on decarbonization within the aviation sector and how technological evolutions will help reduce carbon emissions.
While other sectors decarbonize quicker, the commercial aviation sector is under pressure to show greater transparency and start establishing greater initiatives in order to cut down its carbon emissions. Two weeks ago, the International Air Transport Association announced that its member airlines, which represent 82% of the world’s airlines, agreed to achieve net-zero carbon emissions by 2050.
Technology, which will continue to evolve, will also help reduce the sector’s carbon emissions. Pratt & Whitney designed GFT engines, which is one of the most sustainable engines in service for single-aisle planes. The GFT engine family, as an example, allows the reduction of up to 20% fuel burn and carbon emissions, while reducing the noise footprint by 75%. Today, more than 1,000 airplanes are equipped with that engine. When considering there are approximately 26,000 airplanes in service globally, the carbon footprint of this sector would be improved as older airplanes get replaced with newer and more efficient aircraft programs.
Another means of transportation for regional and urban travel could emerge in the coming years. Electrical Vertical Take-off and Landing (eVTOL) is a new type of light commercial aircraft currently under flight testing or prototyping. This new transport mode is potentially disruptive to other modes of transportation but should not be a threat to commercial airlines or the automotive sector. Conversely, it represent a sustainable alternative for inner city, short regional travels, air ambulance, and cargo transport.
The eVTOL market opportunity could be massive but at this time, it is hard to assess what could be an accurate figure. Lilium, one of the leading original equipment manufacturers (OEM) in that space, estimates that eVTOL could be worth $500 billion by 2040. When taking the cargo market under consideration, this market size expectation could reach $1 trillion. Other experts believe this sector could become an even bigger addressable market. It is no surprise that established aircraft manufacturers announced their own eVTOL programs, or co-investments. Last month, Airbus launched its new CityAirbus Next Gen program to address the urban air mobility market.
Joby Aviation and Volocopter are amongst the leading OEMs that could be the first to obtain their type certification between 2022 and 2024. Other interesting emerging eVTOL developers include Archer Aviation, Lilium, Vertical Aerospace, and Kitty Hawk. Note, the aforementioned companies are not part of Global Alpha’s holdings. Every manufacturer has its own design, propulsion technology, and characteristics, but all of them want to address the future of urban air mobility, focusing on a transportation range of 0-300 miles.
There are several positive advantages to support the eVOTL development over traditional transportation modes:
Reduced travel time and the cost of congestion:Lilium anticipates a short distance trip, like JFK airport to New York City could take approximately five minutes, while a longer regional trip between NYC and Boston could take approximately 1hour and 15 minutes. Joby Aviation estimates that there are 4.6 billion hours wasted in traffic in the top 15 U.S. cities every year.
Sustainable transportation mode: Lilium estimates that its eVTOL emission footprint would represent 18g CO2 per passenger kilometers. That compares with 189g for commercial aircraft, 142g for gasoline cars, and 31g for electric cars. This is assuming the batteries are produced with renewable energy.
Noise reduction: Some models of eVTOLs are expected to generate less than 70 decibels, which is comparable to the noise level of a dishwasher.
Lower cost of operation: McKinsey estimates that the cost of operating eVTOL could drop rapidly to $2.5 per seat mile. In comparison, the cost of operating a helicopter today is around $6-$8 per seat mile.
Simpler infrastructure needs: The urban air mobility network would require an infrastructure that would likely be much less costly than traditional transportation infrastructure, such as airports. Many of the existing infrastructure could be converted into landing/take-off pads (rooftop buildings, gas stations, parking areas). McKinsey estimates that the cost for 10 landing/take-off pads could reach up to $24 million, which includes the cost of operations.
We understand that a new ecosystem needs to be created, and with that, comes many challenges. The success of the eVTOLs will depend on several factors, such as technical challenges, regulatory approval, the pace of adoption from clients and passengers, and the infrastructure required to accommodate this new transportation mode.
Investors appear to be in more optimistic mood about economic prospects, judging from recent relative strength of equities versus bonds and cyclical versus defensive sectors.
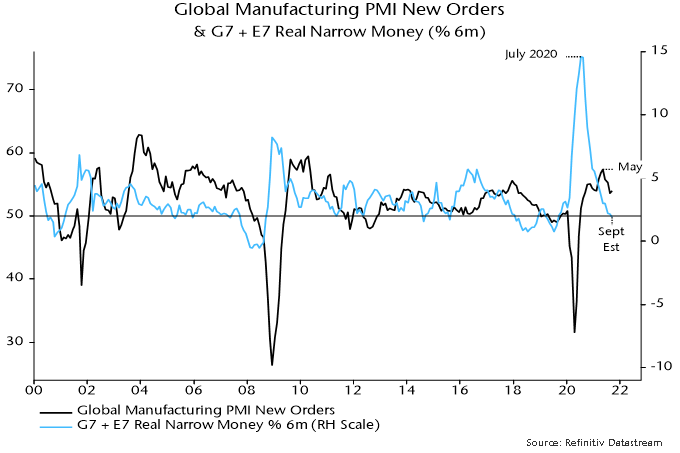
This revival of cyclical optimism is not supported by monetary trends. Global six-month real narrow money growth is estimated to have fallen slightly further in September, having reached a 22-month low in July and moved sideways in August – see chart 1. (The September estimate is based on monetary data covering 70% of the aggregate and near-complete inflation data.)
Chart 1
The fall in real money growth into July was the basis for a forecast here that global industrial demand momentum – proxied by the manufacturing PMI new orders index – would slow further into early 2022. The weak September reading, if confirmed, suggests that the slowdown will extend through end-Q1.
The rise in cyclical optimism is not attributable to policy news: the US spending bills remain stalled in Congress and more central banks are signalling hawkishly. PBoC officials last week played down the prospect of policy easing despite weak economic data.
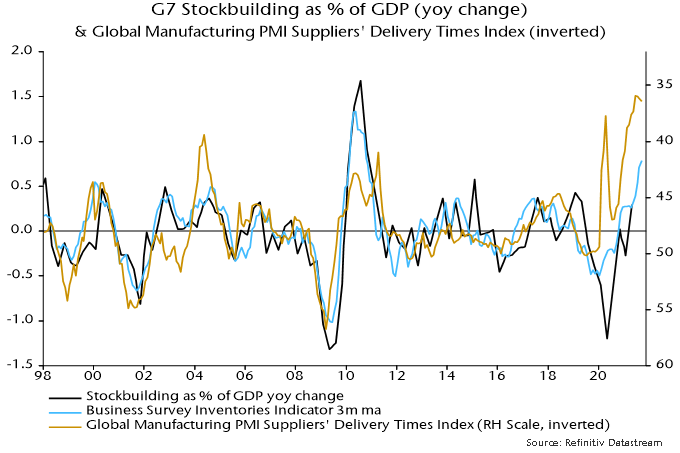
The most likely explanation for the cyclical rally is growing evidence that supply chain blockages are easing. The global manufacturing PMI suppliers’ delivery times index bottomed in June / July, recovering marginally in August / September (lower readings = longer delivery times). October flash reports this week may show a further increase.
Industrial output momentum will rebound as sectors hobbled by supply constraints – autos in particular – normalise production. This pick-up, however, will be short-lived if demand growth continues to slow, as suggested by monetary trends.
The easing of supply pressures, moreover, carries its own warning for demand prospects. The PMI delivery times index is inversely correlated with the rate of change of G7 stockbuilding – chart 2. Recent long delivery delays reflect not only pandemic-related disruption but also a scramble to boost inventories following intense destocking. The easing of blockages, therefore, is indirect evidence that the demand growth boost from the stockbuilding cycle is at or near a peak.
Chart 2
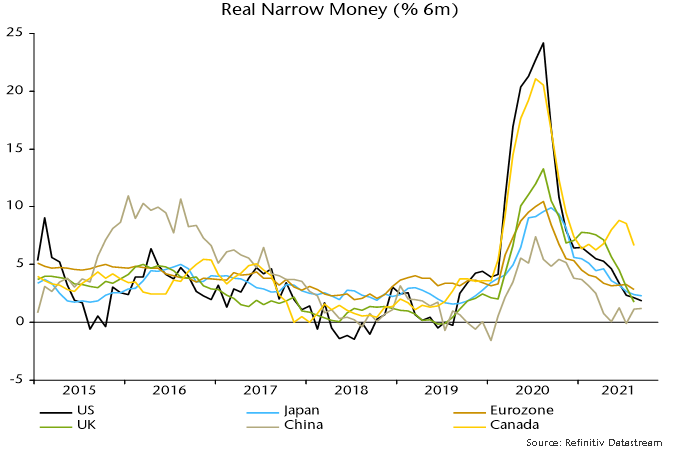
The global six-month real narrow money growth estimate for September incorporates further falls in the US / Japan and a stable Chinese reading – chart 3. The US / China gap – which surged last year, warning of divergent economic / equity market prospects – has almost closed. Eurozone and UK September monetary data will be released on 27 and 29 October respectively. Canadian numbers appear with a one-month lag: real money growth remained relatively strong in August (just released), suggesting that the Bank of Canada will be under pressure to hike rates soon.
Chart 3
Connor, Clark & Lunn Infrastructure (CC&L Infrastructure) today announced the formation of a strategic partnership with Hy Stor Energy LP (Hy Stor Energy), which will develop, commercialize and operate green hydrogen production, storage, and distribution at scale.
Hy Stor Energy is developing a portfolio of large-scale, fully integrated green hydrogen projects in the United States. The projects will include the on-site production, storage, and delivery of green hydrogen as both a zero-carbon fuel and a means of storing and producing electricity on demand. This combination of storage and scale will be critical in accelerating the green hydrogen economy in the United States and will support the nation’s transition to a net zero carbon emissions future.
Hy Stor Energy is already permitted for hydrogen storage at multiple locations in the U.S. Gulf Coast, which together will form the backbone of a regional hub. This hydrogen hub will have co-located production, transmission, pipeline, rail and other infrastructure, linking these components to add value while driving economies of scale and attracting end-users. The hub is also expected to attract intellectual capital, spur innovation, create jobs and stimulate the local economy. It will deliver a major source of safe, reliable and 100% carbon free energy that is flexible and available on demand.
“CC&L Infrastructure is excited to further participate in the global energy transition with this partnership,” said Matt O’Brien, President of CC&L Infrastructure. “We believe that the green hydrogen sector is nearing an important inflection point and that its growth will contribute meaningfully to the achievement of net zero carbon emissions targets over the coming decades. The partnership with Hy Stor Energy is a natural evolution of our long-term investment strategy that builds upon our existing expertise in renewable energy. Through this partnership, CC&L Infrastructure and its clients will gain access to a number of attractive investments in a rapidly growing renewable sub-sector as well as technical expertise in green hydrogen and energy storage.”
“Hy Stor Energy is solving the unique challenges of a world transitioning to renewable energy, and we’re developing a model for producing, storing and delivering 100% carbon-free green hydrogen reliably, consistently – and at scale,” said Laura Luce, CEO of Hy Stor Energy. “Our partnership with CC&L Infrastructure will enable us to advance the large-scale development and commercialization of green hydrogen and long-duration storage.”
Green hydrogen is a zero-carbon fuel source and an energy storage mechanism. It is created using renewable energy and a process called electrolysis. Electrolysis uses only two inputs – water and renewable electricity – to produce hydrogen with zero emissions and with oxygen as the only byproduct. Green hydrogen is expected to play a critical role in the global shift away from fossil fuel based sources of energy. Specifically, it can enable the decarbonization of sectors where direct electrification is not practical, offering a viable path towards zero emissions for many industries and jurisdictions.
CC&L Infrastructure’s investment mandate targets traditional and energy infrastructure assets and companies, including power generation, electricity transmission and distribution, and energy storage, among other projects. The firm is an active investor and owner of renewable energy assets and has a current portfolio totaling 1.4 GW of clean energy generating capacity globally. The majority of these assets were acquired during development and the CC&L Infrastructure team has significant experience in both construction oversight and ongoing asset management. The partnership with Hy Stor Energy will build upon this expertise to support further decarbonization efforts and the global energy transition.
About Connor, Clark & Lunn Infrastructure
CC&L Infrastructure invests in middle-market infrastructure assets with highly attractive risk-return characteristics, long lives and the potential to generate stable cash flows. The firm has been an active investor and owner of renewable energy assets for more than 15 years. Its portfolio includes more than 60 hydro, solar, and wind facilities totaling 1.4 GW of clean energy generating capacity globally. CC&L Infrastructure is a part of Connor, Clark & Lunn Financial Group Ltd., a multi-boutique asset management firm whose affiliates collectively manage over CAD$100 billion in assets. For more information, please visit www.cclinfrastructure.com.
About Hy Stor Energy
Hy Stor Energy is facilitating the transition to a fossil-free energy environment by developing and advancing green hydrogen at scale through the development, commercialization, and operation of green hydrogen hub projects. Large, fully integrated projects produce, store, and deliver 100% carbon-free energy, providing customers with safe and reliable renewable energy on-demand. Developed as part of an integrated hub, these projects couple on-site green hydrogen production with integrated long-duration storage and distribution – using scale to reduce costs. Hy Stor Energy, led by energy storage industry and hydrogen technology veteran Laura L. Luce, has an innovative team with deep expertise and is positioned as a leader in the green hydrogen revolution. For more information, please visit www.hystorenergy.com.
Contact:
Kaitlin Blainey Director Connor, Clark & Lunn Infrastructure (416) 216-8047 [email protected]
Le Groupe financier Connor, Clark & Lunn (Groupe financier CC&L) est heureux d’annoncer qu’il est devenu un participant fondateur d’Engagement climatique Canada (ECC). Il s’agit d’une initiative de collaboration canadienne menée par le secteur de la finance qui vise à favoriser le dialogue entre le milieu financier et les sociétés canadiennes sur les risques et les occasions liés au climat et sur la transition vers une économie carboneutre.
À son lancement, le programme d’ECC compte plus de 25 participants fondateurs, des investisseurs qui gèrent collectivement un actif de plus de 3 000 milliards de dollars. Le Groupe financier CC&L représente ses trois sociétés affiliées d’actions canadiennes, à savoir Gestion de placements Connor, Clark & Lunn Ltée, PCJ Investment Counsel Ltd. et Gestion de placements Scheer, Rowlett & Associés Ltée.
« Le Groupe financier Connor, Clark & Lunn se réjouit à l’idée de collaborer avec d’autres investisseurs institutionnels pour s’attaquer au risque climatique dans l’économie canadienne et à la transition vers la carboneutralité », a déclaré Michael Walsh, directeur général, Groupe financier Connor, Clark & Lunn. « Toutes les sociétés affiliées au Groupe financier CC&L consacrent beaucoup de temps à la recherche sur les risques et les possibilités de placement associés aux facteurs ESG ainsi qu’à la mobilisation auprès des équipes de direction des sociétés sur les enjeux ESG. C’est pourquoi nous considérons ECC comme une occasion en or de nous exprimer d’une seule voix avec plus de force sur la question des changements climatiques. »
L’initiative d’ECC est coordonnée par plusieurs réseaux d’investisseurs, dont l’Association pour l’investissement responsable (AIR), la Shareholder Association for Research and Education (SHARE) et Ceres. Les Principes pour l’investissement responsable (PIR) des Nations Unies soutiennent également le programme.
ECC a été inspiré par le Groupe d’experts sur la finance durable du Canada, qui a formulé en 2019 une série de recommandations visant à mettre le système financier canadien sur la voie d’un avenir à faibles émissions de carbone. L’une des recommandations était d’établir un programme de mobilisation national, semblable à l’initiative mondiale Climate Action 100+, afin de favoriser un dialogue plus vaste et plus cohérent avec les émetteurs canadiens sur les risques et les occasions liés au climat. Et ce programme, c’est Engagement climatique Canada.
À propos du Groupe financier Connor, Clark & Lunn Ltée.
Le Groupe financier Connor, Clark & Lunn Ltée (Groupe financier CC&L) est une société de gestion de placements regroupant plusieurs sociétés, qui offre un large éventail de produits et de services de gestion de placements aux investisseurs institutionnels, aux particuliers fortunés et aux conseillers. Cette structure nous procure une envergure et une expertise considérables qui nous permettent d’assumer des fonctions administratives qui ne sont pas liées aux placements tout en laissant nos gestionnaires de placement se concentrer sur ce qu’ils font le mieux grâce à la centralisation des activités liées aux opérations et à la distribution. Possédant des bureaux un peu partout au Canada, de même qu’à Chicago et à Londres, les sociétés affiliées au Groupe financier CC&L gèrent des actifs totalisant plus de 100 milliards de dollars. Pour obtenir de plus amples renseignements, veuillez consulter le site www.cclgroup.com.
Personne-ressource
Blythe Clark Gestionnaire, Intendance et engagement Groupe financier Connor, Clark & Lunn (604) 891-2601 [email protected]
In recent weeks there has been a power crisis in China, brought about by the increase in coal prices. Over the last six months, prices have more than doubled and utility companies have been unable to pass on the increase on users (consumers and industry).
In Europe, a similar crisis is unfolding with the cost of electricity reaching all-time highs, driven by a spike in natural gas prices up 400% since the spring. Earlier in the year, we saw electric grids from Texas to California suffer major outages. Those outages have been used by some commentators to blame the investments made in renewable energy.
Green hydrogen is the best and the only solution to solve many of our energy problems as well as getting to net-zero, even though producing it today is quite expensive. Green hydrogen refers to electrolysis systems in which hydrogen is produced from water using electricity provided by renewable energy. It can also be produced from waste such as biogas, municipal solid waste, and industrial waste.
Electric vehicles may help to reduce our carbon emissions, assuming the electricity to charge them comes from renewables and that the grid can handle millions of vehicles plugging in. Steel, shipping, aviation, and trucking account for 40% of our carbon footprint, to which these are industries that batteries cannot fix.
Hydrogen can serve many objectives beyond decarbonization. Its ability to substitute for natural gas would go a long way to secure a country’s energy independence, something Europe would envy given its dependence on gas imports from Russia. Hydrogen is even exportable by pipeline or ship unlike other renewables limited by electrical grids.
Within the next decade, the scaling up of electrolyzer production and the deployment of fueling infrastructure will bring costs down to a level that is lower than fossil fuels and does not have the limitations of batteries.
The legislative framework
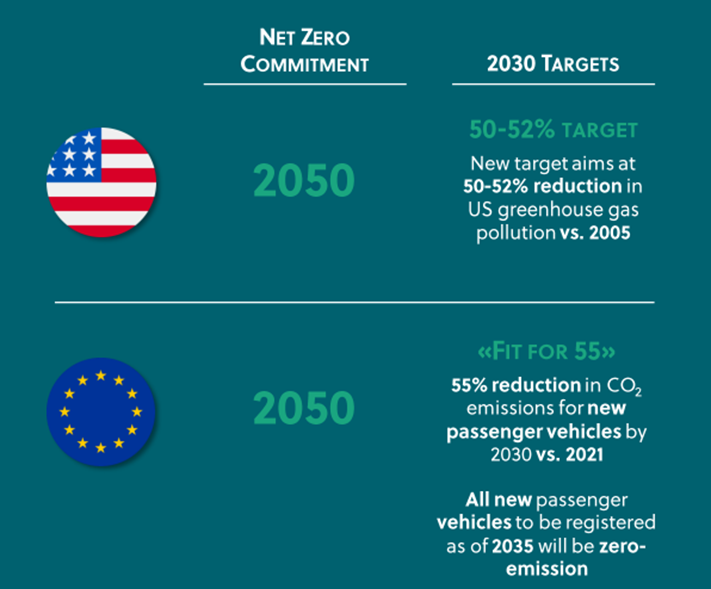
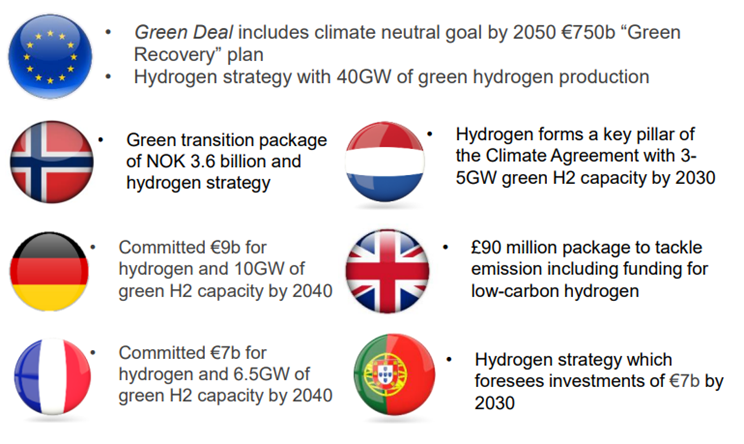
The 2021 United Nations Climate Change Conference (COP26) will take place at the end of October. After a historic year of extreme weather, and following a grim report published in August, we can expect a real sense of urgency and more concrete and measurable commitments following the conference. Major economies have already made commitments; we highlight a few below.
Source: Hexagon Purus Investor presentation
In terms of the hydrogen economy, below are a few of the initiatives that have been announced in Europe:
Source: Ballard Power investor presentation
China is widely recognized as a global leader in clean-energy technology: it controls 60% of the solar supply chain; is home to five of the top 10 wind turbine manufacturers; and leads the world in lithium-ion batteries. In September 2020, Chinese leaders pledged to reach carbon neutrality by 2060. It is no surprise that China wants to become a leader in hydrogen as well.
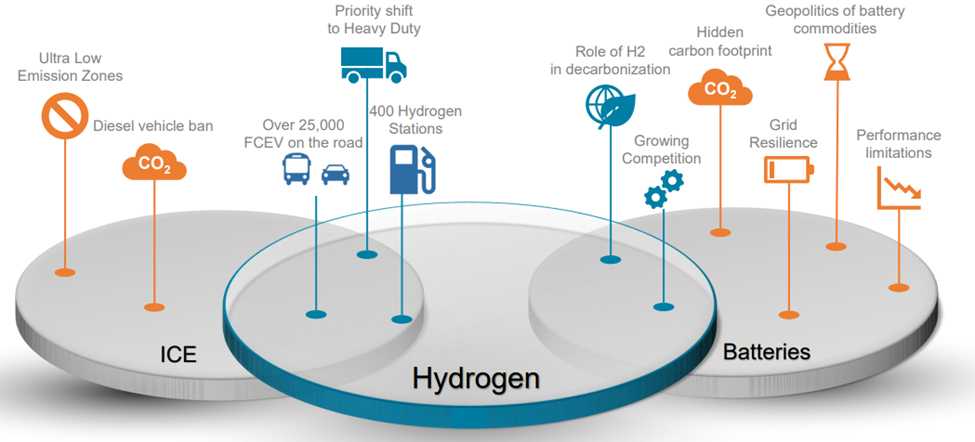
Looking at the success of Tesla and the massive investments incumbent automakers are making to electrify their vehicles, we might think that adopting electric vehicles (EV) will be the solution to our problems. As we noted above, car and light trucks are only part of the emissions crisis, accounting for less than 20% of total emissions. But, staying with transportation, let us compare hydrogen with other technologies, as hydrogen is most competitive in heavy-duty motive applications.
The following chart shows the intersection of different technologies.
Source Ballard Power investor presentation.
The addressable market for hydrogen as a transportation fuel is huge, even excluding SUVs and cars:
450,000 buses and intercity coaches,
Four million medium/heavy-duty trucks,
8,500 Electric hybrid trains,
8,000 freight ships, and
Off-highway vehicles.
However, even if we were to solve the problem of infrastructure (fueling stations), hydrogen for cars and light trucks presents many advantages:
They are lighter;
They can fill up in just a few minutes; and
Their components are more easily recyclables.
A 2017 survey of 1,000 global auto executives concluded that hydrogen fuel cell technology will dominate battery-powered vehicles. More recent comments from Toyota, Honda, Hyundai, BMW, and Mercedes Benz go in the same direction.
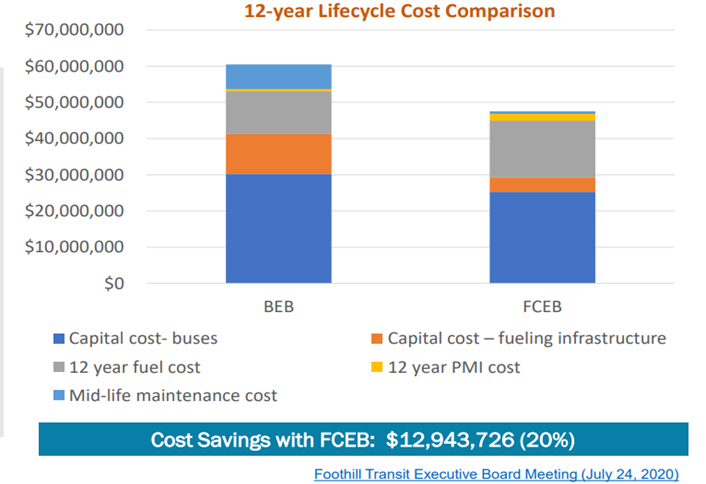
One market that is rapidly adopting zero-emission technology is the transit bus market. Although there have been many announcements about electric buses, many studies show that Fuel Cell buses have an advantage in terms of total cost of ownership, even at current prices.
For buses, an ICT study with data collected by the California Air Resources Board (CARB) showed the advantage of hydrogen as fleet size increases:
The Foothill transit study compared the cost of deploying twenty zero-emission buses on a 42-mile roundtrip route. Due to the range limitations of electric buses, it was determined the line would require 34 battery buses versus 23 hydrogen buses.
“The 100 percent FCEBs scenario showed a slightly lower overall cost than the mixed technology fleet given current vehicle, fuel, and support infrastructure pricing. FCEBs offer an extended range and better match to OCTA’s current operating parameters. In comparison, the current range of BEBs may require more vehicles and drivers to meet similar service levels.” Orange County Transportation Authority.
How does Global Alpha participate in the hydrogen economy?
Iwatani is a Japanese company founded in 1930 and a leader in the field of energy, industrial gases and machinery, materials, agri-bio and foods. Since 1941, the company has engaged in initiatives to encourage the widespread use of hydrogen, the ultimate clean energy source as stated in the company’s mission. Iwatani is Japan’s only fully integrated supplier of hydrogen, and presently supplies its base of light and heavy-duty hydrogen-refueling stations and industrial customers via five liquid and 10 gaseous hydrogen production plants throughout the country. In addition, Iwatani is a steering member of the Hydrogen Council, a global initiative of leading energy, transportation, and industry companies, with a united vision and long-term ambitions for hydrogen to foster the energy transition. Iwatani is developing hydrogen-refueling stations with the aim of stimulating new hydrogen demand and supporting the widespread distribution of Fuel Cell Electric Vehicles (FCEV). It currently has 64 refueling stations, a number that doubled in the last three years.
This Norwegian company has 1100 employees across 23 global locations. Its solution enables the storage, transport, and conversion to clean energy in a wide range of mobility, industrial, and consumer applications:
We profiled Clean Energy Fuels in an earlier commentary, on May 6, 2021.
Although we discussed hydrogen, renewable natural gas, which can then be reformed to produce hydrogen, is the only transportation fuel today that offers a negative carbon footprint.
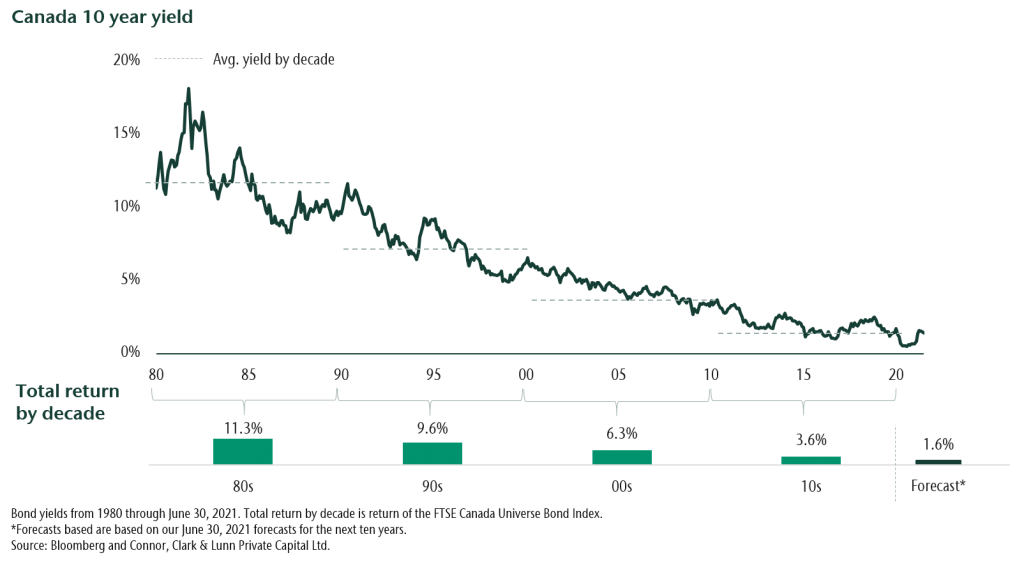
The last forty years have delivered strong returns for bonds and now, “the times they are a-changin’.” The strong returns of the past now come at the price of low returns in the future, so low that we expect bonds won’t keep pace with inflation. This is the result of a long term decline in bond yields and the fact that these ultra-low yields today influence future return. The chart below illustrates the relationship between bond yield and total return. As yields fell so followed the total return.
Four decades of falling yield and return
Compounding the issue, when bond yields inevitably rise, we expect bonds to experience periods of negative returns. We experienced such a decline in the first quarter of 2021 when the Canadian core bond index, made up of investment grade bonds, fell 5.0%**. More recently we have seen negative returns as inflation rises and central banks begin to reduce the level of stimulus.
Think of bonds as insurance
The purpose of holding core bonds in a portfolio has been to generate income and provide stability. With today’s low levels of income, the reason to hold bonds is for the protection they provide during periods of significant equity decline. This protection from bonds is similar to buying insurance on a home. We expect to pay for home insurance and only benefit if there is unforeseen damage. Now investors are paying more for the protection of bonds in the form of lower portfolio returns.
An active approach is critical
At CC&L Private Capital, we are focused on positioning client portfolios for success. This includes uncovering opportunities in the capital market that generate better outcomes. Over the last ten years we have moved away from traditional sources of return and reduced allocations to core bonds. In their place we have added private market direct investments in:
Real estate
Infrastructure
Private loans
We have also added public market strategies to our investment platform including:
High yield bonds
Market neutral hedge
Overall these strategies improve portfolio income and expected return. They also more broadly diversify portfolio risk, which allows us to reduce the protection that comes with core bonds while not meaningfully increasing overall risk. As such, these strategies are a good solution for many investor portfolios.
For those that hold core bonds, active management has never been more important. It’s vital to have a manager that incorporates macro-economic views and deep credit research. Both are essential if you are going to generate above-market returns while managing risk. Using their broad set of tools, our experienced team of portfolio managers and analysts are able to uncover opportunities despite the ultra-low yield environment.
Consider your objectives
Changes to a portfolios asset allocation should not be made lightly. It’s important to consider how changes to a portfolio’s asset allocation may affect its ability to meet one’s desired objectives. We work closely with our clients to develop a plan that incorporates historical risk and forecasts for asset class returns, and marries these inputs with clients’ financial situations. This process allows clients to pre-experience their wealth under different allocation scenarios and ensure the strategy is best suited to meet their desired outcome. For some, reducing core bonds is warranted. Others may choose to maintain their asset mix because they have enough capital to meet their future goals. Of course another option is to make lifestyle decisions like save more or spend less over time. Whatever the preference, we can quantify the long-term outcome to wealth and likelihood of meeting specific objectives. We have dedicated significant resources to this planning so that our clients can feel confident they are well positioned to meet their personal version of financial success.
This post is for information only and not intended as investment advice. The views expressed are subject to change at any time.
** FTSE Canada Universe Bond Index.
Markets overview
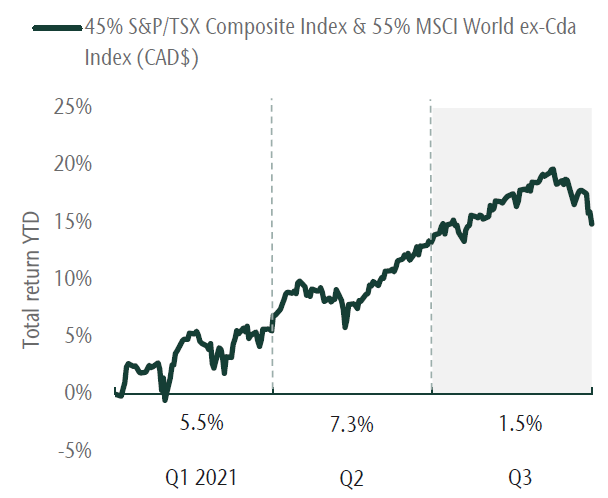
The economic recovery from the pandemic has been strong and more enthusiastic than expected. There is a surge in demand for goods which is contributing to supply shortages and rising inflation. Given the backdrop, policymakers are beginning to reduce the emergency level stimulus that was put in place. The equity market response has been more volatility and lower returns than earlier in the recovery. This is expected given the outlook for more moderate growth and less support from central banks. On the quarter the S&P/TSX Composite Index was up 0.2% and the MSCI World ex Canada (C$) advanced 2.5%. Year to date this brings these market returns to 17.5% and 12.6%, respectively.
More moderate equity returns in Q3
Source: MSCI, Refinitiv
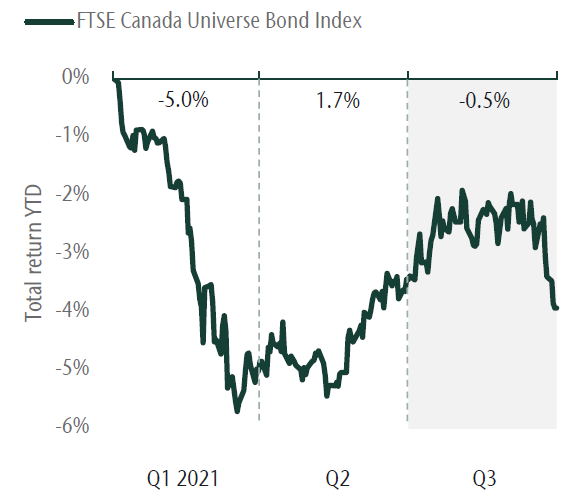
Bonds produced negative returns this quarter and year as yields were affected by both a surge in growth earlier in the year and recent changes to central bank policy. The FTSE Canada Universe Bond Index was down -0.5% for the quarter and down -4.0% for the year. High yield and short bonds, which are less sensitive to changes in yield, generated positive returns.
Bond returns remain negative
Source: FTSE, Refinitiv
Portfolio strategy
Our view is that we are experiencing a strong economic recovery supported by a broadening global restart. At the same time we expect higher inflation and a more muted monetary response going forward. We maintain an overweight to equities but recognize risks are rising. As equity market performance has been strong, we have taken profits. Within equities, we have an overweight to small-cap stocks which will benefit from above trend growth. Within bonds, we have been increasing our high yield exposure which is more attractive than core bonds given their low expected return.
Our portfolio management teams continue to favour more cyclical companies that are levered to the economic recovery. However, given the outlook for slower economic growth, inflation and supply bottlenecks, we are adding companies that can generate strong earnings despite these headwinds. Within fixed income, we have taken profits by reducing exposure to the corporate sector as well as real return bonds that have benefited significantly from higher inflation. Our positioning in portfolios has served clients well and remains attractive as we move into the final quarter of the year.
From the desk of Jeff Guise, Managing Director, Chief Investment Officer, CC&L Private Capital.
This post is for information only and is not intended as investment advice. The views expressed are those of the author at the time of publication and are subject to change at any time.
The forecasting approach employed here – relying on monetary and cycle analysis – turned positive on the global economy and risk markets in early Q2 2020 but is giving a more cautionary message at the start of 2021. The suggestion is that underlying economic momentum will slow temporarily while monetary support for markets has diminished, together raising the risk of a correction. The central view remains that global growth will be strong over the course of 2021 as a whole but with the adverse corollary of a significant pick-up in inflation into 2022.
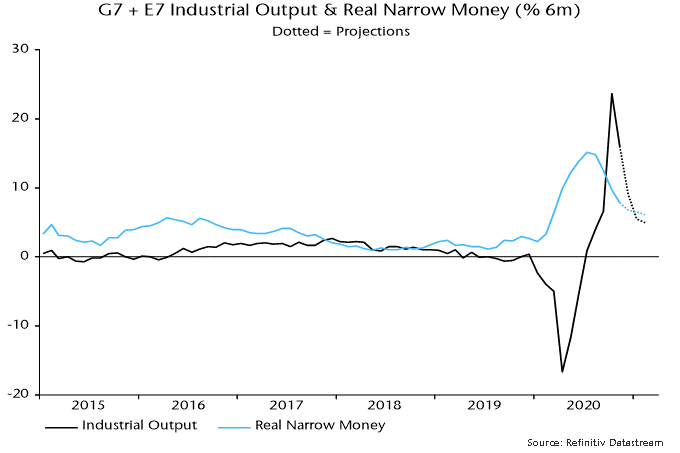
The monetary aspect of the forecasting approach can be summarised as “real money leads the economy while excess money drives markets”. Six-month growth of real (i.e. inflation-adjusted) narrow money in the G7 economies and seven large emerging economies (the “E7”) was weak at the start of 2020 but surged from March, correctly signalling a strong rebound in global economic activity during H2.
Real money growth, however, peaked in July, falling steadily through November, the latest data point – see chart 1. Turning points in real money growth have led turning points in the global manufacturing PMI new orders index – a key coincident indicator – by 6-7 months on average historically, suggesting that the PMI will move lower in early 2021. The level of money growth remains high, arguing against economic weakness (except due to “lockdowns”), but a directional shift in activity momentum could act as a near-term drag on cyclical assets.
Chart 1
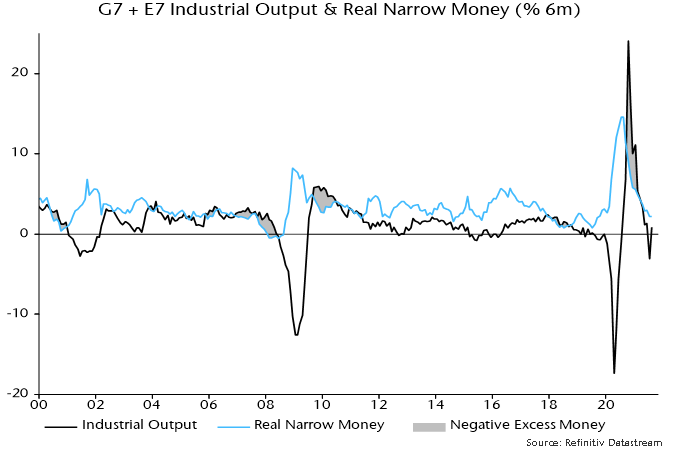
“Excess” money refers to an environment in which actual real money growth exceeds the level required to support economic expansion, with the surplus likely to be invested in markets. Two gauges of excess money are monitored here: the gap between six-month growth rates of G7 plus E7 real narrow money and industrial output, and the deviation of year-on-year real money growth from a long-run moving average. Historically, global equities performed best on average when both measures were positive, worst when they were negative, and were lacklustre when they gave conflicting signals.
Following a joint positive signal (allowing for data release lags) at end-April 2020, the measures became conflicting again at end-December – year-on-year real money growth remains well above its long-run average but six-month growth fell below that of industrial output in October / November. Markets, therefore, may no longer enjoy a monetary “cushion” against unfavourable news, including the expected PMI roll-over.
The expectation here is that markets will become more volatile but risk assets are unlikely to be outright weak – any sizeable set-back would probably represent another buying opportunity. As noted, real money growth remains at an expansionary level and may stabilise soon, while the cycle analysis is giving a positive economic message for the next 12+ months, as explained below.
The cross-over of six-month real narrow money growth below industrial output growth, moreover, could prove short-lived, with output momentum about to fall back sharply as positive base effects fade. Assuming a stabilisation of monthly money growth, a positive differential could be restored as early as January – see chart 2 – in which case the assessment of the monetary backdrop for markets would shift back to favourable from Q2.
Chart 2
The cycle analysis provides a medium-term perspective and acts as a cross-check of the monetary analysis. There are three key economic activity cycles: the stockbuilding or inventory cycle, which averages 3.5 years (i.e. from low to low); a 9-year business investment cycle; and a longer-term housing cycle averaging 18 years. These cycles are essentially global in nature although housing cycles in individual countries can sometimes become desynchronised.
The cycle analysis was cautionary at the start of 2020, reflecting a judgement that the stockbuilding and business investment cycles were in downswings that might not complete until mid-year. The covid shock magnified but ended these downswings, with both cycles bottoming in Q2 and entering a recovery phase in H2. With the housing cycle still in an upswing from a 2009 low, all three cycles are now acting to lift global economic momentum.
The next scheduled cycle trough is a low in the stockbuilding cycle, due to be reached in late 2023 if the current cycle conforms to the average 3.5 year length. The downswing into this low would probably start about 18 months earlier, i.e. around Q2 2022. The cycle analysis, therefore, is giving an “all-clear” signal for the global economy for the next 15-18 months, implying that any data weakness – such as suggested by monetary trends for early 2021 – is likely to be minor and temporary.
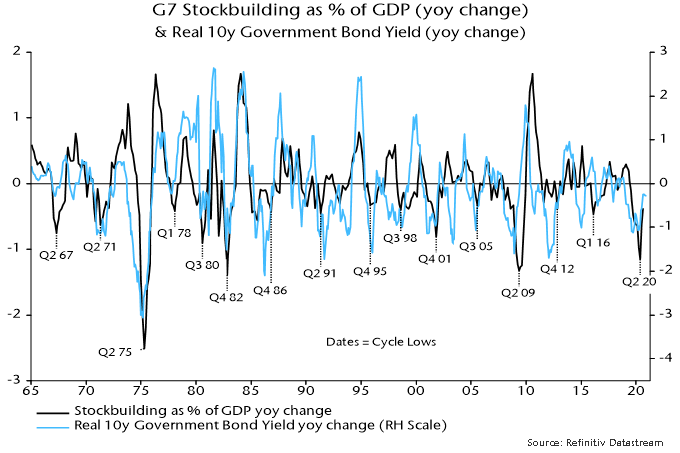
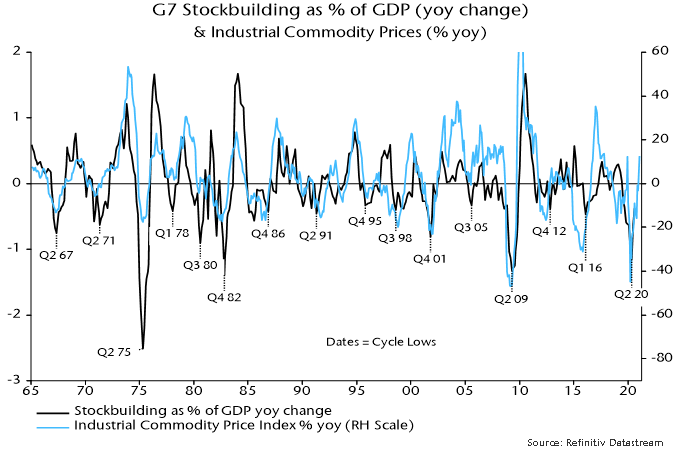
Financial market behaviour is strongly correlated with the stockbuilding cycle in particular. Cycle upswings are usually associated with rising real government bond yields and strong commodity markets – see charts 3 and 4 – as well as low / falling credit spreads and outperformance of cyclical equity sectors. The latter three of these trends, of course, were in place during H2 2020 and may extend during 2021 after a possible Q1 correction. A surprise to the consensus in 2021 could be a rebound in real bond yields, which would challenge current equity market valuations and could favour “value”.
Chart 3
Chart 4
To sum up, monetary data in early 2021 will be important for the strategy assessment here. The current monetary backdrop and possible weaker near-term economic data suggest reducing cyclical exposure relative to H2 2020 but a stabilisation or revival in real money growth would support the positive message from the cycle analysis, arguing for using any setback in cyclical markets to rebuild positions in anticipation of a strong H2.
Consumer price inflation rates are widely expected to rise during H1 2021, reflecting recent commodity price strength, a reversal of temporary tax cuts (Germany / UK) or subsidies (Japan), and base effects. The policy-maker and market consensus is that this will represent a temporary “cyclical” move of the sort experienced regularly in recent decades. The suspicion here is that it will prove more lasting and significant, because the monetary backdrop is much more expansionary / inflationary than before those prior run-ups.
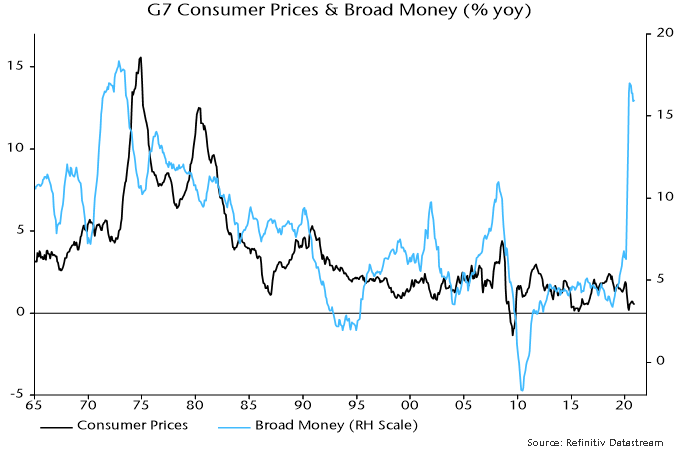
Broad rather than narrow money trends are key for assessing medium-term inflation prospects. This is illustrated by Japan’s post-bubble experience: narrow money has grown strongly on occasions but annual broad money expansion never rose above 5% over 1992-2019, averaging just 2.1% – the monetary basis for sustained low inflation / mild deflation. Similarly, G7 annual broad money growth averaged only 3.7% in the post-GFC decade (i.e. 2010-19).
2020 may have marked a transformational break in monetary trends. G7 annual broad money growth peaked at 17.0% in June, the fastest since 1973 – see chart 5. Monthly growth has subsided but there has been no “payback” of the H1 surge. At the very least, this suggests a larger-than-normal “cyclical” upswing in inflation in 2021-22. Ongoing monetary financing of large fiscal deficits may sustain broad money growth at well above its levels of recent decades, embedding the inflation shift.
Chart 5
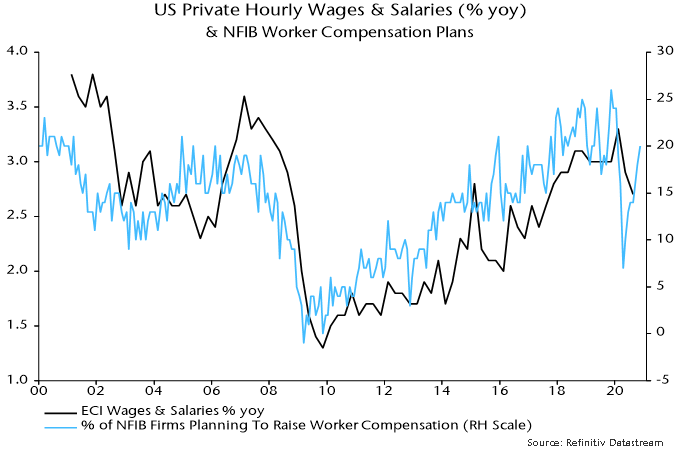
The consensus view that an inflation pick-up will prove temporary rests on weak labour markets bearing down on wage growth. Unemployment rates adjusted for short-time working / furlough schemes, however, fell sharply as the global economy rebounded in H2 2020 and structural rates have probably risen – labour market “slack”, therefore, may be less than widely thought and much lower than after the 2008-09 recession. The slowdown in wages to date has been modest and some business surveys are already hinting at a rebound – see chart 6.
Chart 6
Commentators who take seriously the prospect of a sustained inflation rise often argue that real bond yields would take the strain by moving deeper into negative territory, the view being that central banks will cap nominal yields. Such a scenario would be bullish for risk assets but probably overstates the power of the policy emperors. Pegged official rates and a QE flow currently running at about 10% of the (rapidly rising) outstanding stock of G7 government bonds per annum could prove insufficient to offset selling by existing holders in the event of an unexpected inflation surge.
Global industrial output has flatlined since early 2021, reflecting supply disruptions but also a loss of demand momentum. Output may recover into 2022 as supply problems ease but money trends signal a further weakening of underlying momentum. Second-round inflation effects, meanwhile, may force central banks to bring forward plans for stimulus withdrawal – unless markets weaken sharply. This backdrop suggests retaining a cautious investment strategy unless money trends rebound in late 2021 – possible but not a central scenario.
The ”monetarist” forecasting approach used here relies on the rules of thumb that 1) real narrow money growth directionally leads demand / output growth by 6-12 months (average 9 months) and 2) nominal broad money growth directionally leads inflation by 1-3 years (average 2+ years). Global narrow / broad money growth surged in 2020 but has slowed this year. This slowdown is being reflected in a loss of economic momentum but the inflationary impact of the 2020 bulge will continue well into 2022. Current “stagflation” concerns, therefore, are likely to persist.
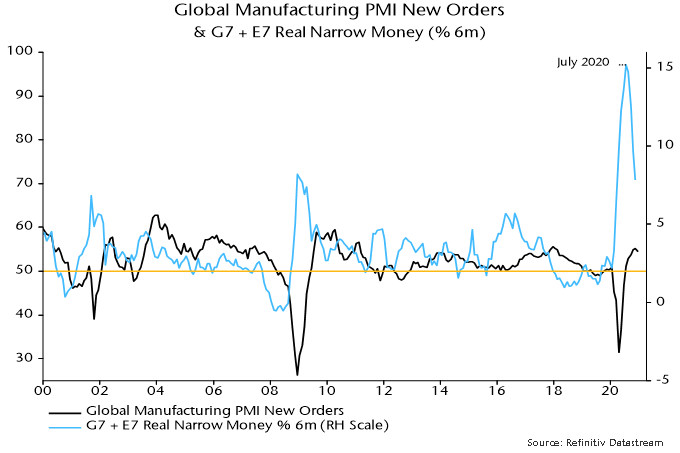
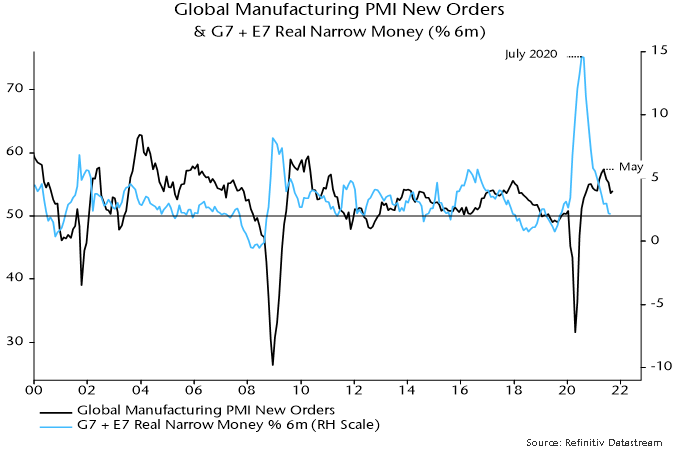
Supply chain disruption is distorting economic data, complicating analysis. The presumption here is that the global manufacturing PMI new orders index is a reasonable guide to underlying industrial demand momentum. The index has fallen since May, mirroring an earlier decline in global (i.e. G7 plus E7) six-month real narrow money growth from a July 2020 peak – see chart 1. With real money growth sliding further into July / August 2021, the suggestion is that the PMI new orders index is unlikely to reach a bottom before early 2022.
Chart 1
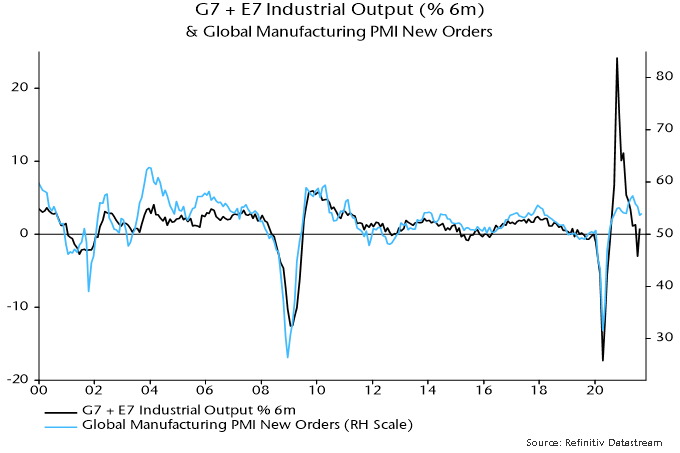
Supply chain disruption, however, has resulted in a substantial undershoot of industrial output relative to the growth rate suggested by the PMI new orders index, implying scope for a short-term catch-up – chart 2. Market participants could wrongly interpret such a pick-up as a reversal in trend momentum. Confusing signals could lead to greater market volatility but any revival in the cyclical / reflation trade is likely to be short-lived unless monetary trends – and hence PMI prospects – improve.
Chart 2
The approach here uses cycle analysis to cross-check monetary signals and provide longer-term context. The 3-5 year stockbuilding and 7-11 year business investment cycles are judged to have bottomed in Q2 2020 and are currently providing a tailwind to the global economy, cushioning the impact of less expansionary monetary conditions.
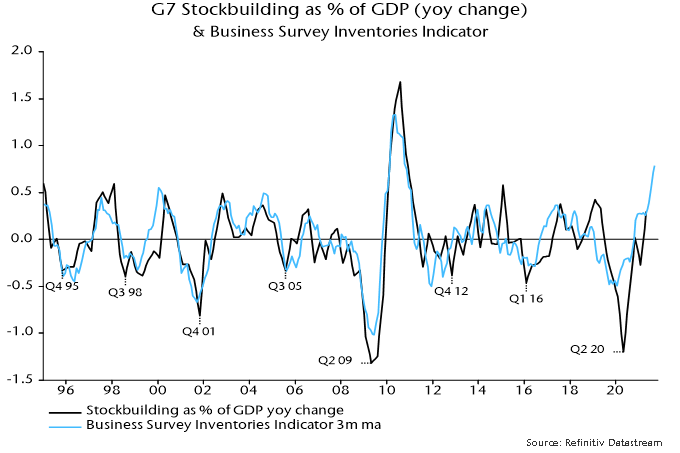
The next cyclical “event” will be a peak and downswing in the stockbuilding cycle. Based on its average historical length of 3 1/3 years, the next cycle low could occur in H2 2023, implying a peak by H2 2022 at the latest. The business survey inventories indicator calculated here, however, suggests that the cycle upswing is already well-advanced, hinting at an early peak – chart 3.
Chart 3
The upshot is that monetary trends suggest a slowdown in global economic momentum through early 2022 while the stockbuilding cycle is likely to act as a drag from H2 2022. This leaves open the possibility of a resumption of strong economic growth in a 2-3 quarter window around mid-2022. An immediate rebound in global real narrow money growth, however, is needed to validate this scenario.
Such a rebound is possible despite the Fed and other central banks moving to wind down stimulus. It could be driven, for example, by Chinese policy easing to support a weak economy, a sharp reversal in commodity prices as industrial momentum softens (boosting real money growth via a near-term inflation slowdown) or a pick-up in bank lending (normal at this stage of stockbuilding / business investment cycle upswings). It is, however, unnecessary to speculate – it is usually sufficient for forecasting purposes to respond to monetary signals rather than try to anticipate them.
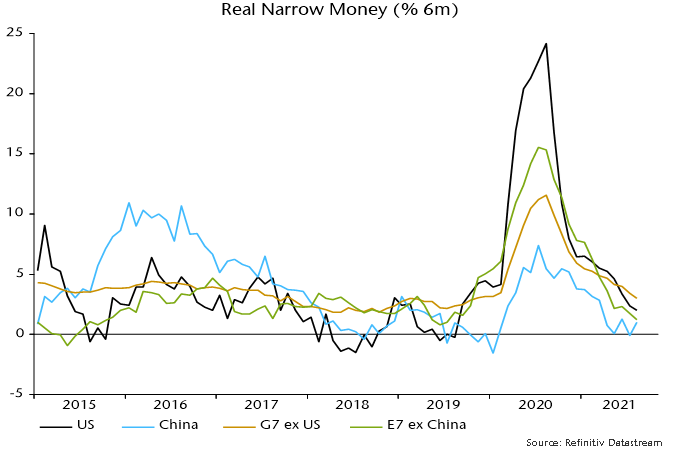
Chart 4 shows a breakdown of G7 plus E7 six-month real narrow money growth. Earlier US relative strength / Chinese weakness has been reflected in divergent year-to-date equity market performance, with DM ex. US and EM ex. China indices charting a middle course. A recent cross-over of US real money growth below the G7 ex. US average suggests reducing US exposure in favour of other developed markets.
Chart 4
Chinese real money growth, meanwhile, was showing signs of bottoming before the recent escalation of financial difficulties at property developer Evergrande. This could result in faster policy easing, an “endogenous” tightening of credit conditions, or both. The net monetary impact is uncertain but a recovery in money growth in late 2021 would argue for adding Chinese exposure in global and EM portfolios despite likely further weakness in economic data.
Investors continue to debate whether high inflation is “transitory” as central bankers naturally assert. The monetarist view is straightforward: the roughly 2-year transmission of money to prices implies no significant inflation relief before H2 2022, while a return to pre-covid levels requires a further slowdown in global broad money growth.
Inflation drivers are likely to shift, with energy and other industrial commodity prices cooling as the global economy slows but offsetting upward impulses from food, rents and accelerating unit wage costs as labour shortages and mismatches force pay rises above productivity growth.
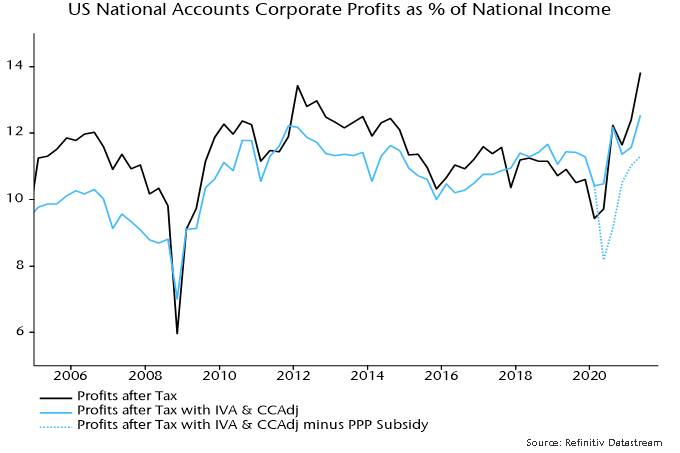
Rising labour costs could, in theory, be absorbed by a reduction in profit margins rather than being passed on in prices. Recent profits numbers, however, overstate underlying health because of stock appreciation and pandemic-related government support. The share in US national income of an “economic” measure of corporate profits (i.e. adjusted for inventory valuation effects and Paycheck Protection Program subsidies, and to reflect “true” depreciation) is in line with its average over 2010-19, in contrast to inflated book profits – chart 5.
Chart 5
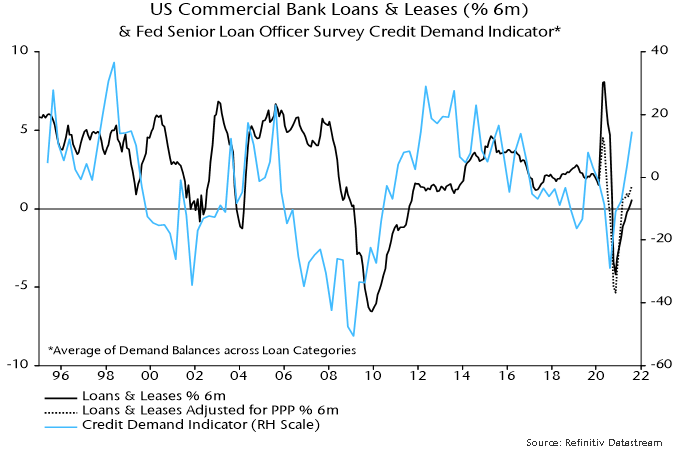
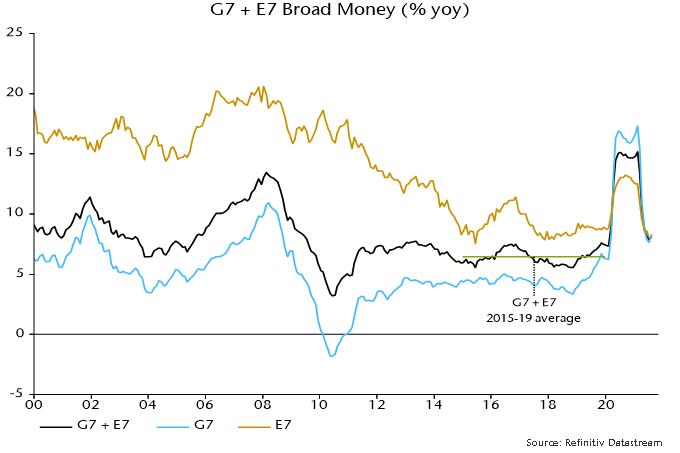
G7 annual broad money growth has fallen from a peak of 17.3% in February 2021 to 8.3% in August, with 3-month annualised growth at 6.2%. This is still high by pre-covid standards: annual growth averaged 4.5% over 2015-19. Reduced support to money growth from QE could be offset by faster expansion of bank balance sheets, reflecting strong capital / liquidity positions and rising credit demand. US commercial bank loans and leases have recently resumed growth, with the Fed’s senior loan officer survey suggesting a further pick-up – chart 6. The ECB’s lending survey is similarly upbeat.
Chart 6
Adding in the E7, annual broad money growth is closer to the pre-covid level, at 8.2% in August versus a 2015-19 average of 6.4% – chart 7. Growth is below average in China, Mexico and Russia and in line in India. Inflationary pressures are more likely to prove “transitory” in these economies, suggesting support for local bond markets.
Chart 7
Global equities held up over the summer despite weaker activity news and upside inflation surprises. A monetarist explanation is that markets were supported by “excess” money, as supply disruptions contributed to global six-month industrial output growth falling below real narrow money growth – chart 8. A temporary output catch-up as supply problems ease could reverse this crossover – a further argument for maintaining a cautious investment stance emphasising defensive sectors and quality.