Close up of a male's hand paying bill with credit card contactless payment on smartphone in a cafe, scanning on a card machine.

When you think about banking in emerging markets, it may conjure images of long lines outside banks under the tropical sun. Surprisingly, it has been a rather short road from the long lines of yesterday to the super apps of today. For example, it’s not uncommon now to see street side hawkers in China and India accepting payments via apps as deftly as they handle their cast iron woks. Unburdened by the shackles of high cost legacy financial infrastructure, emerging markets have been faster, leaner, and more efficient in building the new age pipes that move money from point A to B.

There are three key reasons for this lightning pace of technology adoption.

  • Firstly, in the absence of a traditional brick and mortar banking network, the pace of adoption has been exponential. EM consumers have leapfrogged credit cards and traditional bank-to-bank payments to mobile-based transactions.
  • Secondly, emerging markets themselves have been open to collaborating with each other when it comes to sharing infrastructure and regulatory best practices via fintech bridges that connect fintech hubs like Dubai, Nairobi, and Singapore.
  • Finally, emerging markets offer the size and scale of the population required to encourage fintech startups to innovate and roll out new products.

The result of this fintech innovation and rapid penetration of mobile internet has been the rise of digital payment platforms, such as Paytm in India, GoPay in Indonesia, and M-Pesa in Kenya. Similarly, we have seen the rise of digital banks, like WeBank in China, Next Bank in Taiwan, and Kakao Bank in South Korea. Another differentiating factor in emerging markets has been the proactive intervention of governments in building the infrastructure that makes payments low cost and frictionless. In Brazil for example, there is PIX, an instant payment and open banking infrastructure. In India, we have the Unified Payments Interface (UPI), which is a real time, identity-based payment infrastructure.

A great result of this blistering adoption of fintech is the tradition of gifting red packets or envelopes called “Hongbaos” during the Chinese New Year as a blessing of good luck.According to WeChat, in 2019, a staggering 820 million digital Hongbaos were exchanged during the New Year. At Global Alpha, we are both excited by and aware of the disruption that is being caused by fintech to traditional financial incumbents in banking, payment processing, insurance, and investments.

In identifying investment opportunities, it is particularly relevant for us to understand how traditional banking incumbents are adapting to competition in digital banking.3 Let us take emerging markets in the Asia Pacific as an example where the share of consumers using digital banking has risen from 54% in 2017 to 88% in 2021 according to a McKinsey report. That’s a growth of 1.4x over 5 years.

Similarly, while over 70% of consumers in these countries are interested in using digital channels to access banking services, only 20-30% of them have actually made a purchase via these channels. This is a huge untapped opportunity for traditional banks to reach consumers in the comfort of their homes while offering them their full suite of products and services.

In this rapidly shifting landscape, we evaluate how traditional banks are shifting to an omnichannel approach by leveraging digital channels for everything from transactions, customer acquisition and retention, and cross-selling to improve the productivity of existing branch infrastructure. On the other end of the spectrum, we also look at new digital-only banks and how they are leveraging technology to offer a different value proposition to consumers.

We ask the following questions while evaluating opportunities in this space:

  • Do they have a unique proposition to make banking services more accessible and affordable? It’s not just about a sleeker interface and new branding. The rubber meets the road in seamless onboarding, friction-free purchasing experiences and high-quality customer service.
  • Do they offer the full suite of products and services that traditional banks offer?
  • Are they catering to underserved segments ignored by big banks? These segments offer the critical mass necessary for quick scalability.
  • Do they have experienced leadership with a plan towards a clear path to profitability? An experienced team knows how to leverage data for accurate targeting and product pricing while still deploying a robust risk management framework.

Banco Regional (RA MM)

One of our holdings that is looking to leverage opportunities in this space is Banco Regional in Mexico. Banco Regional focuses on banking for the small and medium enterprises (SME) segment. Banco Regional made a successful foray into the consumer segment by targeting the high net worth segment and more recently, it has decided to target the mid/low-end consumer with a fully digital offering called Hey Bank. With over 500 programmers on their payroll, Hey Bank has built an offering that is easy to use and full of convenient functionalities. Their mobile app allows customers to open an account in just five minutes. We like the fact that Hey Bank pursues profitable clients and is expected to break even by 2022. At Global Alpha, we continue to look for opportunities at the intersection of finance and technology that tap into the growing financialization of emerging economies.
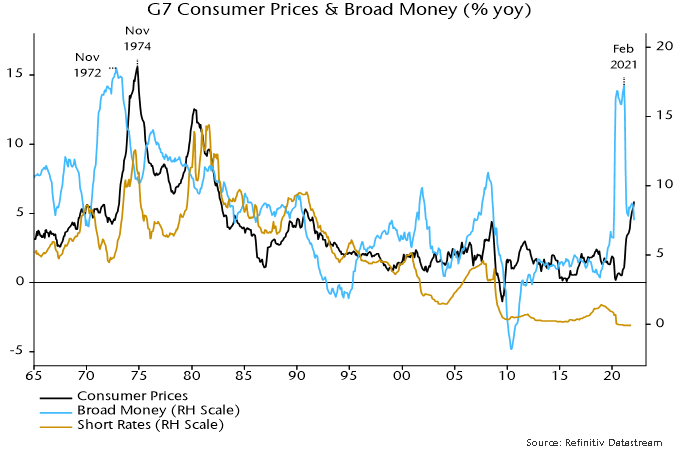
Why did high inflation become entrenched in the 1970s?

The consensus view is that an initial inflation shock became embedded in expectations, resulting in inflationary price- and wage-setting behaviour.

The “monetarist” view is that the underlying driver was sustained high money growth, which played a key role in allowing inflation expectations to become dislodged.

A surge in G7 annual broad money growth to a peak in November 1972 was followed by a surge in annual CPI inflation to a peak two years later – see chart 1.

Chart 1

Chart 1 showing G7 Consumer Prices and Broad Money

Broad money growth showed a similar surge to an initial peak in June 2020 and CPI inflation may top out in mid-2022. The ultimate peak in money growth was in February 2021, suggesting that inflation will remain high into 2023.

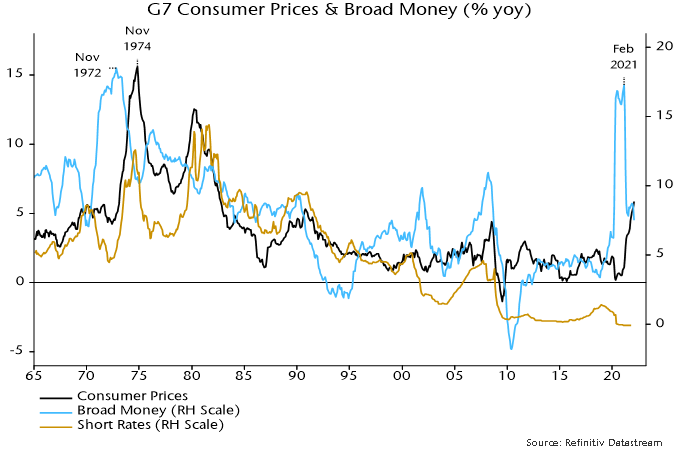
Monetary authorities responded to the 1973-74 inflation surge by tightening policy aggressively – see chart 2, which overlays a weighted average of G7 short-term interest rates. They had ignored the inflationary warning from money trends but displayed Volcker-esque zeal in attempting to correct their mistake.

Chart 2

Chart 2 showing G7 Consumer Prices, Broad Money and Short Rates

Policy tightening resulted in a major monetary slowdown over 1973-75. With inflation continuing to surge, real money balances plunged and economies moved into recession.

The critical policy error occurred at this point. While money growth had fallen significantly, it remained high by historical standards and inconsistent with a full reversal of the inflation rise. Yet policy-makers performed another U-turn as recession unfolded, cutting interest rates as aggressively as they had raised them.

The result was that G7 broad money growth bottomed out above 10% in early 1975 and rebounded into 1976. Short rates were held at their lower level despite persistent high inflation and money growth remained above 10% until 1979.

What are the lessons for today?

While rate rises are only beginning, the view here is that there has already been a major “tightening” of policy in the form of the cessation of QE and shift to hawkish forward guidance. In the US, this is captured by a 210 bp rise in the Wu-Xia shadow fed funds rate between November and February. (The corresponding UK shadow rate has risen by an astonishing 10.2 pp since January 2021).

Consistent with this interpretation, annual broad money growth fell to an estimated 7.5% in February, with the three-month annualised rate of increase down to 5%.

With CPI momentum still rising, real money balances are now contracting and recession risk has risen. The real money squeeze, however, is mild compared with 1974-75.

On current trends, the monetary backdrop will soon be compatible with an eventual return of inflation to targets, although possibly not until 2024.

Central banks face opposing risks. If they raise rates in line with expectations, monetary trends could weaken further, causing unnecessary economic damage and a medium-term undershoot of inflation targets.

If they back off, however, money growth could stage a 1975-style rebound at a time when inflationary expectations are showing signs of becoming “unanchored”.

The judgment here is that the former risk is much greater.

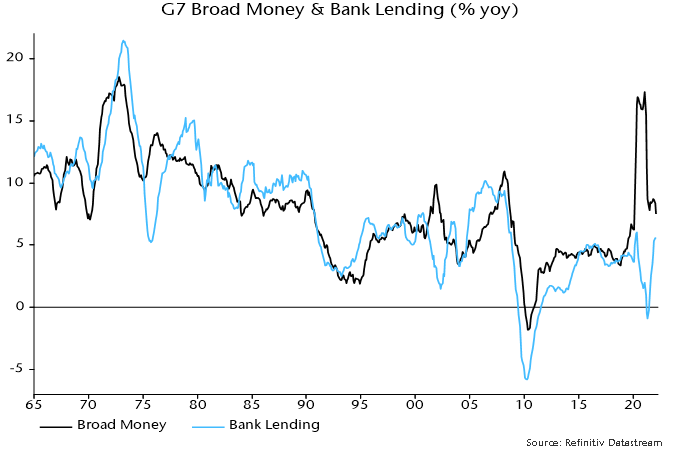
A key point is that high money growth in the 1970s reflected underlying strength in private sector credit demand. The 1974-75 rate cuts, therefore, resulted in a big rebound in bank lending expansion, which underpinned inflationary money growth – chart 3.

Chart 3

Chart 3 showing G7 Broad Money and Bank Lending

The 2020 surge in money growth, by contrast, was entirely due to QE (more precisely, monetary financing of fiscal deficits). Bank lending expansion has risen recently but is nowhere near the levels reached in the 1970s, or even the noughties.

The upshot is that money growth is unlikely to rebound strongly if central banks back off from rate rises – assuming no return to QE.

Policy-makers should monitor monetary trends and adjust their stance accordingly – in a dovish direction if the recent slowdown extends or hawkishly in the unlikely event of a reacceleration. Astonishingly, they continue to deny any linkage between the 2020 money growth surge and current inflation problems. Such denial is a recipe for more bad decision-making and 1970s-style economic volatility.

The ECB under former President Jean-Claude Trichet twice raised interest rates into oncoming recessions (in 2008 and 2011). The current ECB hasn’t raised rates yet but is scaling back QE much faster than was expected late last year.

The six-month rate of change of Eurozone real narrow money had turned negative before the 2008 / 2011 rate rises and subsequent recessions. It is about to do so again now.

In an eerie replay, M. Trichet yesterday gave an interview in which he opined that the Eurozone was “far from recession territory”.

The current ECB seems equally complacent. The staff forecast for GDP growth in 2022 was yesterday lowered from 4.2% to 3.7% but still incorporates quarterly increases of 1.0% in Q2 and Q3, i.e. a combined 2.0% or 4% annualised.

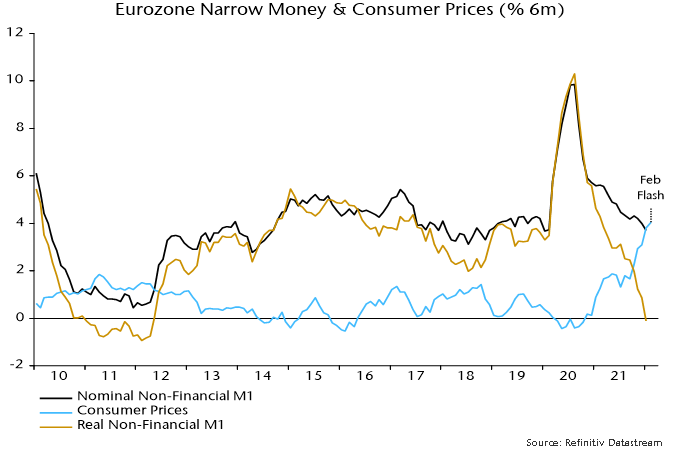
The “best” monetary leading indicator of Eurozone GDP, according to the ECB’s own research, is real non-financial M1, i.e. holdings of currency and overnight deposits by households and non-financial corporations deflated by consumer prices.

The six-month change in real non-financial M1 fell to zero in January and is likely to have been negative in February, based on a further increase in six-month consumer price momentum – see chart 1.

Chart 1

Chart showing Eurozone Narrow Money & Consumer Prices.

The six-month real narrow money change was negative in 18% of months between 1970 and 2019. The average change in GDP in the subsequent two quarters combined was zero. The average since the inception of the euro in 1999 was -0.8%.

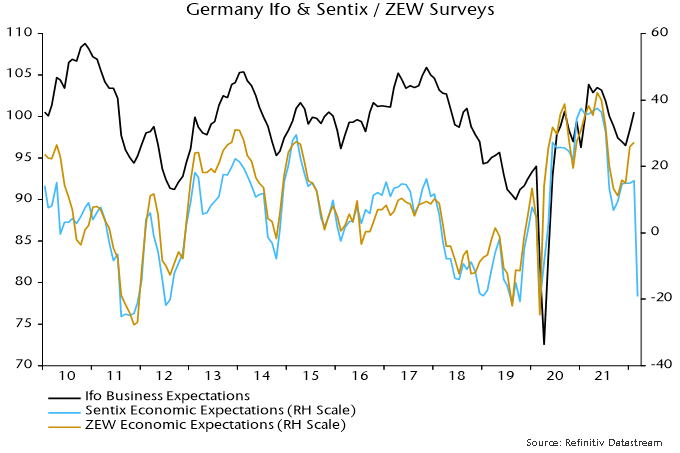
Business surveys could be about to crater: the March Sentix survey of financial analysts is ominous – chart 2. The ECB and consensus may portray weakness as a temporary response to Russia’s invasion of Ukraine, drawing a parallel with past geopolitical events that had little lasting economic impact. Monetary trends suggest that a slowdown to stall speed was already in prospect and the Ukraine shock may tip the economy over into recession.

Chart 2

Chart showing Germany Ifo & Sentix / ZEW Surveys.

The ECB is in a policy bind of its own making. The view here is that it is too late to tighten and the only option is to ride out the current inflation storm. The worry for policy-makers is that inflation expectations will become “unanchored”. Fake hawkish rhetoric backed by fantasy GDP forecasts may be their attempted escape route.

Shanghai skyscrapers

The Chinese economy has undergone major changes over the past year, aimed at stabilizing the long-term sustainability of its economy. We discussed many of these changes in our commentary, Navigating through current China uncertainties (and opportunities). Looking ahead, we will continue to carefully analyze the movement of Beijing’s policies, which provide key insights into the economy and financial markets this year.

Based on our analysis and interactions with companies, we anticipate a better second half of the year, and history has shown us similar behavior.

Regarding the property sector, in the first two months of 2022, sales in the top 30 cities declined 29% year-over-year (YoY), making it the second worst year since the start of the decade. Sales for 200 developers in lower tier cities dropped 43% YoY.[1] Falling property prices are often an indicator of a drop in land values, which directly affects local governments, as it is an important source of revenue. 

If we recall the last property down cycles in 2011-12 and 2014-15, they lasted around 9 months. As the current down cycle started in September-October, best case scenario would be improvements starting in the second half of 2022. During the first half, most indicators will continue to look very bad, and developers may face problems.

What can the government do then to improve sentiment?

Real estate and credit growth have always been key metrics for GDP expansion in China. Further, previous down cycles could guide government action. For example, the government could turn to a more easing mode, similar to actions taken in 2012 and 2015. As a result, we could see growth of new housing starts to bottom. That said, we don’t expect a massive easing in the property market, unless situation spreads very widely.

In the second half of 2012, Chinese policy makers released a set of stimulus measures. While each of these measures differ, it is similar to what’s been happening in 2022. In 2012 policy makers were reluctant to loosen measures and reiterated the idle land policy: a 20% penalty if idled for one year and forfeiture if idled for two years. The policy makers wanted to test the market and see results with gradual easing.

In March of 2015, minimum down payment was reduced to from 60% to 40% for second time home buyers who have still not paid the first mortgage. For first time buyers the down payment was reduced from 30% to 20%. State Council meeting was held on Dec 14th and analyzed the urban planning for 2016. Key focus was to reduce real estate inventory deepening urbanization.

 In 2022, we think policy makers have the tools to do similar easing, although, considering last year’s common prosperity, the willingness to do so is likely a little more difficult.

Many cities are easing mortgage lending (e.g., Guangzhou), lowering down payment rates (e.g., Heze, a third-tier city in Shandong province), or relaxing home purchase restrictions (e.g., Zhengzhou). China will also make it easier for state-owned enterprises (SoE) to buy distressed assets for private peers in order to avoid a credit crunch in the sector. For example, SoEs acquiring distressed assets will not be majorly subject to the three red lines policies. Likewise, some developers are being allowed to issue bonds in onshore markets.

The last Politburo meeting in December had a clear message: policy makers would shift from regulatory tightening to supporting growth. We believe China will defend around 5.5% growth (announced last week in NPC meeting) and considering mounting growth pressures, the current property tightening mode should shift to a gradual easing, similar to 2012 and 2015. Top leaders have declared their intention to double the Chinese economy from 2020 to 2035, which implies a minimum 4.7% CAGR growth.

The main pillar of this relaxation cycle was understanding the change of policy makers from December 2020 (regulatory tightening) to 2021 (stability). What policy makers state at the beginning of the year is the most important message for understanding further actions. The latter meant that most probably regulation in many sectors has peaked. Chinese policy makers are extremely careful in making the best they can in order to fulfil their guidelines.

Together with property initial reactions, credit impulse is has also seemed bottoming up.  In January, credit figures came in better than expected. Total Social Financing was RMB 6.2 trillion (consensus 5.4 trillion) and credit growth expanded from 10.3% YoY) to 10.5% YoY.[2] This is part of the initiation of a more deep easing cycle.

Is it time to leverage the economy again?

It could be, if you consider the messages out of the yearly Politburo meetings. In 2019 it was all about deleveraging. Why? Because GDP growth was not an issue. In 2022, stability is the main concern, which implies that GDP growth is a target. Government bond issuance and short term corporate lending have picked up substantially (especially the latter) in January. 

In addition, on January 20th, China lowered its benchmark loan rate, or Loan Prime Rate (LPR), from 3.8% to 3.7%. Meanwhile, the 5-year LPR was also lowered by 5bps to 4.6% in December (a small move but this rate is linked to the property sector). On Monday of the same week the one year Medium Lending Facility (MLF) rate was lowered 10 bps. Again, not a relevant move but the importance was the signal considering it was the first move since April 2020. The MLF cutting cycle is also the 5th decrease since the global financing crisis. China will also enter in a divergence driven by its easing and the tightening on the FED. The latter could make some pressure over the Yuan over time which can eventually anticipate some further easing measures.

Another factor that can boost China’s economy this year is Infrastructure investment, which could accelerate in 2022, considering fiscal policy has ample room to turn from contraction to expansion. Fiscal deficit was solely 4.5% of GDP (vs 6.5% expected at the beginning of the year) rolling over more than 3 trillion for 2022 spending, although policymakers should lose the controls on local government debt.

Regarding consumption, the disposable income from Chinese families has been affected by current economy slowdown, however the greatest negative impact from consumption is Zero Covid policy. As long as this measure doesn’t change it will be very difficult for consumption metrics to improve. History has shown us that consumption growth has been quite stable in the past, with low volatility. This implies that any change in Zero Covid, can bump consumption in a great extent. Most likely it will be gradually changed to more targeted measures (not locking down entire cities), nevertheless we don’t expect the complete elimination of the policy until at least the National Congress of the Chinese Communist Party this fall.

China’s top scientist Zeng Guang recently declared that China and Covid could coexist.[3] This is an important signal for an eventual turning point of Beijing to open the door to more discussions in following periods.

Despite the sluggish current economy we are overweight in China our emerging markets (EM) Small Cap Portfolio. Our approach is to invest in companies/sectors that are subject to less regulation and more likely to benefit from the new trends that we see emerging in the future.

Zhou Hei Ya (1458 HK)

We have recently initiated a position in Zhou Hei Ya (ZHY) in our Global Alpha Emerging Markets Small Cap Strategy. Our global and international small cap strategy do not invest in this country. ZHY is a leading braised food company in China and their main products include packaged duck products, such as duck necks and wings.

The brand is originally from Wuhan and is particularly strong among many cities in the country. ZHY is the first company in China to introduce MAP, which makes it possible to store braised food for up to seven days in a chilled environment. In the past, braised food products had to be unpackaged and consumed within the same day, hence it could only serve dining demand. MAP technology makes it much easier for people to consume braised foods on a variety of occasions.

China’s casual braised food industry reached a market size of RMB 109 billion in retail sales as of 2020, growing at a 16% CAGR over 2015-20. According to Frost & Sullivan they should continue increasing at similar pace, reaching RMB 205 billion in 2025. The main reasons for this increase are: increasing repurchases, a recovery in traffic post Covid-19, growing all-day snacking demand, and a convergence of consumer behavior in low-tier cities vs. top-tier cities.

ZHY has a highly standardized and scalable operating model. In 2019 it installed a franchisee model that will very likely speed up growth. ZHY has superior store unit economics (self-operating and franchisee stores take two to three months to breakeven), distinctive brand positioning, high stickiness, and are popular among the younger population It has been severely affected by Covid, but store openings are intact. We see strong potential for store expansions throughout China, fostering earnings and margins growth. Post Covid-19, we believe consumers will prefer more quality, healthier products. ZHY’s packaged products are perceived as safe and cleaner products vs. unpackaged ones. In summary, after a very tough 2021 and a difficult first half of 2022, we are starting to see some light at the end of the tunnel. The messages from policy makers have been key to understanding the direction of the Chinese economy during the year. Although every year has its own particular characteristics, we see some historical patterns that are showing similar signals in 2021- 2022. As Mark Twain stated, History Doesn’t Repeat Itself but it often Rhymes. The current Russia/Ukraine conflict and its implications on the Chinese economy are risks we are closely monitoring.


[1] Source : Macquaire

[2] Source: Bloomberg and Macquaire

[3] China Should Eventually « Co-Exist » With Covid, Says Top Scientist (ndtv.com)

Global real money trends were signalling economic weakness before Russia’s invasion of Ukraine. The consequent spike in commodity prices threatens a recession warning signal.

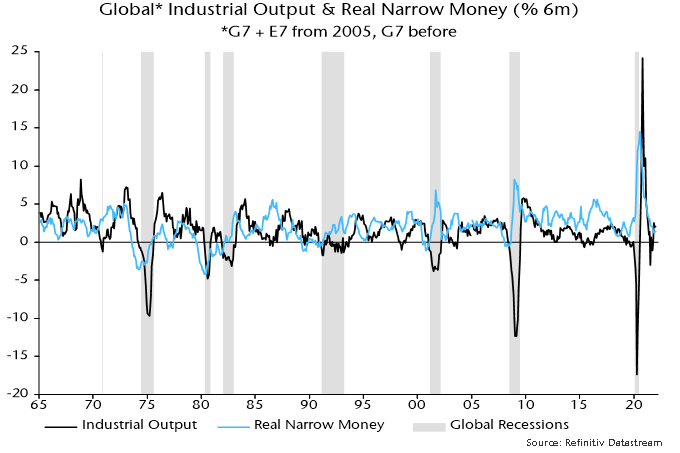
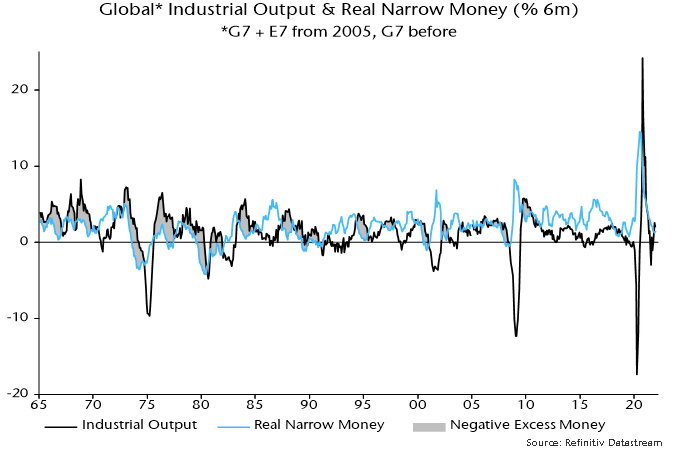
Global six-month real narrow money growth – the key monetary leading indicator followed here – turned negative before the six global recessions preceding the covid shock – see chart 1. The covid recession was not a genuine cyclical contraction because it was caused by a government shutdown of economic activity rather than endogenous spending weakness.

Chart 1

Chart showing Global Industrial Output & Real Narrow Money.

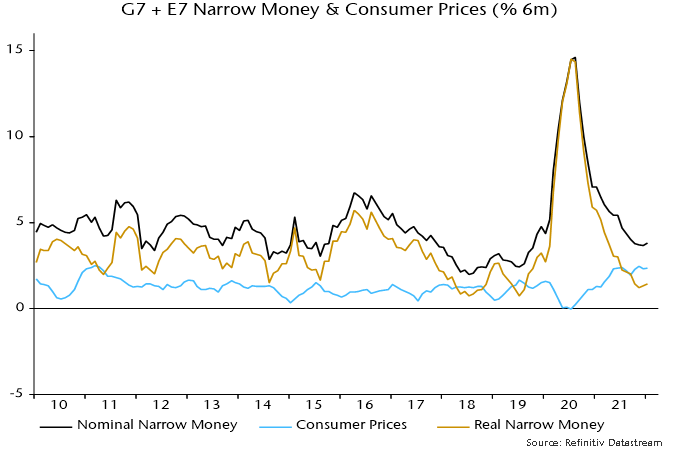
With most data now in, six-month real narrow money growth was an estimated 1.4% (not annualised) in January. This decomposes into nominal money growth of 3.8% and six-month consumer price momentum of 2.3% – chart 2.

Chart 2

Chart showing G7 + E7 Narrow Money & Consumer Prices.

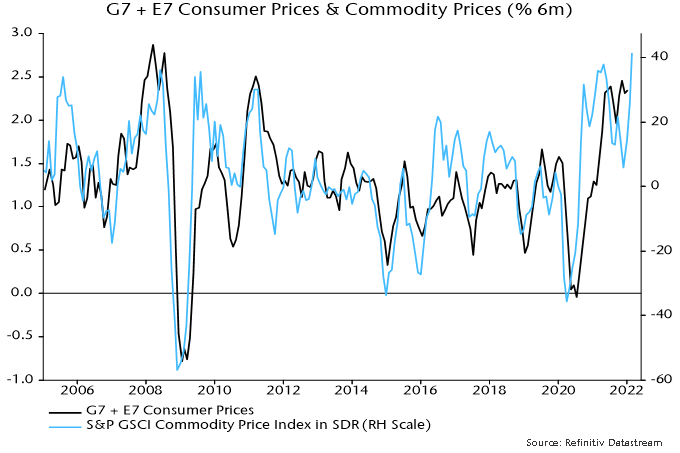
CPI momentum seemed likely to moderate before the invasion, based on a slowdown in the six-month change in commodity prices into December – chart 3. The latest spike suggests renewed upward pressure. A reasonable expectation is that the six-month CPI change will match the 2008 peak of 2.9% if commodity prices remain at current levels.

Chart 3

Chart showing G7 + E7 Consumer Prices & Commodity Prices.

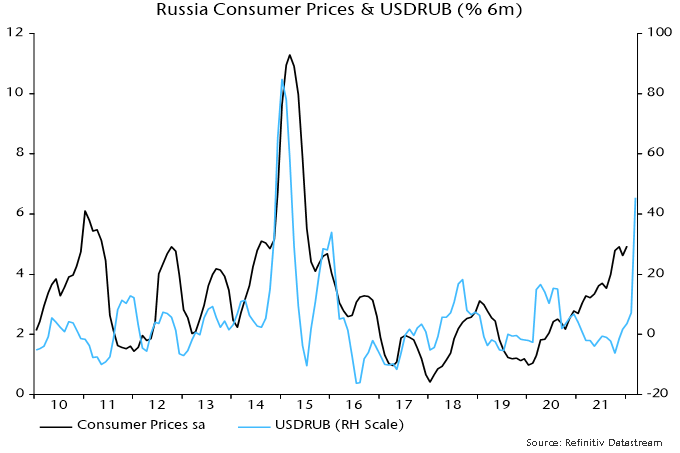
The global inflation measure, however, will receive an additional boost from a surge in Russian consumer prices due to the rouble’s collapse. Russian six-month CPI momentum was 4.9% (again, not annualised) in January but could rise to 15-20% – chart 4. Admittedly, a larger rouble fall in 2014-15 was associated with a lower six-month inflation peak of 11.3% but the depreciation then was driven by oil price weakness, which had an offsetting effect. Russian energy prices could decline as international buyers switch to other suppliers leading to a domestic glut, but any fall is unlikely to be as large as in 2014-15, while sanctions and consequent shortages may put upward pressure on other items.

Chart 4

Chart showing Russia Consumer Prices & USDRUB.

Russia has a 4% weight in the G7 plus E7 measures calculated here so a 10-15 pp rise in six-month CPI momentum from the current level would push up global CPI momentum by 0.4-0.6 pp.

The combined effect of the commodity price spike and rouble collapse, therefore, could be to boost global six-month CPI momentum by 1 pp or more. A slowdown in six-month nominal money growth of 0.5 pp would then be sufficient for real money growth to turn negative. A slowdown of this magnitude, or greater, is plausible on the basis of QE tapering and rate rises to date, without factoring in widely expected (but unwise) future policy tightening.

A further rise in global six-month CPI momentum – if the above scenario proves correct – may take several months to play out so a recession warning from real money might not be received until well into Q2.

Australian fifty dollar bill

On February 21st, Australia finally reopened its border to international travellers after two years of being fully closed. One of the strictest travel bans of the COVID era, at one point more than 30,000 Australians were unable to access the country due to the limited amount of people allowed to return home every month.[1] The Australian government was not afraid to make a public example out of a certain tennis player to show how no exceptions would be made. Nonetheless, it slowly started showing signs in 2022 that it would shift from its strict zero-COVID strategy and instead hinted that it would follow the steps taken by the UK and other western countries to figure out how to live with the virus.

One of the biggest casualties of its zero-COVID strategy will be the end of its streak as the longest period of economic growth in modern history. Australia was able to navigate the Asian financial crisis, the dot-com bubble, the great recession of 2008, and a once-in-a-generation mining boom that ended in 2014 without experiencing a recession. Even after 30 years of continued growth, it took an almost complete shutdown of international trade to pull the Australian economy back into a recession. For the record, it was still a less severe downturn than almost every single country in the world except China experienced.[2]

Despite the end of this streak, Australia retains most of the growth drivers of the last 30 years. The strength of its consumers remains in solid shape thanks to government support, upward wage pressure due to a labour shortage, significant household savings, and the safety of the strong pension benefits. Australia’s geographic location places them in a unique position to benefit from the growth in Asian consumer spending power. Its abundant natural resources, especially its mining industry, are resilient and should benefit from an inflationary environment, and what many expect to be the start of a commodity super cycle.[3]

People more pessimistic about the Australian economy will usually point to its dependence on China as a trading partner. The trade war between the two nations was escalated to the World Trade Organization (WTO) in 2021 over tariffs that China implemented in 2020 on Australian products such as barley, coal, cotton, logs, meat and wine. This was the result of Australia’s previous criticism of China’s human rights record and the decision to ban Huawei from the country, in addition to other grievances formulated toward the Chinese government. While it is true that China always represents a risk to the Australian economy, representing roughly 40% of their good exports, this misses the dependence China has on some Australian commodities. Unsurprisingly, their largest export, iron ore, was not part of the tariffs China imposed on Australia. The Chinese government knew very well how difficult it is to find other sources of the same scale as Australia. Furthermore, as China was facing a coal shortage in October, it resumed letting Australian coal ships access their port after being banned since December 2020.[4] Although, strong political rhetoric between the two countries is expected to continue, it is unlikely that economic relations will get much worse in the short term.

It is also worth noting that the country’s reputation as being an economy dependent on natural resources is often exaggerated. Like Canada, Australia’s stock markets tend to move along with commodity prices. But the reality is that much like other developed markets, Australia’s economy is dominated by the service sector. Representing more than 70% of GDP, almost 80% of its labour force and 40% of its export earnings, its expertise range from energy and mining-related services to banking and fintech.[5] Outside of the tourism industry, the impact of the travel ban and other COVID measures had a limited economic impact as evidenced by the unemployment rate increasing only 1.45% between 2019 and 2020.[6]

Global Alpha enjoys the exposure to various names in the Australian services industry.

ALS Ltd (ALQ AU)

Based in Brisbane, ALS is one of the world’s largest testing providers of laboratory analysis services, offering assessment, inspection, certification and verification. They operate out of 350 sites across 65 countries and across three segments: life sciences, commodities and industrials. The new management is in the process of solving many business inefficiencies to improve margins and their growth profile to be more sustainable. ALS should be a clear winner from the exploding demand for commodities and the new project development that will result from it.

Bravura Solutions Ltd. (BVS AU)

Bravura Solutions provides web-based software products and SaaS to the wealth management and funds administration industries, primarily in the Asia-Pacific and European regions. With over 70 bluechip clients and $2.3t trillion in assets managed through its systems, it is a market leader with a sticky product that participates in an industry with increasing regulation and the need for outsourcing.

Smartgroup Corp Ltd. (SIQ AU)

Founded in 2001, Smartgroup is a leading provider of salary packaging, fleet management, share plan administration and payroll services based in Sydney. Quite popular in Australia, the concept of salary packaging involves an arrangement between employer and employees where certain items or benefits can be paid for out of your pre-tax salary, reducing taxable income and therefore tax payable. Their business model involves charging employers an admin fee for outsourcing this for an average of AUD$200 per employee every year. Their client base mostly includes entities that benefit from not having to manage this internally, such as not-for-profit, hospitals, governments, and universities.

Australia is a relatively small weight within our developed market benchmarks but a mix of its exposure to the Asian consumer, strong expected consumer and corporate demand, and a Federal election in May that could lead to more deficit expanding policies, should result in outsized growth in the years ahead. We are quite satisfied with the varied exposure we currently have there.


[1] Australia is ending its zero-covid strategy | The Economist

[2] Just four countries fared better than Australia (afr.com)

[3] June 10th 2021 GA commentary – Hot commodity

[4] China accepts stranded Australian coal as shortages bite, but unofficial ban on new orders remains (afr.com)

[5] The importance of services trade to Australia | Australian Government Department of Foreign Affairs and Trade (dfat.gov.au)

[6] Australia Unemployment Rate 1991-2022 | MacroTrends

Last week, Europe was stunned by sounds of explosions and gunfire. The most terrible scenario repeatedly articulated by military experts and security analysts over the past few months has materialized, as Russia has launched its full-scale invasion of Ukraine. War in Europe. These words seem so surreal and are so difficult to process. It is both a humanitarian catastrophe and a challenge of the democratic order. The stakes have not been so high since the World War II.

In these tragic moments, as much as our thoughts and prayers are with the Ukrainian people living hell on earth, our duty is to analyze and anticipate the impact on markets and ensure that our portfolios are best positioned to mitigate the effect of the unprecedented events.

On the surface, Russia’s importance to financial markets is uncertain. Ranked eleventh in the world by GDP, with a stock market accounting for less than 1% of global equities in 2021, its relevance could be hastily overlooked. On the other hand, Russia’s critical role in the energy market is well understood, as it is one of the largest producers, with around 12% and 17% of the global oil and natural gas output, respectively. Europe will suffer from this war as it sources almost a third of its energy mix from Russia, with some of the key natural gas pipelines passing through Ukraine.

The direct impact on our strategies is limited at this point:

  • both our global and international small cap strategies do not invest in Russia nor in Ukraine as they focus solely on developed markets
  • in our EAFE strategy, 55% of the allocation is in Europe
  •  in our global strategy, the allocation is approximately 25%
  • our names in the region are mostly concentrated in the western part of the continent (France, Italy, Germany and Spain), in Scandinavia and in the United Kingdom.

Unlike large capitalisation companies like Total which have big production facilities in Russia, the names in our portfolio do not derive much of their revenues from sales in Russia or Ukraine, and we do not expect them to be impacted by the sanctions being imposed due to the conflict.  In addition, most of the companies we own do not have operations in these two countries. The ones that do have operations in Russia or Ukraine do not anticipate significant disruption from the situation.

Here are a few examples of names we own in Europe:

  • Vienna Insurance Group AG has the largest exposure to Eastern Europe (62% gross premiums) mostly from Czech Republic, Slovakia, Poland, Romania. Ukraine is under remaining Central and Eastern Europe (along with Albania including Kosovo, Bosnia-Herzegovina, Croatia, Moldova, North Macedonia, Serbia). This represents 4.5% gross premiums.
  • DFDS is an integrated shipping and logistics company and has a couple of ferry routes in the Baltic States that border Russia (Denmark or Sweden to Estonia/Lithuania). In 2020 this region accounted for 9% revenues, but Russia sales exposure should be zero.
  • Palfinger AG is based in Austria and manufactures hydraulic lifting solutions, loading and handling systems for all interfaces in the transport chain. Its exposure to Russia is around 2%.
  • De’Longhi is an Italian household appliance manufacturer and distributor. The company has approximately 6% exposure to Russia and Ukraine after its acquisition of Capital Brands and Eversys.
  • Bucher Industries AG is an internationally operating Swiss engineering group. Revenue exposure to Russia is in the low single digit percentage. The group has two assembly and distribution plants in Russia that focus on the local market. The Kuhn Group plant relies on some Western technologies/components.  In Ukraine, the group has one distribution facility with approximately 30 employees. To minimize FX losses, the group reduced the relevant local cash levels at the beginning of the February. 
  • Autogrill is a leader in food and beverage at airports and on motorways and has a joint venture in Russia but its contribution is insignificant in the big picture.

We also took the time to review our holdings that, even though they are not located in Europe, could be impacted by the situation. For example, in the US:

  • Gentherm is a leading manufacturer of climate control seat systems with an Ukrainian facility.
    • Located on the far western side of Ukraine, very close to the Hungarian border, it is one of their premier facilities.
    • What did they do in 2014 when Russia invaded Crimea? Logistical planning, over built slightly in existing facility, plus prepared and reserved capacities at other facilities. These measures helped protect European customers, who are comfortable with the Ukrainian facility.
    • Can this benefit? Yes, currency under pressure, and cost of goods sold is in local currency in terms of content. In 2014 the name had a positive impact on performance.
  • Titan Machinery is the largest Case New Holland dealer in the US with 75 stores, mainly in the Midwest, it also has 20 stores in Eastern Europe (Ukraine, Romania).
    • Where is the facility in Ukraine?  It is located in the center of the country. Titan does not believe its assets in Ukraine are in jeopardy.
    • What did they do in 2014? Delayed further shipment of unsold equipment into the Ukrainian market, given the environment in this region. Once a customer purchases a piece of equipment, they ship it from Western Europe into Ukraine.

And from our investments in Asia:

  • Sales from Europe for our holdings in Asia range from 6% to almost 55%.
  • DMG Mori is the largest machine tool company both in Japan and the world. Almost 55% of its revenue come from Europe with the biggest part coming from countries part of European Union (35%) excluding Germany. The portion of sales coming from Germany is only about 20%.
  • Samsonite, the world’s largest lifestyle bag and travel luggage company, has 6.5% of its sales coming from Russia. The largest part of its sales comes from North America at 37% and Asia at 36%.
  • L’Occitane, a global manufacturer, marketer and retailer of organic and natural skincare and beauty products operates in over 90 countries and has over 3,420 retail locations. Approximately 3% of their sales are in Russia.

Russia’s exports are dominated by primary industries. Main exports are crude and refined petroleum, petroleum gas, coal and wheat. In 2020, Russia was the world’s largest exporter of oil & gas combined, the second-largest gas producer (17% global output) and the third-largest oil producer (12% global output). The metals and mining industry represents between 3%-5% of Russian GDP and the country is one of the largest exporters of nickel, palladium, aluminum, platinum, steel and copper.

The nature of the Russian economy means that the highest direct revenue exposure for European Capital Goods names comes from suppliers of products, software and services to the oil & gas, metals and mining sectors.  These include ABB, Sulzer, Siemens Energy, Epiroc, Metso Outotec, Sandvik and Danieli.  Other companies with 2-3% of revenues include Schneider Electric, Alfa Laval, GEA, Konecranes and Wartsila. Mostly large cap names not names that we own in our strategy.  At this time we believe our portfolio is well positioned but we will continue to monitor the situation closely.

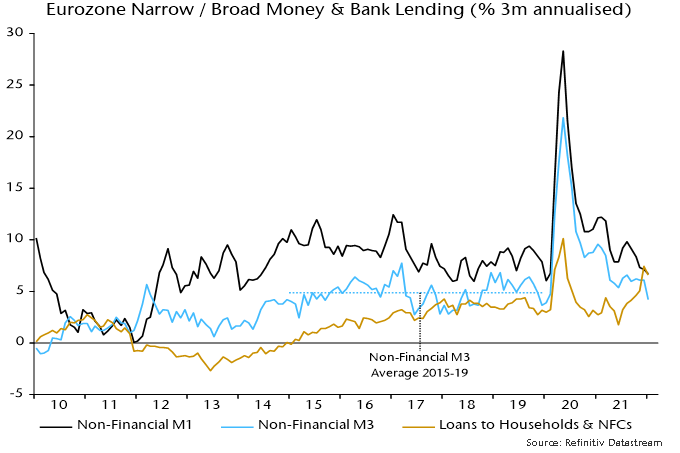
Eurozone monetary trends were arguing against ECB policy tightening before the negative shock of Russia’s invasion of Ukraine.

Three-month growth of non-financial M3* – the preferred broad money aggregate here – slowed further to 4.2% annualised in January, the lowest since January 2020 and below a mean of 4.9% over 2015-19, when CPI inflation averaged 1.0% – see chart 1.

Chart 1

Current high inflation reflects excessive money growth in 2020-21 and supply side disruption. It is too late for an ECB response. Any second-round effects will swiftly burn out if money growth maintains its recent subdued pace.

The broad money slowdown has occurred despite ongoing QE, raising the prospect of outright weakness when it stops. The hope is that money growth will be supported by private credit expansion, which has strengthened recently – chart 1. The suspicion here is that corporate loan demand has been boosted by restocking and will fade as this slows.

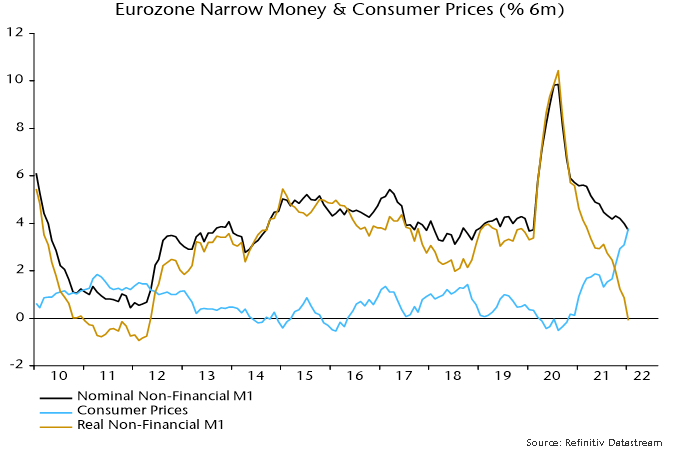
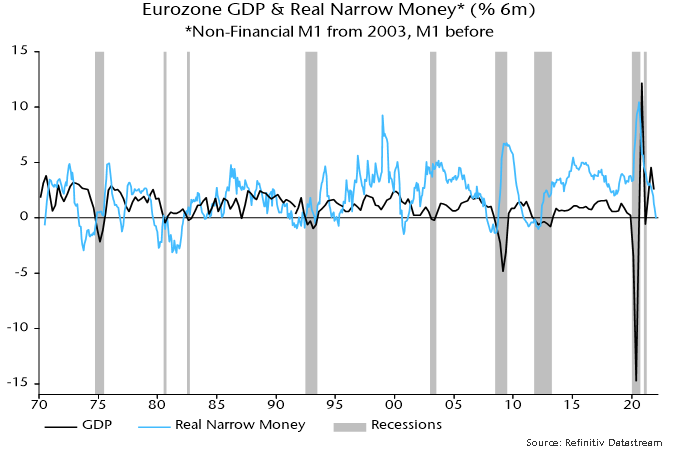
Growth of narrow money (non-financial M1) has also normalised while high inflation has pushed the six-month rate of change in real terms marginally into negative territory – chart 2. Negative readings preceded every recession over 1970-2019, although there were several false signals (e.g. 1994-95) – chart 3.

Chart 2

Chart 3

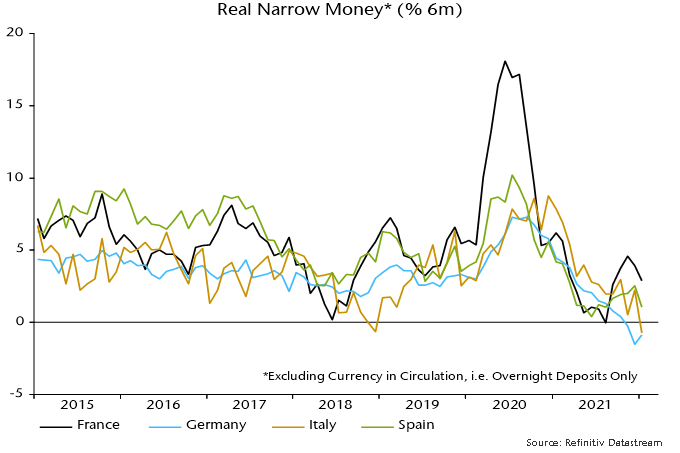
The six-month rate of change of real narrow money deposits is now negative in Italy as well as Germany, with France still showing relative resilience – chart 4.

Chart 4

*M3 holdings of households and non-financial corporations.

Dear Clients and Colleagues:

As the world transitions to green energy over the next 30 years, China must find short-term alternatives to their coal thermal plant problem, which represents 18% of total global carbon dioxide (CO2) emissions. 1

While it may seem like a contrary solution, China sees gas-fired power as the most realistic transitory solution until greener and grid friendly alternatives take scale. Gas has lower emissions than coal (50% less, oil is 25% less) and gas is more flexible than solar, wind, and even pumped-storage hydropower. It seems that China wants to import natural gas as fast as pipeline and LNG infrastructure is built. China’s pipeline gas volume surged 154.2% in 2021, to 7.54 million metric tons (mt). Natural gas imports (LNG) from Russia rose 50.5% year-over-year in 2021.2 Meanwhile, China LNG imports from the United States (U.S.) saw the biggest year-over-year jump, rising 187.4% to 9.21 million mt in 2021.3 

According to GlobalData, LNG liquefaction capacity is expected to grow by 70% over the next four years.3 China will add as much as 21.5 million mt/year of LNG receiving capacity in 2022, this from more than the 14 million mt/year added in 2021 for a total import capacity of 127 mt/year in 2022.1 Japan pioeneered LNG 60 years ago and recently fell in second place in terms of activity with 75 mt/year of LNG imports.4

Although the Chinese LNG import growth only absorbes world gas production by less than 1%, it is enough to pressure pricing upwards, especially since Europe and other regions try to curb thermal coal as well. Supply side dynamics are not helping either, as world rig counts are 45% lower than in 2015.5 Why so few? Oil and gas companies are shuffling with higher exploration costs, regulations and low labor availability.

Coming back to Japan, the country has low internal energy resources and imports 90% of its energy requirements. An important part of the country’s electrification is fuelled with LNG imports. Japan has the largest LNG capacity with 227 mt/year.4 As part of its CO2 emission targets, the country is trending towards a hydrogen strategy fuelled by renewables while reducing its LNG imports and nuclear power.

Iwatani (8088:JT)

Global Alpha owns Iwatani, the largest provider of LPG liquified propane gas, from importing to stove tanks. Iwatani provides an essential service throughout Japan, a country with very low penetration of utility style gas piping to the house. Although Japan’s LNG imports for electrification will decline, LPG will continue to be a key part of Japanese culture for cooking and heating especially in rural settings. Iwatani is also Japan’s only fully integrated supplier of hydrogen, with a nationwide network, including manufacturing, transportation, storage, supply, and security. It had 53 hydrogen stations in Japan as of 2021. Plans are to add 270 by 2030.

With plans to start exports by 2025, the west coast of Canada is set to benefit from the Asian LNG expansion. The energy shipped from Canada over to Asia is expected to offset up to 90 million tonnes of CO2 emissions in a single year. This is equivalent to shutting down 40 to 60 coal fired plants in China.7

ARC Resources (ARX:TSE)

Global Alpha owns ARC Resources, a Canadian energy company with operations focused in the Montney Resource Play in Alberta and northeast British Columbia. The company is best positioned with its gas assets to supply LNG requirements for Asian LNG exports. ARX is an industry leaders in terms of ESG with many initiatives regarding gas flaring and CO2 carbon capture.

Clean Energy Fuels (CLNE:US)

North American natural gas usage is also expected to increase in renewable growth as it is mixed with captured methane producing negative CO2 emission. For this Global Alpha owns Clean Energy Fuels, the largest network of retail natural gas distribution in the country.

China’s need for energy to fuel cars and electrify houses (and give them some benefit, to reduce thermal coal) has forced them to shut down many internally produced commodities that demand  high energy consumptions (as well as high CO2 emission) notably aluminium and copper smelters. China still needs these commodities and has reverted to the global trade market. If we add the change in habits brought on by COVID-19 that supported a rush for hard goods during the pandemic, this is the consequence.

With a high energy production input, shipping aluminum is basically shipping energy. 

Alumina (AWC:AU)

Global Alpha owns Australia’s Alumina, which owns 40% of the world’s largest alumina business, Alcoa World Alumina and Chemicals (AWAC), the recognized industry leader. Precursor to aluminum, the metal powder alumina is refined from bauxite. AWC owns alumina refineries, bauxite mines and aluminum refineries globally with a good concentration in Australia. Close to China, AWC Australia large operations present the lowest cost import option for China. As well, AWC sources all of its energy requirements from natural gas. AWC also has important ESG initiatives such as Mechanical Vapor Recompression (MVR) which turns waste vapor into steam.

If we consider the energy transition to renewables as a secular event, the trend has certainly affected commodity prices in addition to more typical demand and supply forces.

Have a nice week.

The Global Alpha team

1 https://www.statista.com/statistics/239093/co2-emissions-in-china/#:~:text=China%20released%2010.67%20billion%20metric,of%20countries%20where%20emissions%20increased

2 https://www.spglobal.com/platts/en/market-insights/latest-news/lng/012022-china-data-total-natural-gas-imports-rose-20-in-2021-on-strong-energy-demand

3 https://store.globaldata.com/report/global-capacity-and-capital-expenditure-outlook-for-lng-liquefaction-terminals-to-2025-north-america-dominates-global-capacity-additions-and-capex-spending/

4 https://www.statista.com/statistics/1285639/japan-share-lng-in-energy-production/

5 https://rigcount.bakerhughes.com/intl-rig-count

6 https://world-nuclear.org/information-library/country-profiles/countries-g-n/japan-nuclear-power.aspx

7 https://biv.com/article/2022/01/lng-canada-project-construction-kicking-high-gear

This report is provided solely for informational purposes and nothing in this document constitutes an offer or a solicitation of an offer to purchase any security. This report has no regard to the specific investment objectives, financial situation or particular needs of any specific recipient and does not constitute a representation that any investment strategy is suitable or appropriate to a recipient’s individual circumstances. Global Alpha Capital Management Ltd. (Global Alpha) in no case directly or implicitly guarantees the future value of securities mentioned in this document. The opinions expressed herein are based on Global Alpha’s analysis as at the date of this report, and any opinions, projections or estimates may be changed without notice. Global Alpha, its affiliates, directors, officers and employees may sell or hold a position in securities of a company(ies) mentioned herein. The particulars contained herein were obtained from sources, which Global Alpha believes to be reliable but Global Alpha makes no representation or warranty as to the completeness or accuracy of the information contained herein and accepts no responsibility or liability for loss or damage arising from the receipt or use of this document or its contents.

Source: MSCI. The MSCI information may only be used for your internal use, may not be reproduced or redisseminated in any form and may not be used as a basis for or a component of any financial instruments or products or indices. MSCI makes no express or implied warranties or implied warranties or representations and shall have no liability whatsoever with respect to any MSCI data contained herein. This report is not approved, reviewed or produced by MSCI.

Recent market weakness reflects an unfavourable monetary backdrop as well as negative geopolitical developments.

The monetarist view is that asset prices respond to imbalances between the supply of money and the demand to hold it. “Excess” money growth is associated with increased demand for financial assets and upward pressure on their prices, assuming no change in supply.

Excess money growth can’t be measured directly because the demand to hold money – based on current economic conditions and prices – is unobservable. Two proxy measures of global excess money are tracked here: the difference between six-month growth rates of real (i.e. CPI-deflated) narrow money and industrial output; and the deviation of 12-month real money growth from a slow moving average.

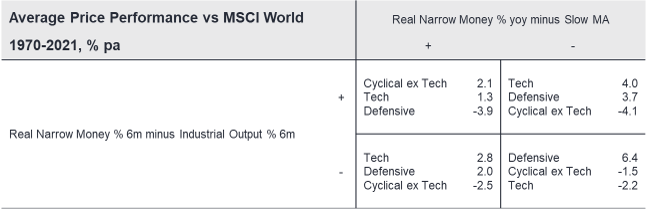
Historically, global equities outperformed cash significantly on average when both measures were positive but underperformed significantly when both were negative. Mixed signals were associated with a small return shortfall, i.e. no reward for assuming equity risk – see table 1.

Table 1

post in early January noted that the second measure had turned negative in October while the first appeared to have followed in November, based on partial data. This “double negative” signal was confirmed later in January.

A January estimate of global real narrow money is now available, along with a firm data point for December industrial output. Both excess money measures remain negative.

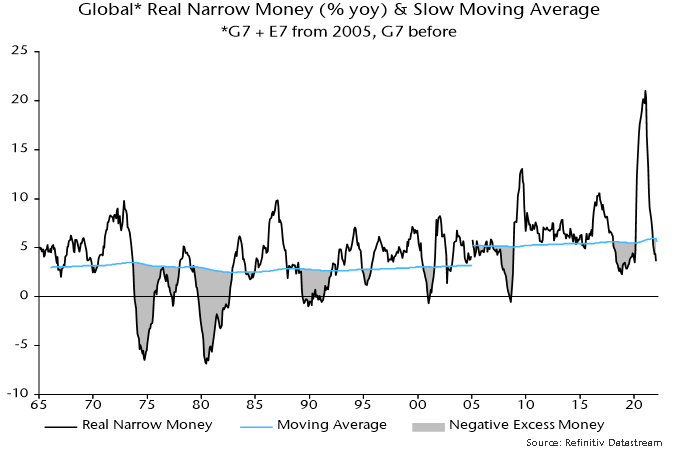
12-month growth of global real money is estimated to have fallen further below its moving average in January – chart 1. An early reconvergence seems unlikely – CPI inflation is probably peaking but a decline may be offset by a further slowdown in nominal money growth as large monthly increases a year ago drop out of the 12-month comparison.

Chart 1

Meanwhile, six-month real narrow money growth was little changed in January and below December industrial output growth – chart 2. Six-month output growth may stay at or above the December level through March: a temporary production catch-up is in progress as supply constraints ease, US output rose solidly in January and base effects are favourable (output fell between June and September 2021).

Chart 2

The excess money measures have also been correlated with sector relative performance historically, with double negative signals associated with strong outperformance of the defensive sectors basket (which includes energy) and underperformance of cyclicals, including tech (IT and communication services) – table 2.

Table 2