Bank of England Chief Economist Huw Pill has suggested that fiscal policy easing in the mini-Budget and the reaction in markets warrant a “significant monetary policy response”. Why? 

UK monetary trends continue to weaken and are consistent with a medium-term return of inflation to target, if not below. 

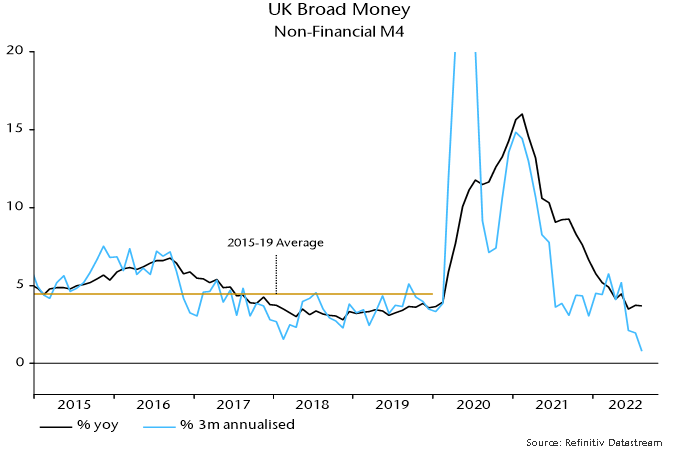
Annual growth of non-financial M4 – the preferred broad aggregate here, comprising holdings of households and private non-financial firms – was unchanged at 3.7% in August, below an average of 4.4% over 2015-19. The three-month rate of expansion fell further to just 0.8% annualised – see chart 1. 

Chart 1

Chart 1 showing UK Broad Money Non-Financial M4

Should the Bank tighten to offset the inflationary impact of exchange rate weakness? The “monetarist” view is that currency movements can delay or speed up the transmission of monetary changes to prices but have no longer-term inflation impact as long as money growth is stable. 

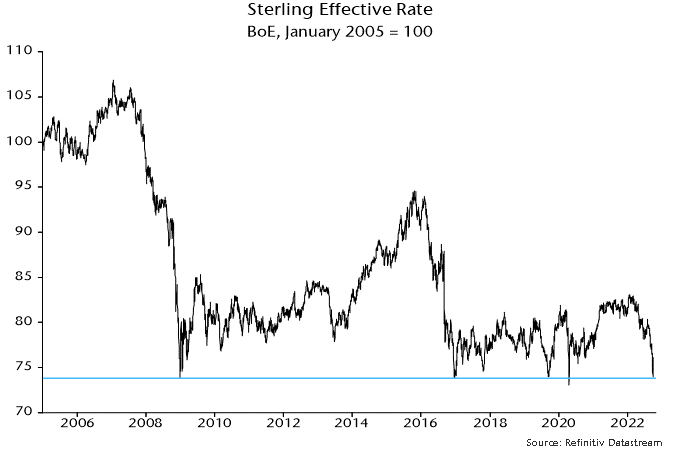
The sterling effective rate index was down by 10% on a year before at last week’s low point but the annual change reached -25% during the GFC and -19% after the Brexit referendum. The index hasn’t (yet) broken below its GFC low – chart 2. 

Chart 2

Chart 2 showing Sterling Effective Rate BoE, January 2005 = 100

The greater concern here is that increased government borrowing will be financed significantly through the banking system, resulting in another boost to money growth. This could occur via voluntary purchases of gilts by commercial banks in response to higher yields or because the Bank is forced to offer sustained support to a dysfunctional market. 

Such a scenario, however, is possible rather than likely. Any monetary boost from deficit financing could be offset or outweighed by a further weakening of private sector credit trends as banks pass on higher funding costs and widen spreads. 

The Bank would have made better recent decisions if it had paid attention to monetary trends: it wouldn’t have expanded QE in November 2020, would have raised rates earlier in 2021 and wouldn’t have embarked on QT. Current monetary weakness argues against policy tightening. The Bank may judge it necessary to hike rates to bolster its credibility, and that of the wider UK policy-making framework. Bank officials, however, should avoid inflating market expectations and be prepared to reverse increases if markets calm and – as seems likely – money trends remain soft.

Revised numbers confirm that US GDP fell by 0.6% (1.1% annualised) between Q4 2021 and Q2 2022*. Hours worked in the private sector economy, meanwhile, climbed 1.1% (2.2% annualised) over the same period. What explains this disconnect and how long can it continue? 

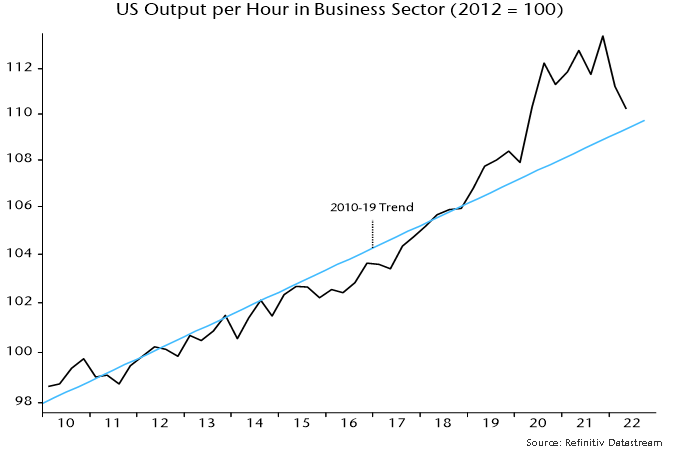
The ”explanation” here is that economy-wide productivity was pushed far above trend by the pandemic but has been normalising this year. The reversion to trend appears complete, suggesting that labour market data will reflect output weakness going forward.

Output per hour in the business sector surged in the initial stages of the pandemic in Q2 / Q3 2000, opening up a gap of more than 4% with the prior trend – see chart 1.

Chart 1

Chart 1 showing US Output per Hour in Business Sector (2012 = 100)

Firms responded to economic contraction by laying off lower-productivity workers, boosting the average. Output returned to its pre-pandemic level in Q2 2021, requiring these jobs to be refilled. A fall in participation (due to age demographics) coupled with supply / demand mismatches slowed the rehiring process, resulting in output per hour remaining elevated until recently.

The deviation from trend had narrowed to below 1% as of Q2.

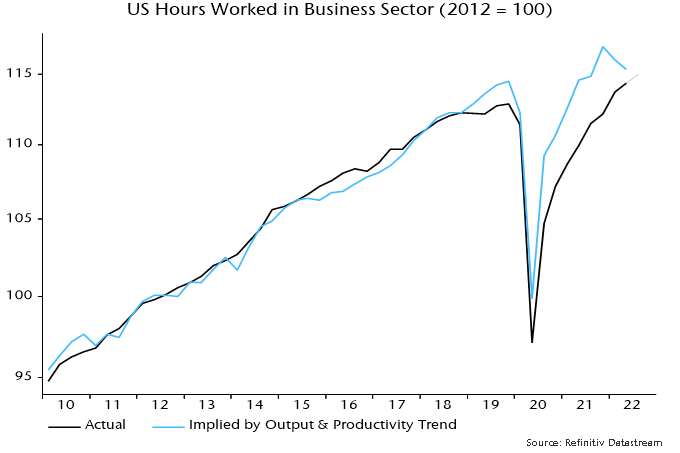
Another way of presenting the data is to compare actual hours worked in the business sector with the number implied by the current level of output, assuming that productivity had continued on its pre-pandemic path – chart 2.

Chart 2

Chart 2 showing US Hours Worked in Business Sector (2012 = 100)

A big deficit had opened up by Q2 2021 but strong employment growth and an output set-back have narrowed the gap. Monthly data through August suggest that hours worked rose solidly again in Q3 and may have converged with the output-warranted level.

With productivity back or close to trend, the GDP / employment divergence is likely ending.

The productivity trend implies that hours worked will fall if GDP rises by less than 0.2% (0.8% annualised) per quarter. Real narrow money has been contracting since January 2022, suggesting further GDP declines in Q4 / H1 2023. Labour market data may be poised for imminent deterioration.

*Gross domestic income – GDP measured from the income side – rose by 0.2% (0.4% annualised) over the same period.

Sydney skyline at twilight, with the Sydney Opera House and Harbour Bridge.

Last week, Fedex released their latest reported earnings, depicting grim views of the economy. As a result of the weak quarterly numbers, its CEO to predicts the coming of a recession. Following what could can be defined as the great Covid-related delivery boom, Fedex’s harsh predicted slowdown is understandable.  

Recession thesis accepted, not all sectors and geographies are created equal and understanding the intensity of the recession is an important factor. Let’s look at country level numbers; the following results for the one-year probability of a recession were recently as disclosed in Bloomberg: China 20%, Australia 25%, Japan 30%, Hong Kong 30% US 50%, UK 60%, France 50% and Canada 40%. As data continues to appear, these numbers may prove conservative on the odds of a recession happening, they could however be insightful to find less affected geographies.  

With low inflation and low yen, it’s understandable why Japan can be seen as a favorable defensive jurisdiction.  We should add low valuations for its equities as well. But why is a country like Australia even lower on the recession risk? In fact, if put together Japan and Australia represent 42% of our EAFE developed markets universe and offer a defensive position as we cycle into recession.  Let’s look a bit more why Australia is faring better than other regions. 

The Reserve Bank of Australia is in the midst of its sharpest tightening cycle in a generation, having raised rates by 2.25 percentage points since May. But it’s now approaching a neutral rate, potentially allowing it to return to smaller, quarter percentage-point moves. That compares with the US Federal Reserve, which may deliver a third straight three-quarter-point increase later this month. 

Australia has also been a rare beneficiary of fallout from Russia’s invasion of Ukraine as disruptions to commodity and energy supplies have sent coal and other prices soaring. The nation posted a record-high monthly trade surplus this year fueled by sales of coal, iron ore and liquefied natural gas. 

Australia has had a tailwind from trade that other countries just don’t have. The export of LNG and coal have been highly beneficial. Unusually, the surge in export prices isn’t being reflected in Australia’s commodity-linked currency, which has averaged 69 US cents over the past three months. A lower currency swells profits from commodity exports priced in dollars and makes the country more appealing to overseas visitors and students.  

Australia’s employment-to-population ratio is near a record high as is its participation rate — both much stronger than many other countries — highlighting the underlying momentum in the labor market. Job vacancies also remain elevated, suggesting that strength will persist. 

Australians still have plenty of savings to tap into to support consumption, having built up a large amount of cash from fiscal stimulus delivered during Covid lockdowns when there were few options to spend.  

If we look at our holdings in Australia, we are able find companies with world class expertise. As an example, with its vast amount of resources, Australia has very large resource extraction complexes that have trained the most capable pool of experts in material transformation at large scale. 

Alumina (AWC:AU) 

Global Alpha holds Alumina, part owner of the world’s largest alumina business which is the main ingredient to produce aluminum. Most of the alumina produced by company is exported to China. Its Middle East competition better serves the European continent. Although the aluminum/alumina markets weaken during a recession, German aluminum facilities could suffer the most under a gas rationed winter of the Russian war. Alumina is also the lowest cost producer globally and produces the greenest alumina (gas vs coal powered). The company offers a 10% dividend yield and aluminum remains a key component of the climate change infrastructure, automotive as well as the rebounding airline industry. 

Furthering our aluminum discussion, we turn to a pop culture question: aluminum cans versus plastic and glass bottles. We all know for taste it goes glass, can, then plastic. Glass is great, but is expensive to transport and recycle. Aluminum cans are therefore the winner in terms of logistics, recyclability, and carbon footprint. 

Orora (ORA:AU) 

We own Orora, the largest producer of aluminum cans for soft drinks in Australia and New Zealand. The company’s facilities are strategically positioned beside its clients and has pass through agreements with clients on material cost fluctuation. Historically, soft drink consumptions only slightly declines during a recession. Further, Orora clients have indicated 5% yearly growth on capacity requirements for the next several years. There is also leverage in the model as capex is added to existing facilities providing great return in investment. Its dividend yield is above 5% in addition to its growth profile. Although both Alumina and Orora are in the materials sector, Orora has very low commodity exposure providing it with more of a staples profile.

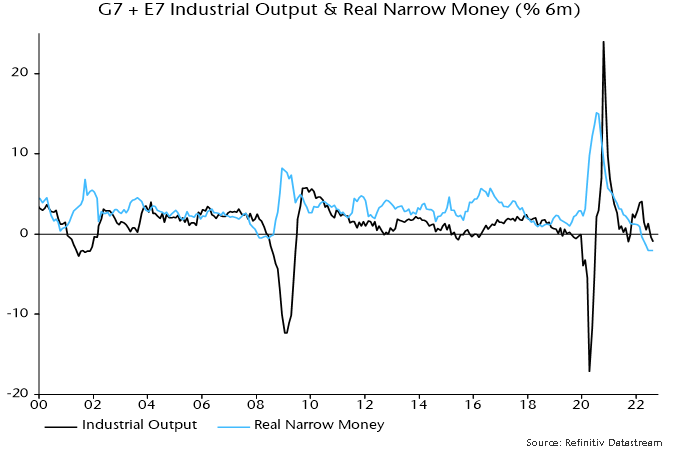
Global six-month real narrow money momentum, the key economic leading indicator in the forecasting approach employed here, is estimated to have moved sideways in deep negative territory in August* – see chart 1. Allowing for an average nine-month lead, the suggestion is that an incipient global recession will extend through Q2 2023, at least. 

Chart 1

Chart 1 showing G7 + E7 Industrial Output & Real Narrow Money (% 6m)

More specifically, global six-month industrial output momentum, which crossed below zero in July and is estimated to have weakened further in August, may continue to fall into April / May next year, with no monetary signal yet of a subsequent slowdown in the pace of contraction. 

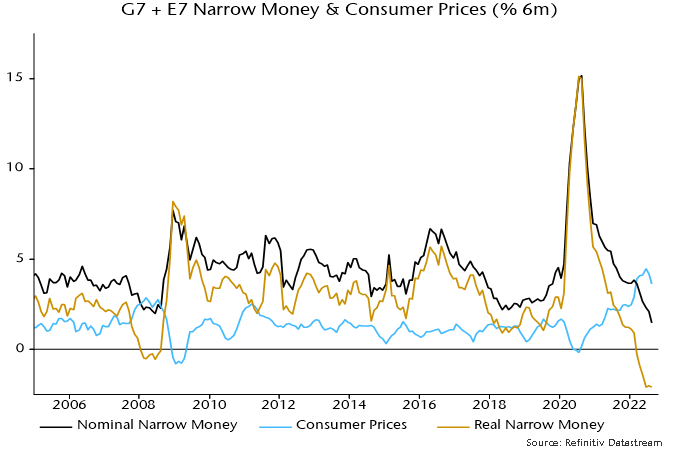
The lack of recovery in real narrow momentum is disappointing since, as previously discussed, global six-month consumer price momentum pulled back in July / August. This slowdown, however, was offset by a further fall in nominal money expansion – chart 2. 

Chart 2

Chart 2 showing G7 + E7 Narrow Money & Consumer Prices (% 6m)

Nominal money weakness, encompassing broad as well as narrow aggregates, is evidence that monetary policies were already over-restrictive before the latest round of hair-shirt rate hikes. 

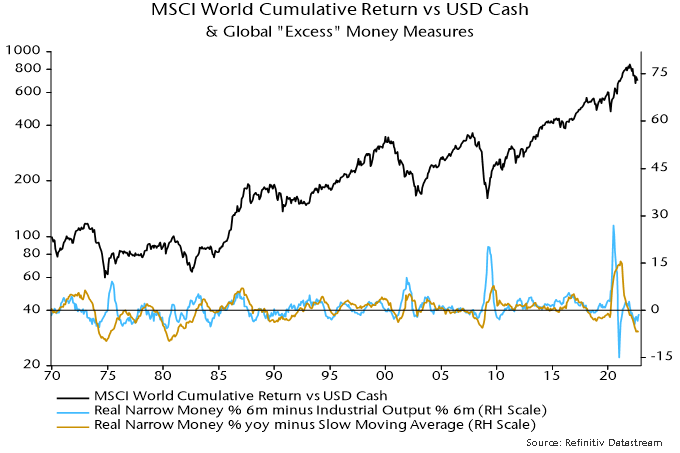
What does this monetary backdrop imply for markets? The two measures of global “excess” money calculated here, i.e. the differential between six-month real narrow money and industrial output momentum and the deviation of 12-month real money momentum from a long-term moving average, remained negative in August – chart 3. 

Chart 3

Chart 3 showing MSCI World Cumulative Return vs USD Cash & Global “Excess” Money Measures

Historically (i.e. over 1970-2021), global equities outperformed cash on average only when both measures were positive, with underperformance greatest when both were negative. 

Previous posts suggested that the first measure would turn positive during H2. This remains possible despite the disappointing August monetary data: the measure has recovered since June as industrial momentum has fallen and output may soon be contracting at a faster pace than real money. 

The second measure, however, is likely to remain negative until well into 2023: 12-month real money momentum weakened further in August and the long-term nature of the moving average implies that it will make little contribution to closing the current wide gap.

The projected development of the measures, i.e. the first crossing back above zero but the second remaining negative, would suggest a slowdown but not reversal in the bear market in late 2023. 

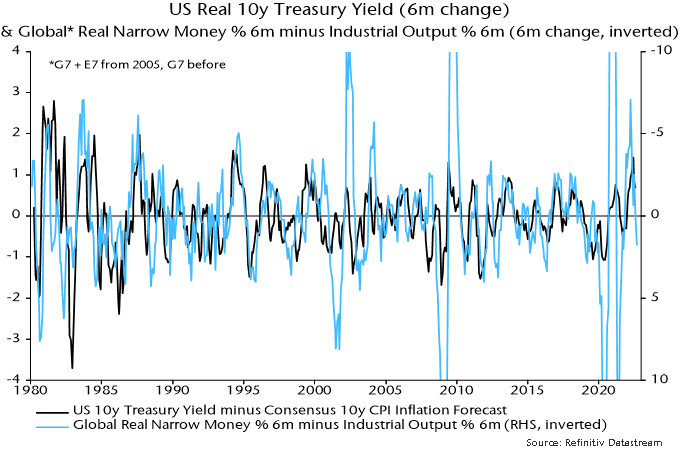
The message for government bond markets is more hopeful. Changes in bond yields have been inversely correlated with changes in the first excess money measure historically, i.e. bonds have, on average, rallied when the measure has risen, even while it has remained negative – chart 4**. 

Chart 4 

Chart 4 showing US Real 10y Treasury Yield (6m change) & Global* Real Narrow Money % 6m minus Industrial Output % 6m (6m change, inverted) *G7 + E7 from 2005, G7 before

The six-month change in the excess money measure turned positive in August, having been negative – implying an unfavourable monetary backdrop for bonds – between November 2021 and July. US 10-year Treasuries have outperformed cash by 4.2% pa on average historically following positive readings. 

*The estimate incorporates monetary data covering two-third of the aggregate and complete CPI results.

**The change in the measure is plotted inverted in the chart.

Warren Stoddart, président et chef de la direction du Groupe financier Connor, Clark & Lunn, s’est récemment joint à Chas Burkhart, chef de la direction de Rosemont, à titre d’invité au balado Global Investment Leaders. M. Stoddart nous fait part de ses réflexions à propos de l’évolution du Groupe financier CC&L pendant ces quatre dernières décennies, alors que la croissance des activités la transformaient en une société mondiale de 100 milliards de dollars, et de ce qui attend la société à l’avenir.

Dans cet épisode, il se penche sur les changements qu’a connus la société au fil des ans et qui ont fait du Groupe financier CC&L l’une des plus importantes sociétés de gestion d’actifs détenue par ses employés au Canada. Il souligne que, lorsqu’il a commencé dans la société, il existait plusieurs sociétés très importantes détenues par leurs employés. Une par une, elles ont toutes échoué ou ont été rachetées. Chas Burkhart et Warren Stoddart discutent des nombreuses difficultés qui entourent le maintien de la croissance dans une société dirigée par ses employés, en particulier en matière de planification de la relève, au sein du Groupe financier CC&L et de ses sociétés affiliées.

« Nous savons que l’entreprise est plus grande et plus complexe et qu’elle a besoin de connaissances plus spécialisées dans certains domaines, » a affirmé M. Stoddart. « La prochaine génération de leaders de l’entreprise sera plus nombreuse qu’actuellement. Et ils vont se concentrer sur différents domaines – le marketing et le développement de produits étaient presque une réflexion après coup il y a 20 ans, mais c’est une partie importante de ce que nous faisons aujourd’hui. »

Cette complexité s’explique en partie par la croissance des marchés privés, des placements non traditionnels, des actifs mondiaux et des clients mondiaux : Il y a 15 ans, presque tous les revenus et les actifs du Groupe financier CC&L provenaient de caisses de retraite canadiennes qui investissaient dans des actions canadiennes. À peu près à cette époque, la société a effectué sa première incursion dans les marchés privés avec un projet hydroélectrique de 150 MW en Colombie-Britannique.

Aujourd’hui, les revenus du Groupe financier CC&L se répartissent de manière presque égale entre les marchés publics, les marchés privés, les clients fortunés, les produits de placement et les rendements des placements effectués par les partenaires en tant que mandants sur leurs propres bilans. De plus, les actions mondiales ont surpassé les actions canadiennes du Groupe financier CC&L, ce qui témoigne de la croissance et de la portée de l’entreprise, ainsi que de la valeur de la structure multientreprise de sociétés affiliées.

« L’un des secrets de notre succès réside dans le fait que nous nous concentrons sur l’établissement d’une harmonisation culturelle et structurelle des intérêts avec nos partenaires et dans tous les secteurs de notre organisation », affirme M. Stoddart.

Écoutez l’épisode complet du balado Global Investment Leaders mettant en vedette Warren Stoddart en cliquant sur le bouton de lecture ci-dessous.

Dentist medical tools - gloved hand pointing to computer displaying X-ray of teeth and jaw

Since the outbreak of Covid-19 in 2020, we have discussed the impact the pandemic has had on our lives, businesses and markets worldwide in several commentaries. The dental industry, like the whole healthcare sector, was no exception, with massive disruptions taking place, especially in the early months when patients were kept from attending routine check-ups.

Fortunately, the importance of the dental practice was well understood, and dentists have been allowed to resume operations with a set of strict protocols. However, delays caused by the pandemic left many people behind in their dental care. The stress and anxiety experienced during endless lockdowns had people grinding their teeth, further aggravating oral health issues. A friendly reminder that a good rule of thumb is to see a dentist twice a year.

During economic downturns, when consumer sentiment weakens, patients might decide to delay elective procedures. However, demand for essential health treatment remains relatively stable. We find that some healthcare companies present attractive investment opportunities, regardless of the macro environment. As the saying goes, teeth are always in style. A good example of such an opportunity is Dentium, a Korean dental implant manufacturer, and one of the top holdings of our Emerging Markets strategy.

In early-summer of 2000, Jung Sung-Min, a practicing dentist running a clinic in South Korea, established Dentium, a small manufacturer of dental implants and related instruments. Little did he expect that over the next two decades, the company would scale up successfully and capture a significant market share to end up ranking as the second largest in South Korea, and the sixth largest worldwide. Although no longer involved in day-to-day operations after stepping down as CEO and Chairman, the founder remains the largest shareholder of the company.

Dentium’s growth strategy to become a global total dental solutions provider is based on ongoing product innovations and expansion overseas. Clinical data accumulated over the years validates the high quality and solid performance of its products. The company has developed a comprehensive product lineup, expanding to digital dental equipment, including CBCT (cone-beam computed tomography), 3D printers, and CAD/CAM (computer-aided-design and computer-aided-manufacturing) systems. Dentium aims to foster package sales of its solutions, spanning from diagnosis to prosthesis procedures.

Although Dentium faces fierce competition from domestic peers, the company has steadily expanded its market share in South Korea, focusing on penetrating primarily newly opened clinics. Once its equipment is installed, recurring orders of dental implants ensure revenue stickiness, growth visibility and margin expansion. With manufacturing facilities located in South Korea, China, Vietnam, and the United States (U.S.), Dentium has established a global footprint. However, China is not only the largest market for the company, accounting for more than half of revenue, but it is also expected to remain the main growth driver in the medium-to-long term. At the same time, we believe that Dentium’s business in India, the Middle East and Southeast Asia will continue growing faster than the industry average.

The dental implant market globally is expected to exceed US $8 billion by 2028, from US $4.8 billion in 2021, implying a compounded annual growth rate of 7.6%. China, with the number of implants placed per 10,000 people equivalent to only one-tenth of the global average, will likely grow at least twice as fast. South Korea has one of the highest penetration rates of dental implants, is expected to grow at a low-to-mid-single digit annually. The global dental implant market is drifting towards an oligopolistic structure, with the seven largest companies (spearheaded by Straumann and Danaher) accounting for over 80% of sales.

In most regions, Dentium caters primarily to the value segment of the market, while providing products of equivalent quality to global industry leaders, but at more attractive price points. Combined with its rich expertise, strong reputation, consistent execution, and adequate capacity, Dentium’s success in developing countries makes total sense. However, the management team shows no signs of complacency and has set in motion an ambitious plan to become a top 3 operator globally in the next 8 to 10 years, ensuring a growth rate of around 15-20% per annum over this period. Operating leverage and growing efficiencies provide a decent uplift to margins. Thus, the operating margin of 30-35% is not only sustainable, but has some upside and compares very favourably to the 17-20% range recorded in the past.

Like many other businesses with a substantial footprint in China, Dentium faces risks primarily of a regulatory nature. The recent announcement made by the National Healthcare Security Administration of China removes lots of uncertainty and solidifies our investment thesis. Aiming to cut elevated prices at public hospitals (which apparently are higher than the average level of private sector) and educate patients, the Chinese government agency defined a set of rules and procedures to ensure central procurement and price controls at public dental clinics. Although this regulation will inevitably impact the general price level of dental implants in the private sector, Dentium caters primarily to private clinics and is expected to benefit at the expense of its U.S. and European peers, as its pricing is more attractive and highly competitive.

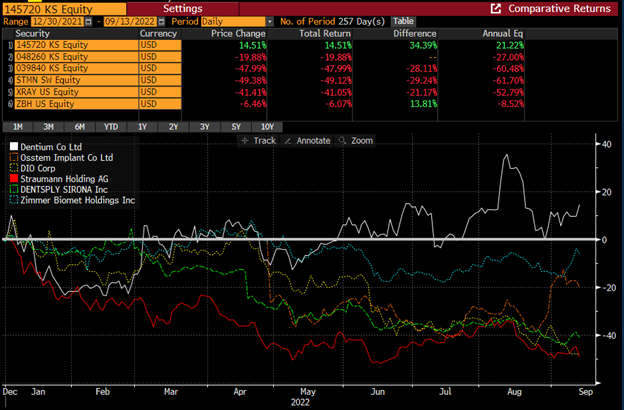
Despite having a highly attractive investment case, the company has huge room for improvement in terms of handling their investor relations. At the same time, it is not widely known among foreign investors, partially because it is not covered by any of the big brokerage firms. However, Dentium’s stock performance has been an outlier this year, outperforming its peers year to date.

Chart showing Dentium’s stock performance
Source: Bloomberg

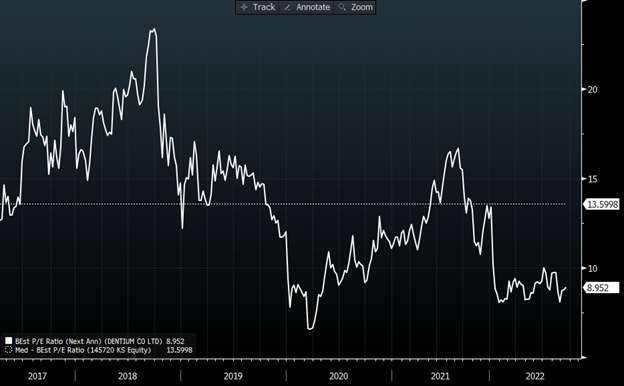
Despite its outperformance, Dentium still trades at an attractive valuation relative to its historical levels…

Chart showing that Dentium still trades at an attractive valuation relative to its historical levels
Source: Bloomberg

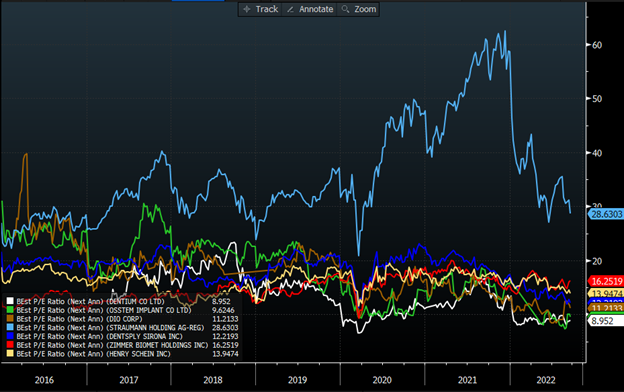
…as well as relative to its peers.

Chart showing that Dentium still trades at an attractive valuation relative to its peers
Source: Bloomberg


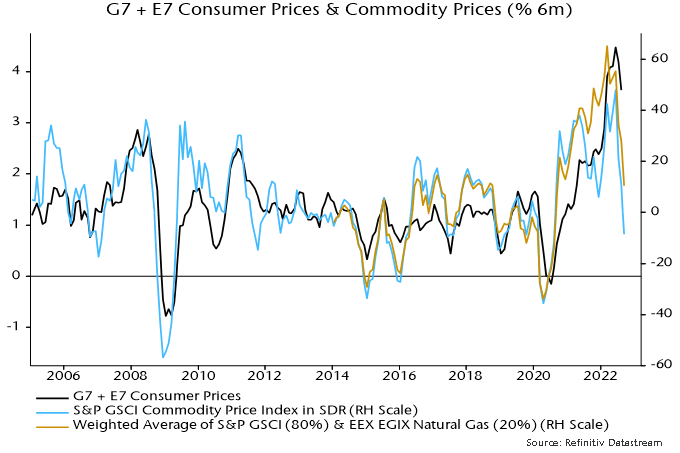
Global six-month consumer price inflation peaked in June and fell further in August, reflecting pass-through of lower oil prices and a small decline in core momentum. Current commodity prices suggest a sizeable further drop into Q4 – see chart 1*. 

Chart 1

Chart 1 showing G7 + E7 Consumer Prices & Commodity Prices (% 6m)

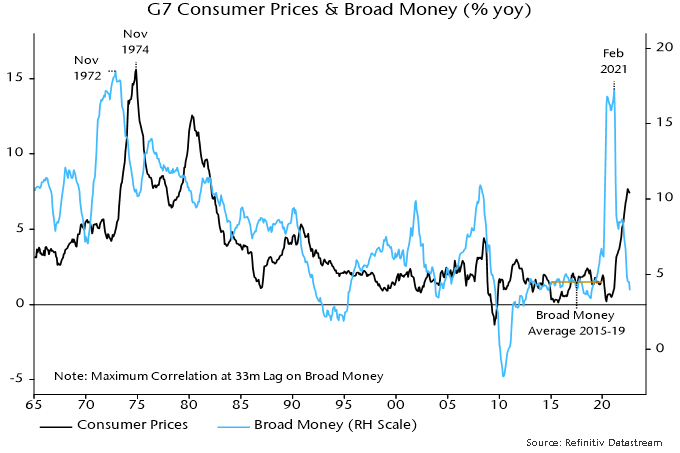
Annual as well as six-month CPI inflation probably peaked in June, with the peak occurring within the expected time band following a major top in annual broad money growth in February 2021 – money trends lead inflation by two to three years, according to the monetarist rule of thumb. 

G7 annual broad money growth is estimated to have fallen further to below 4% in August, widening an undershoot of its 4.5% average in the five years before the pandemic – chart 2. The suggestion is that G7 inflation rates will be back at or below target around end-2024, if not before. 

Chart 2

Chart 2 showing G7 Consumer Prices & Broad Money (% yoy)

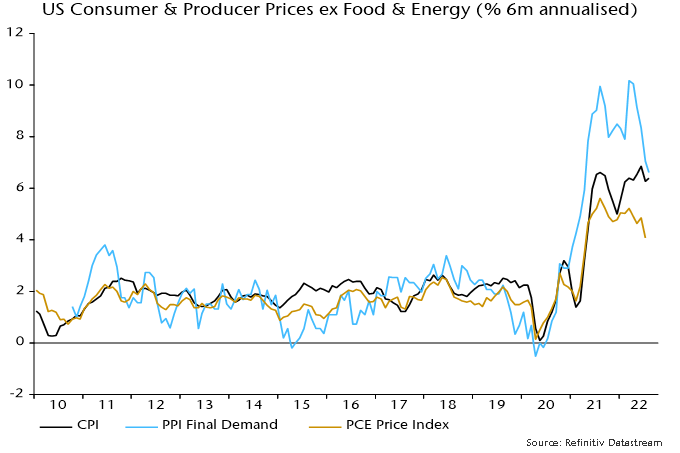
Markets were spooked by last week’s news of a hefty monthly rise in US core CPI in August but six-month momentum was little changed and below a June peak, while PPI pressures continue to ease – chart 3. 

Chart 3

Chart 3 showing US Consumer Producer Prices ex Food & Energy (% 6m annualised)

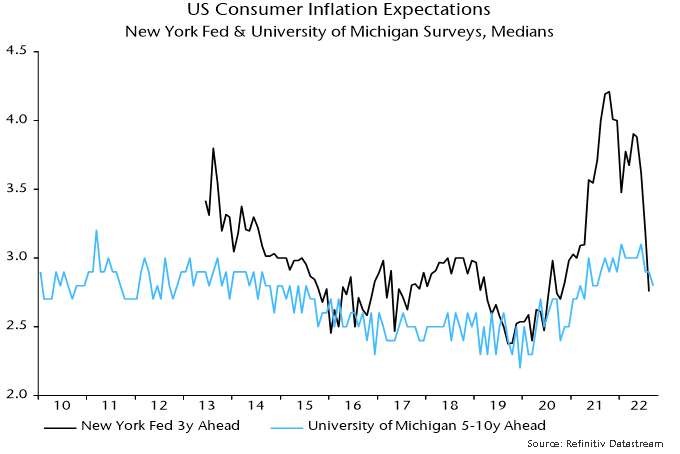
Central bankers are supposedly focused on preventing high inflation from becoming embedded in expectations. The view here has been that expectations were unlikely to become “unanchored” against a backdrop of weak money growth. The latest consumer surveys by the New York Fed and University of Michigan show longer-term inflation expectations back within 2010s ranges – chart 4. 

Chart 4

Chart 4 showing US Consumer Inflation Expectations New York Fed & University of Michigan Surveys, Medians

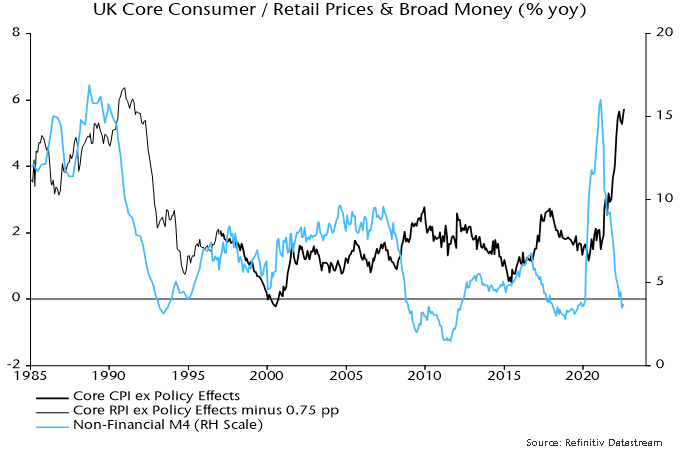
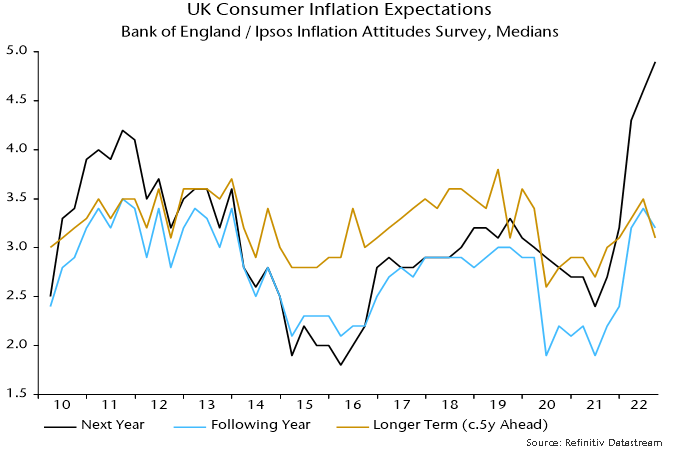
UK annual core CPI inflation made a marginal new high in August but money trends mirror the global picture and are signalling a 2023-24 collapse – chart 5. The latest Bank of England / Ipsos inflation attitudes survey, meanwhile, reported a fall in consumer longer-term inflation expectations, which have remained within the 2010s range – chart 6. 

Chart 5

Chart 5 showing UK Core Consumer / Retail Prices & Broad Money (% yoy)

Chart 6

Chart 6 showing UK Consumer Inflation Expectations Bank of England / Ipsos Inflation Attitudes Survey, Medians

The apparent anchoring of longer-term US / UK expectations suggests that wage pressures will dissipate rapidly as current inflation rates fall sharply in 2023. 

*The GSCI commodity price index uses US prices for the natural gas component; the series shown by the gold line in the chart incorporates an adjustment for European prices.

Following on our last commentary featuring Samsonite (1910 HK), more travel statistics were released confirming the increase in travel. July data shows that Europe, South America and the United States (U.S.) travel spending now exceeds the previous peak of July 2019.

Hotels in Europe saw their revenues per available room (RevPAR) in July grow 78% year-on-year, exceeding July 2019 by 19%. Occupancy rates are still below 2019 by above 5%, but average prices are 25% higher.

Meliá Hotels (MEL SM)

One holding that is very exposed to the European and Caribbean travel market is Meliá Hotels. Meliá is one a leading European hotel groups; it owns and/or manages more than 316 hotels and resorts in 33 countries, mainly in America and Europe, for a total of over 83,772 rooms, 11,854 of which are owned. Of the rooms, 63% are in Europe, 30% in the Caribbean, and 7% in Asia, which is the main reason for future room growth. Resorts account for 60% of hotels (i.e., 100% leisure), with the other 40% are urban, of which half are bleisure (business and leisure) in cities like London, Paris, Rome and Madrid.

Covid has been a huge challenge for companies, particularly in the travel and hospitality business. An important item we look at before investing in any company is the strength of the balance sheet. We want a strong balance sheet with little debt, even if it may appear as not the optimal capital structure. In times of stress, however, that strong balance sheet creates opportunities.  

Let’s contrast two world-class companies in the travel sector — Meliá and Carnival Cruise Line (CCL US):

 Meliá12/201912/2021
Number of hotels326316
Company owned4337
Total rooms83,77883,772
Number of shares outstanding (million)229.7220.5
Total net debt (excl. leases) €M5551,244
Stock price€7.86€6.06 (31/08/2022)
 Carnival Cruise Line11/201911/2021
Number of ships in service105105
Capacity per day248,790248,790
Number of shares outstanding (million)6901123
Total net debt (excl. leases) $M US10,98424,087
Stock price$45.08$9.54 (31/08/2022)
Source: Global Alpha

We can see that Meliá has the same number of rooms and less shares outstanding than at the end of 2019.  The debt, although higher, is still manageable, especially considering that the over 11,000 rooms Meliá owns could be sold and the company could eliminate most or all of the debt outstanding.  As a result, Meliá’s earnings per share, which were €0.64 in 2018, should be higher in 2024.

Meliá’s stock price, although down 23% since the end of 2019, has rebounded 121% since March 18, 2020, and should continue to rebound as results improve.

Carnival Cruise, on the other hand, had to more than double the number of shares outstanding and take on very expensive debt.  As a result, earnings per share, which were $4.49 in 2019, may never reach that level again.  Its stock price has gone down 81% since the end of 2019 and has only rebounded 2.5% since March 18, 2020, most likely a permanent loss of capital.

As investors, we are looking at per share growth. We think like business owners. If we owned the whole business, we would look to grow profits. When we buy shares, we become co-owner of the business and look for the sales and profits attached to each share we own.

Let’s look at this concept of growth per share. Every business is cyclical to a certain extent. What we want is higher highs and higher lows, and we want to avoid a permanent loss of capital.

Brunswick Corp (BC US)

A company we have followed for the last 20+ years and own in our U.S. small cap fund is Brunswick Corp.  Founded in 1845, the company has been manufacturing many recreational products over the years, from pool tables to bowling alleys, before focusing on boats, such as Boston Whaler, Lund or SeaRay and Mercury marine engines.

Source: Bloomberg

Looking at sales figures above, we can see that total sales have only increased slightly since FY2006.

However, shares outstanding have decreased as a result of strong free cash flow used to reduce the number of shares.

Source: Bloomberg

As a result, revenue per share has also increased.

Source: Bloomberg

And so have earnings per share.

Source: Bloomberg

And despite the global financial crisis of 2008 and the Covid pandemic of 2020, owning the shares has been rewarding investors.

Source: Bloomberg

UK monetary trends continue to argue against Bank of England policy tightening. 

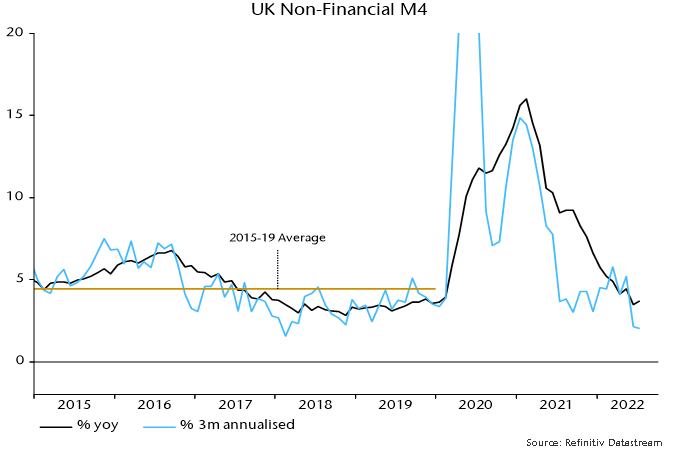
Annual growth of non-financial M4 – comprising money holdings of households and private non-financial firms – was 3.7% in July, below a 4.4% average in the five years preceding the pandemic. The aggregate expanded at an annualised rate of only 2.0% in the latest three months – see chart 1. 

Chart 1

Chart 1 showing UK Non-Financial M4

Growth of the Bank’s preferred broad money measure, M4ex, is higher, at 4.8% in the year to July and 4.9% annualised in the latest three months. This aggregate includes money holdings of financial companies, which have been rising strongly but are of little relevance for near-term demand prospects. 

Excessive money growth in 2020-21 boosted demand and “accommodated” price pressures due to various supply shocks, resulting in current high inflation. Is there still a monetary overhang from that period, warranting further policy tightening despite recent slow money growth? 

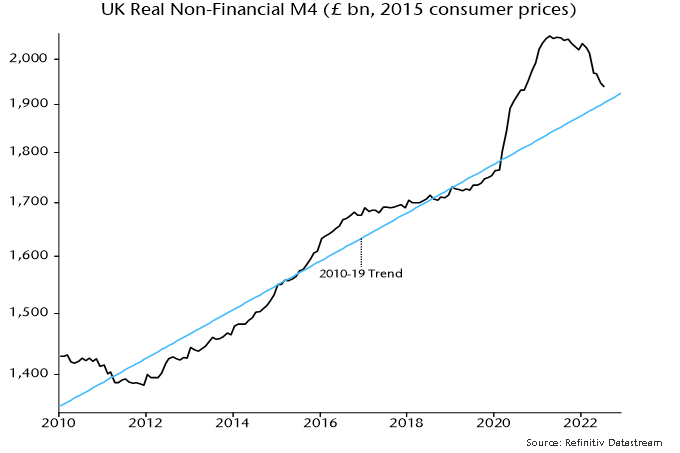
Expressed in real terms relative to consumer prices, non-financial M4 is almost back to its pre-pandemic trend – chart 2. The suggestion is that the monetary excess has already been largely “absorbed” by higher prices. 

Chart 2

Chart 2 showing UK Real Non-Financial M4 (£ bn, 2015 consumer prices)

In the absence of an overhang, the recent pace of money growth, if sustained, should be consistent with inflation returning to target within the two to three year horizon relevant for policy. Further tightening risks unnecessary economic pain and an eventual undershoot. 

Are the Truss government’s plans for large-scale fiscal loosening inflationary, warranting offsetting monetary policy action? 

Whether energy subsidies, tax cuts  etc. will prove inflationary depends on how they are financed. The banking system is likely to provide at least part of the funding, implying a first-round boost to broad money. 

A renewed rise in annual non-financial M4 growth to more than 6% would be inconsistent with medium-term inflation normalisation, requiring offsetting Bank action. 

Such a scenario, however, is far from guaranteed. Money growth was arguably on course to fall to a dangerously low level, reflecting planned Bank QT of £80 billion a year (equivalent to 3.4% of the current level of non-financial M4), a slowdown in mortgage lending and external outflows due to an expanded balance of payments deficit. 

A boost from monetary financing of fiscal loosening may offset such negative influences without pushing money growth significantly higher. 

A sensible approach, therefore, would be for the Bank to wait to assess the monetary consequences before deciding whether fiscal plans require a policy response. The current MPC membership, of course, has no understanding of or interest in monetary analysis. 

The Keynesian consensus view is that fiscal expansion necessarily implies a higher level of demand that the Bank cannot allow. The monetarist response is that, unless it leads to faster money growth, fiscal loosening will push up market interest rates and “crowd out” private spending. Surging gilt yields suggest that this scenario is already playing out. The Bank should avoid piling on the pain.