Monetary analysis suggests that the global economy will weaken into early 2025, while inflation will continue to decline. A cyclical forecasting framework, on the other hand, points to the possibility of strong economic growth in H2 2025 and 2026.

Are the two perspectives inconsistent? A reconciliation could involve downside economic and inflation surprises in H2 2024 triggering a dramatic escalation of monetary policy easing. A subsequent pick-up in money growth would lay the foundation for a H2 2025 / 2026 economic boom.

How would equities perform in this scenario? Bulls would argue that any near-term weakness due to negative economic news would be swiftly reversed as policies eased and markets shifted focus to the sunlit uplands of H2 2025 / 2026.

More likely, a significant fall in risk asset prices would be necessary to generate easing of the required speed and scale, and a subsequent recovery might take time to gather pace.

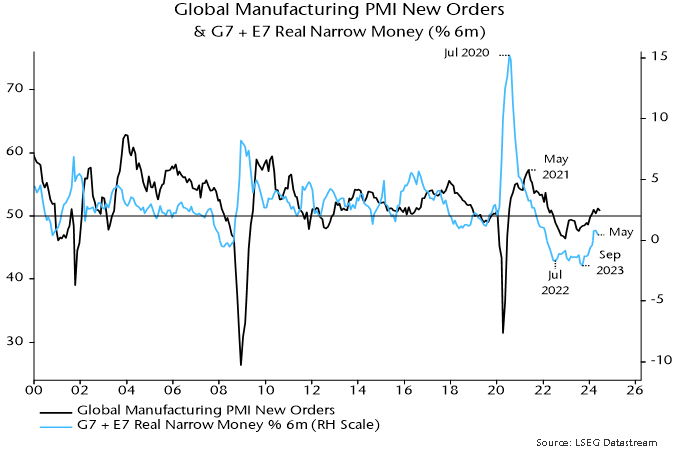
Global six-month real narrow money momentum has recovered from a major low in September 2023 but remains weak by historical standards and fell back in May – see chart 1. The assessment here is that the decline into the 2023 low will be reflected in a weakening of global economic momentum in H2 2024.

Chart 1
20240704_NSP_MMM_C1_GlobalManufacturingPMINewOrders

A counter-argument is that a typical lead-time between lows in real money and economic momentum historically has been six to 12 months. On this basis, negative fall-out from the September 2023 real money momentum low should be reaching a maximum now, with the subsequent recovery to be reflected in economic acceleration in late 2024.

The latter interpretation is consistent with the consensus view that a sustainable economic upswing is under way and will gather pace as inflation progress allows gradual monetary policy easing.

The pessimistic view here reflects three main considerations. First, economic acceleration now would imply an absence of any negative counterpart to the September 2023 real money momentum low – historically very unusual.

Secondly, the lag between money and the economy has recently been at the top end of the historical range, suggesting that a significant portion of 2023 monetary weakness has yet to feed through.

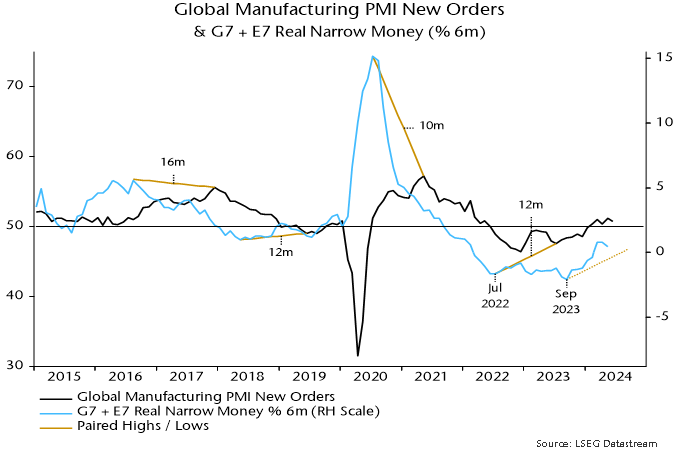
Highs in real money momentum in August 2016 and July 2020 preceded highs in global manufacturing PMI new orders by 16 and 10 months respectively, while a low in May 2018 occurred a year before a corresponding PMI trough – chart 2.

Chart 2
20240704_NSP_MMM_C2_GlobalManufacturingPMINewOrdersPaired

So a PMI low associated with the September 2023 real money momentum trough could occur as late as January 2025.

Thirdly, stock as well as flow considerations have been important for analysing the impact of money on the economy in recent years, and a current shortfall of real narrow money from its pre-pandemic trend may counteract a positive influence from the (tepid) recovery in momentum since September 2023 – chart 3.

Chart 3

20240704_NSP_MMM_C3_RatioOfG7E7RealNarrowMoneyToIndustrialOutput

The decline in real money momentum into the September 2023 low began from a minor peak in December 2022, suggesting that the PMI – even allowing for a longer-than-normal lag – should have peaked by early 2024. Global manufacturing PMI new orders rose into March and made a marginal new high in May. However, two indicators displaying a significant contemporaneous correlation with PMI new orders historically – PMI future output and US ISM new orders – peaked in January. The future output series fell sharply in June, consistent with the view that another PMI downturn is starting – chart 4.

Chart 4

20240704_NSP_MMM_C4_GlobalManufacturingPMI

Signs of weakness are also apparent under the hood of the services PMI survey. Overall new business has been boosted by financial sector strength, reflecting buoyant markets, but the consumer services component fell to a six-month low in June – chart 5.

Chart 5

20240704_NSP_MMM_C5_GlobalServicesPMINewBusiness

Could a weakening of economic momentum in H2 2024 snowball into a deep / prolonged recession? The cycles element of the forecasting process used here suggests not.

Severe / sustained recessions occur when the three investment cycles – stockbuilding, business capex and housing – move into lows simultaneously. The most recent troughs in the three cycles are judged to have occurred in Q1 2023, 2020 and 2009 respectively. Allowing for their usual lengths (3-5, 7-11 and 15-25 years), the next feasible window for simultaneous lows is 2027-28 – chart 6. Cycle influences should be positive until then.

Chart 6

20240704_NSP_MMM_C6_ActualPossibleCycleTroughYears

Major busts associated with triple-cycle lows, indeed, are usually preceded by economic booms. Such booms often involve policy shifts that super-charge positive cyclical forces. The 1987 stock market crash, for example, triggered rate cuts by the Fed and other central banks that magnified a late 1980s housing cycle peak.

Could significant policy easing in H2 2024 / H1 2025 similarly catalyse a H2 2025 / 2026 boom? Such a policy shift, on the view here, is plausible because negative economic news into early 2025 is likely to be accompanied a melting of inflation concerns.

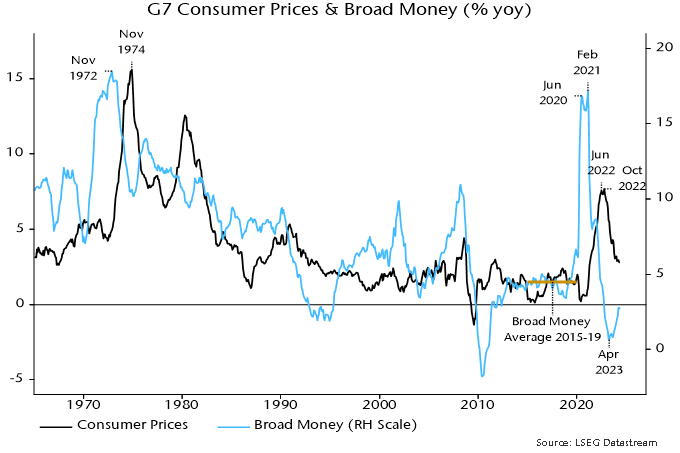
The latter suggestion is based on the monetarist rule-of-thumb that inflation follows money trends with a roughly two-year lag. G7 broad money growth of about 4.5% pa is consistent with 2% inflation. Annual growth returned to this level in mid-2022, reflected in a forecast here that inflation rates would move back to target in H2 2024 – chart 7.

Chart 7
20240704_NSP_MMM_C7_G7ConsumerPricesBroadMoney

The forecast is within reach. Annual US PCE and Eurozone CPI inflation rates were 2.5% in May and June respectively, with a fall to 2% in prospect by end-Q3 on reasonable assumptions for monthly index changes. UK CPI inflation has already dropped to 2.0%.

G7 annual broad money growth continued to decline into 2023, reaching a low of 0.6% in April 2023 and recovering gradually to 2.7% in May 2024. The suggestion from the monetarist rule, therefore, is that inflation rates will move below target in H1 2025 and remain low into 2026.

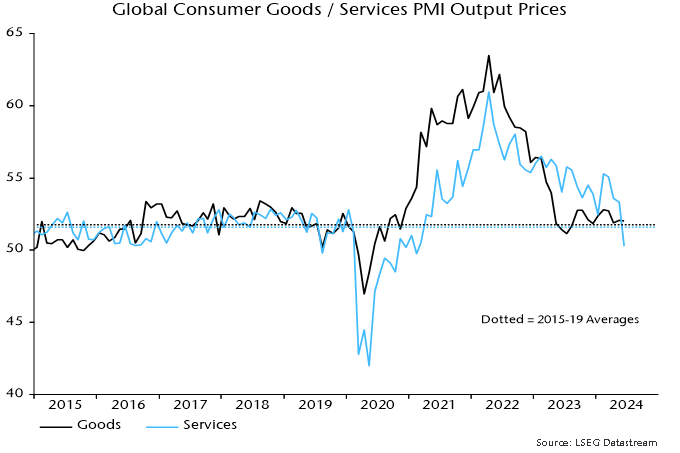
Central banks have been focusing on stickier services inflation, neglecting historical evidence that services prices lag both food / energy costs and core goods prices. Those relationships, and easing wage pressures, suggest that services resilience is about to crumble, a possibility supported by a sharp drop in the global consumer services PMI output price index in June to below its pre-pandemic average – chart 8.

Chart 8
20240704_NSP_MMM_C8_GlobalConsumerGoodsServicesPMIOutputPrices

The approach here uses two flow measures of global “excess” money to assess the monetary backdrop for equity markets: the gap between global six-month real narrow money and industrial output momentum, and the deviation of annual real money growth from a long-term moving average.

The two measures turned negative around end-2021, ahead of 2022 market weakness, but remained sub-zero as global indices rallied to new highs in H1 2024. The latter “miss” may be attributable to a money stock overshoot shown in chart 3 – the flow measures of excess money may have failed to capture the deployment of existing precautionary money holdings.

Still, the MSCI World index in US dollars outperformed dollar deposits by only 3.9% between end-2021 and end-June 2024, with the gain dependent on a small number of US mega-caps: the equal-weighted version of the index underperformed deposits by 8.4% over the same period.

What now? The money stock overshoot has reversed. The first excess money measure has recovered to zero but the second remains significantly negative. Mixed readings have been associated with equities underperforming deposits on average historically, with some examples of significant losses. Caution still appears warranted.

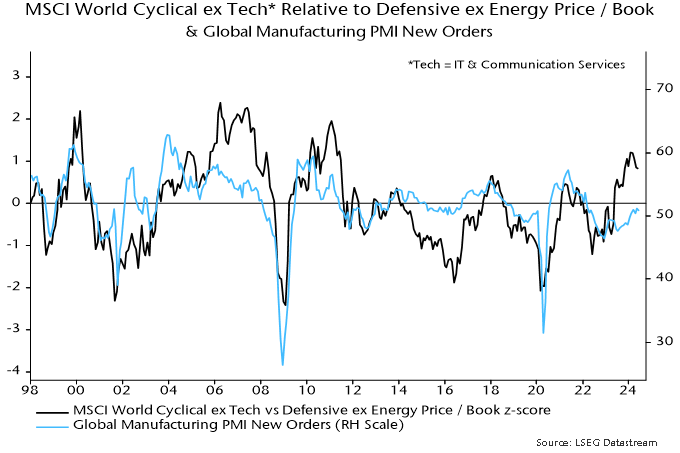
An obvious suggestion based on the economic scenario described above is to overweight defensive sectors. Non-tech cyclical sectors gave back some of their outperformance in Q2 but are still relatively expensive by historical standards, apparently discounting PMI strength – chart 9.

Chart 9
20240704_NSP_MMM_C9_MSCIWorldCyclicalExTech

Accelerated monetary policy easing could be favourable for EM equities, especially if associated with a weaker US dollar. Monetary indicators are promising. EM equities have outperformed historically when real narrow money growth has been higher in the E7 than the G7 and the first global excess money measure has been positive – chart 10. The former condition remains in place and the second is borderline.

Chart 10

20240704_NSP_MMM_C10_MSCIEMCumulativeReturnVsMSCIWorld

Monetary analysis suggests that the global economy will weaken into early 2025, while inflation will continue to decline. A cyclical forecasting framework, on the other hand, points to the possibility of strong economic growth in H2 2025 and 2026.

Are the two perspectives inconsistent? A reconciliation could involve downside economic and inflation surprises in H2 2024 triggering a dramatic escalation of monetary policy easing. A subsequent pick-up in money growth would lay the foundation for a H2 2025 / 2026 economic boom.

How would equities perform in this scenario? Bulls would argue that any near-term weakness due to negative economic news would be swiftly reversed as policies eased and markets shifted focus to the sunlit uplands of H2 2025 / 2026.

More likely, a significant fall in risk asset prices would be necessary to generate easing of the required speed and scale, and a subsequent recovery might take time to gather pace.

Global six-month real narrow money momentum has recovered from a major low in September 2023 but remains weak by historical standards and fell back in May – see chart 1. The assessment here is that the decline into the 2023 low will be reflected in a weakening of global economic momentum in H2 2024.

Chart 1

Chart 1 showing Global Manufacturing PMI New Orders and G7 plus E7 Real Narrow Money

A counter-argument is that a typical lead-time between lows in real money and economic momentum historically has been six to 12 months. On this basis, negative fall-out from the September 2023 real money momentum low should be reaching a maximum now, with the subsequent recovery to be reflected in economic acceleration in late 2024.

The latter interpretation is consistent with the consensus view that a sustainable economic upswing is under way and will gather pace as inflation progress allows gradual monetary policy easing.

The pessimistic view here reflects three main considerations. First, economic acceleration now would imply an absence of any negative counterpart to the September 2023 real money momentum low – historically very unusual.

Secondly, the lag between money and the economy has recently been at the top end of the historical range, suggesting that a significant portion of 2023 monetary weakness has yet to feed through.

Highs in real money momentum in August 2016 and July 2020 preceded highs in global manufacturing PMI new orders by 16 and 10 months respectively, while a low in May 2018 occurred a year before a corresponding PMI trough – chart 2.

Chart 2

Chart 2 showing Global Manufacturing PMI New Orders and G7 plus E7 Real Narrow Money

So a PMI low associated with the September 2023 real money momentum trough could occur as late as January 2025.

Thirdly, stock as well as flow considerations have been important for analysing the impact of money on the economy in recent years, and a current shortfall of real narrow money from its pre-pandemic trend may counteract a positive influence from the (tepid) recovery in momentum since September 2023 – chart 3.

Chart 3

Chart 3 showing Ratio of G7 and E7 Real Narrow Money to Industrial Output and 1995 to 2019 Log-Linear Trend

The decline in real money momentum into the September 2023 low began from a minor peak in December 2022, suggesting that the PMI – even allowing for a longer-than-normal lag – should have peaked by early 2024. Global manufacturing PMI new orders rose into March and made a marginal new high in May. However, two indicators displaying a significant contemporaneous correlation with PMI new orders historically – PMI future output and US ISM new orders – peaked in January. The future output series fell sharply in June, consistent with the view that another PMI downturn is starting – chart 4.

Chart 4

Chart 4 showing Global Manufacturing PMI New Orders and Global Manufacturing PMI Future Output / US ISM Manufacturing New Orders

Signs of weakness are also apparent under the hood of the services PMI survey. Overall new business has been boosted by financial sector strength, reflecting buoyant markets, but the consumer services component fell to a six-month low in June – chart 5.

Chart 5

Chart 5 showing Global Services PMI New Business

Could a weakening of economic momentum in H2 2024 snowball into a deep / prolonged recession? The cycles element of the forecasting process used here suggests not.

Severe / sustained recessions occur when the three investment cycles – stockbuilding, business capex and housing – move into lows simultaneously. The most recent troughs in the three cycles are judged to have occurred in Q1 2023, 2020 and 2009 respectively. Allowing for their usual lengths (3-5, 7-11 and 15-25 years), the next feasible window for simultaneous lows is 2027-28 – chart 6. Cycle influences should be positive until then.

Chart 6

Chart 6 showing Actual and Possible Cycle Trough Years

Major busts associated with triple-cycle lows, indeed, are usually preceded by economic booms. Such booms often involve policy shifts that super-charge positive cyclical forces. The 1987 stock market crash, for example, triggered rate cuts by the Fed and other central banks that magnified a late 1980s housing cycle peak.

Could significant policy easing in H2 2024 / H1 2025 similarly catalyse a H2 2025 / 2026 boom? Such a policy shift, on the view here, is plausible because negative economic news into early 2025 is likely to be accompanied a melting of inflation concerns.

The latter suggestion is based on the monetarist rule-of-thumb that inflation follows money trends with a roughly two-year lag. G7 broad money growth of about 4.5% pa is consistent with 2% inflation. Annual growth returned to this level in mid-2022, reflected in a forecast here that inflation rates would move back to target in H2 2024 – chart 7.

Chart 7

Chart 7 showing G7 Consumer Prices and Broad Money

The forecast is within reach. Annual US PCE and Eurozone CPI inflation rates were 2.5% in May and June respectively, with a fall to 2% in prospect by end-Q3 on reasonable assumptions for monthly index changes. UK CPI inflation has already dropped to 2.0%.

G7 annual broad money growth continued to decline into 2023, reaching a low of 0.6% in April 2023 and recovering gradually to 2.7% in May 2024. The suggestion from the monetarist rule, therefore, is that inflation rates will move below target in H1 2025 and remain low into 2026.

Central banks have been focusing on stickier services inflation, neglecting historical evidence that services prices lag both food / energy costs and core goods prices. Those relationships, and easing wage pressures, suggest that services resilience is about to crumble, a possibility supported by a sharp drop in the global consumer services PMI output price index in June to below its pre-pandemic average – chart 8.

Chart 8

Chart 8 showing Global Consumer Goods / Services PMI Output Prices

The approach here uses two flow measures of global “excess” money to assess the monetary backdrop for equity markets: the gap between global six-month real narrow money and industrial output momentum, and the deviation of annual real money growth from a long-term moving average.

The two measures turned negative around end-2021, ahead of 2022 market weakness, but remained sub-zero as global indices rallied to new highs in H1 2024. The latter “miss” may be attributable to a money stock overshoot shown in chart 3 – the flow measures of excess money may have failed to capture the deployment of existing precautionary money holdings.

Still, the MSCI World index in US dollars outperformed dollar deposits by only 3.9% between end-2021 and end-June 2024, with the gain dependent on a small number of US mega-caps: the equal-weighted version of the index underperformed deposits by 8.4% over the same period.

What now? The money stock overshoot has reversed. The first excess money measure has recovered to zero but the second remains significantly negative. Mixed readings have been associated with equities underperforming deposits on average historically, with some examples of significant losses. Caution still appears warranted.

An obvious suggestion based on the economic scenario described above is to overweight defensive sectors. Non-tech cyclical sectors gave back some of their outperformance in Q2 but are still relatively expensive by historical standards, apparently discounting PMI strength – chart 9.

Chart 9

Chart 9 showing MSCI World Cyclical ex Tech* Relative to Devensive ex Energy Price/Book and Global Manufacturing PMI New Orders

Accelerated monetary policy easing could be favourable for EM equities, especially if associated with a weaker US dollar. Monetary indicators are promising. EM equities have outperformed historically when real narrow money growth has been higher in the E7 than the G7 and the first global excess money measure has been positive – chart 10. The former condition remains in place and the second is borderline.

Chart 10

Chart 10 showing MSCI EM Cumulative Return vs MSCI World and "Excess" Money Measures

Notre premier rapport sur l’investissement responsable reflète notre engagement à l’égard des investissements dans les infrastructures durables et fait état des initiatives que nous avons prises dans l’ensemble de notre portefeuille.

Grandes lignes du rapport :

  • Investisseurs à long terme : Notre société appartient à nos employés et notre équipe investit directement dans nos fonds aux côtés de nos clients; nous avons à cœur de privilégier la réussite à long terme du portefeuille en gérant nos placements de façon durable.
  • Pratiques durables : Nous intégrons les considérations relatives à l’investissement responsable à chaque étape de notre processus de placement, de l’évaluation initiale à la gestion continue.
  • Projets marquants : Nos investissements garantissent des services essentiels, avec des actifs diversifiés composés d’infrastructures de transport, sociales et d’énergie renouvelable indispensables, comprenant plus de 1,8 GW de capacité de production pour toute une gamme de sources d’énergie propre.
  • Engagement communautaire : Nous travaillons activement en partenariat avec les collectivités locales afin d’assurer une harmonisation à long terme avec nos parties prenantes.

Eurozone money trends remain too weak to support an economic recovery. A relapse in the latest business surveys could mark the start of a “double dip”.

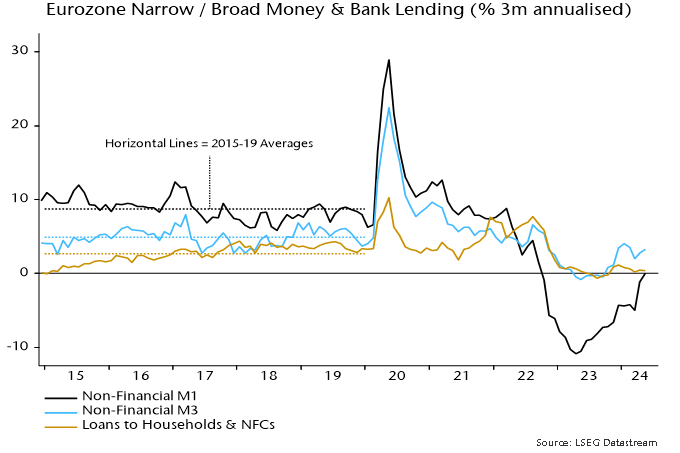
Three-month rates of change of narrow and broad money – as measured by non-financial M1 and M3 – were zero and 3.3% annualised respectively in May. Current readings are well up on a year ago but significantly short of pre-pandemic averages – see chart 1.

Chart 1

Chart 1 showing Eurozone Narrow / Broad Money & Bank Lending (% 3m annualised)

May month-on-month changes were soft, with narrow money contracting by 0.1% and growth of the broad measure slowing to 0.1%.

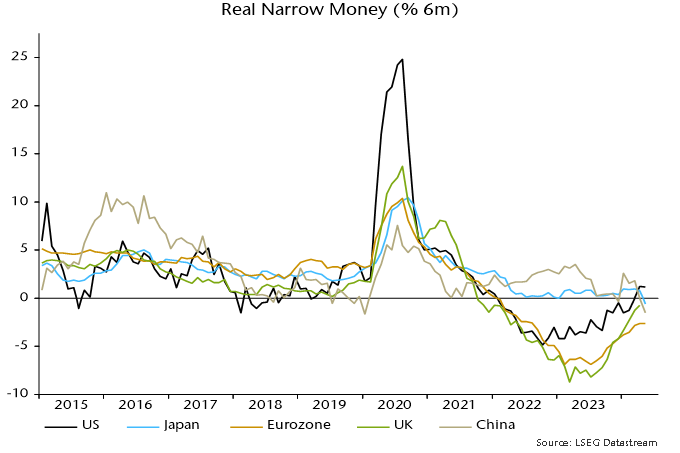
Six-month real narrow money momentum – the “best” monetary leading indicator of economic direction – moved sideways in May, remaining significantly negative and lower than in other major economies. (The latest UK reading is for April.)

Chart 2

Chart 2 showing Real Narrow Money (% 6m)

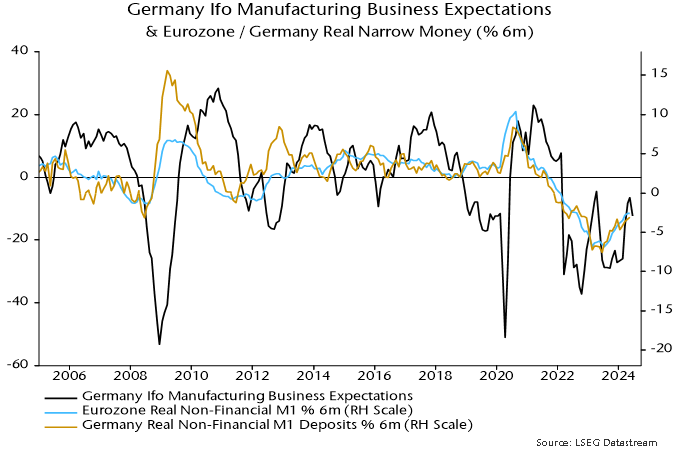
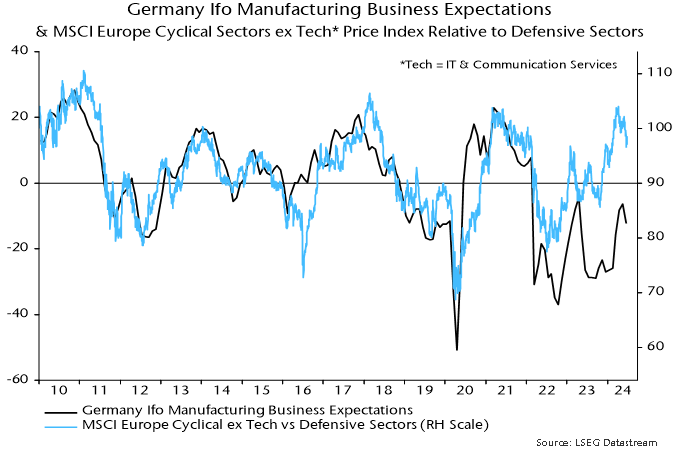
June declines in Eurozone PMIs and German Ifo expectations may represent a realignment with negative monetary trends following a temporary overshoot – chart 3. A recent correction in cyclical equity market sectors could extend if Ifo expectations stall at the current level – chart 4.

Chart 3

Chart 3 showing Germany Ifo Manufacturing Business Expectations & Eurozone / Germany Real Narrow Money (% 6m)

Chart 4

Chart 4 showing Germany Ifo Manufacturing Business Expectations & MSCI Europe Cyclical Sectors ex Tech* Price Index Relative to Defensive Sectors *Tech = IT & Communication Services

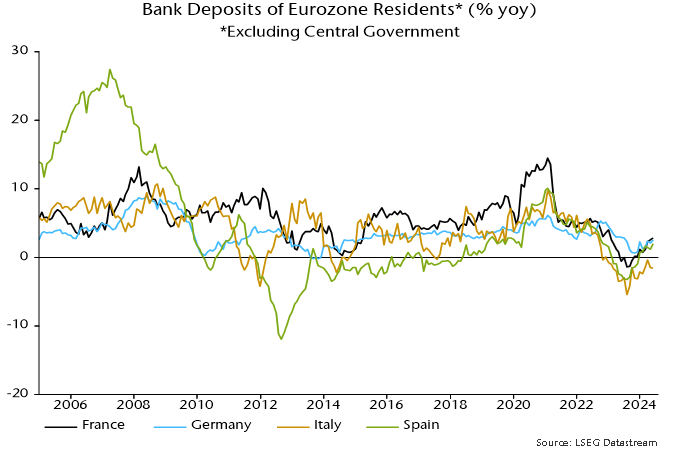
Growth of bank deposits is similar in France, Germany and Spain but lagging in Italy – chart 5. The country numbers warrant heightened scrutiny, given a risk that French political turmoil triggers deposit flight to Germany.

Chart 5

Chart 5 showing Bank Deposits of Eurozone Residents* (% yoy) *Excluding Central Government

Union Jacks on Oxford Street for the Queen's Platinum Jubilee.

Some of our recent commentaries (December 7, 2023 and February 8, 2024) cover the 2024 election landscape. One of the biggest surprises so far was the decision of UK Prime Minister Rishi Sunak to call a general election for July 4. In this commentary, we look at the UK economy and markets as we approach this election.

Sunak’s decision caught everyone off guard and, on the face of it, the timing seems strange. A summer election during peak holiday season usually entails poor turn outs. The general thinking behind the decision is that momentum would be strongest after a stronger-than-expected GDP print in Q1 and inflation almost back to normal. A slowdown in growth is expected, and while the drop in inflation was welcomed, it was due to a decline in home energy bills and the base effect. Consensus estimates expected a larger fall, and as such, expectations for the first interest rate cut from the Bank of England have been pushed back to September from June, keeping mortgage costs higher for longer.

Labour’s lead and Conservative struggles

At the time of writing, the Labour Party has a 21-point lead, and the incumbent Conservatives are falling into a battle with Reform UK to be the official opposition party. The election campaign is well under way and Labour seem set for an overwhelming majority. This means they should be able to implement their policies, so let’s look at their manifesto and see what is likely to impact the economy and capital markets.

Labour’s strategic plans: No EU return, but stronger ties

First and foremost, there is no return to the EU on the cards, but Labour will continue to work on EU trade and investment relationships. The main points concern economic stability, defence, housing, infrastructure and clean energy. With geopolitical tensions continuing to run high, Labour will kick off their first year in government with a Strategic Defense Review, setting out a plan to increase defence spending to 2.5% of GDP.

Push for affordable housing

As expected, housing is at the forefront. Labour would like to build 1.5 million new homes over their term with an emphasis on increasing social and affordable housing. Brownfield development is the priority and approval of sites will be fast-tracked. New developments will be obligated to ensure more affordable homes.

No tax increases, but closing loopholes

For personal taxes, Labour has pledged to freeze National Insurance, the basic, higher, or additional rates of Income Tax, and VAT. There are some changes around the fringes that will be a source of income – ending the use of offshore trusts and closing some other loopholes to tackle tax avoidance. Corporate tax will also be unchanged for the term, keeping it at 25%, which is the lowest rate of the G7, and a promise to act if tax changes elsewhere hinder UK competitiveness.

Building for the future

Infrastructure investment has been low, so public investment will be used to support and attract additional private investment, whether domestic or foreign. An overhaul of the planning system would help here. In parallel to the usual spending on roads, railways and other important national infrastructure, investments will go into upgrading ports and improving the supply chain, new gigafactories to help the automotive industry, rebuilding the steel industry, accelerating the deployment of carbon capture and supporting green hydrogen manufacturing.

Wind, solar and job creation

The UK has some natural advantages that should help the transition to clean energy – a long coastline, high winds, shallow waters and access to a skilled workforce with extensive offshore and engineering capabilities. The Green Prosperity Plan aims to double onshore wind, triple solar power and quadruple offshore wind by 2030 while creating jobs. Labour does not intend to issue new licenses to explore new oil and gas fields in the North Sea. The same applies to new coal licenses and fracking will also be banned. Labour remains committed to the EV transition by restoring the phase-out date of 2030 for new cars with internal combustion engines and will accelerate the roll out of charge points.

Financial services as a boost for innovation and investment

There was some positive language around financial services, an undoubted strength of the UK economy. Labour wants to support innovation and growth in the sector, talking about a pro-innovation regulatory framework. Also concerning financial services is the ambition to increase investment from pension funds in UK markets. Domestic pension funds are mature and have reduced equity allocations in general and even more so UK equity allocations. The UK Office for National Statistics shows that domestic pension funds own 1.6% of the UK equity market from over 30% in the 1990s, low compared to similar developed markets. Theoretically this number could go lower, but with some new incentives, arguably risk is skewed to the upside, especially if a minimum level of UK equity exposure within pension portfolios is mandated. Increased demand could see a re-rating for UK equities.

UK equities poised for growth

The party in charge is ultimately not the most important factor. The last Labour government coincided with the Great Financial Crisis in 2008, and the Labour government before that (Tony Blair) was impacted by the dot-com bubble bursting and the subsequent recovery. What has been consistent over the past 60 years has been an average 10% gain for the FTSE All-Share index in the first year of an election when a change of power occurs.

The UK market looks attractive. Valuations are depressed and the discount is broad, having seen a pickup in bids from overseas competitors and private equity acquirers opportunistically seeking assets and market positions. Losing listed companies to M&A, a slow environment for IPOs and UK-based companies choosing a primary listing overseas means UK equities are in short supply. Finding solutions for the structural challenges facing the UK economy is essential to kickstarting growth and attracting investors. If execution is successful, UK equities could gain favour the way Japanese stocks have lately.

Retro weighing scale on a wooden table.

Les investisseurs institutionnels sont souvent confrontés à la décision de protéger leurs placements étrangers contre les fluctuations des taux de change. L’une des préoccupations habituelles est que l’exposition aux devises augmentera la volatilité des rendements des actions étrangères.

Le présent article explore les cas où la couverture est bénéfique et ceux où les investisseurs canadiens peuvent avoir intérêt à ne pas se couvrir.

Actions canadiennes ou actions mondiales, lesquelles sont les plus volatiles?

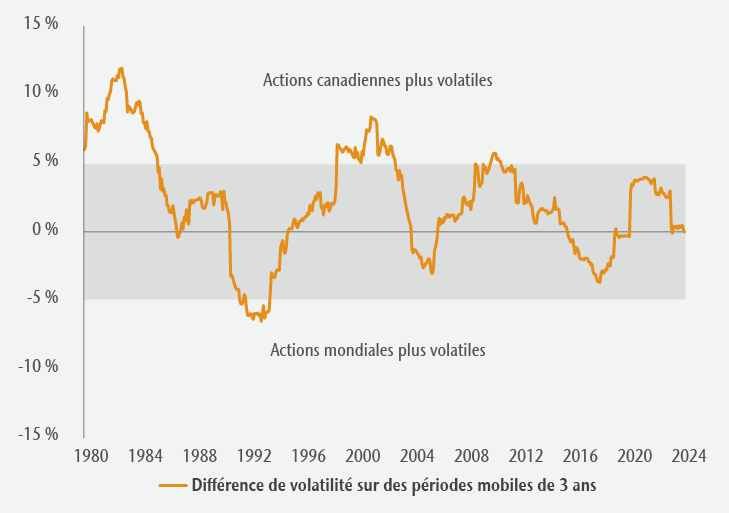
On suppose que les investissements à l’extérieur du Canada, qui sont exposés à différentes devises et différents marchés, peuvent se traduire par des rendements plus volatils pour les actions mondiales que pour les actions canadiennes. Toutefois, sur des périodes courtes (rendements sur des périodes mobiles de trois ans), les actions mondiales ont généralement été moins volatiles que les actions canadiennes, bien qu’il y ait eu des exceptions.

Figure 1 : Volatilité relative des actions canadiennes et mondiales


Sources : Bloomberg et MSCI.

La figure 1 illustre la volatilité relative des rendements des actions canadiennes (indice composé S&P/TSX) par rapport aux actions mondiales (indice MSCI Monde non couvert). Lorsque la ligne orange est au-dessus de 0 %, les actions canadiennes ont été plus volatiles; en dessous de 0 %, les actions mondiales ont été plus volatiles. Le graphique montre que, sur de courtes périodes, les actions canadiennes ont souvent été plus volatiles.

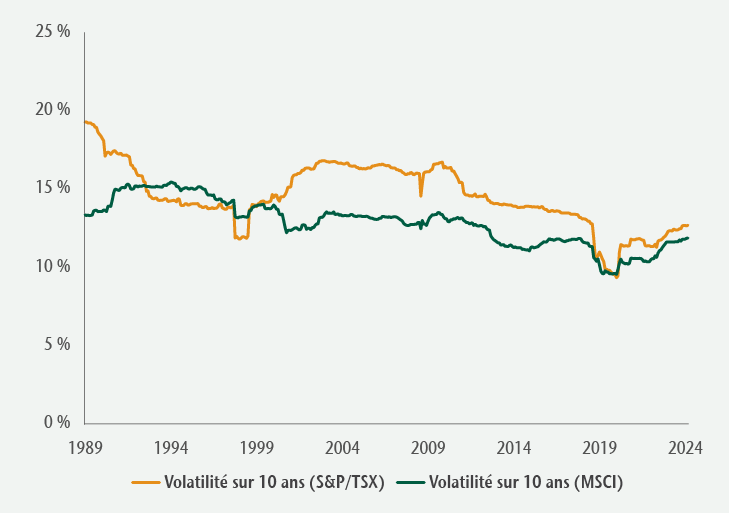
Sur des périodes plus longues (rendements sur des périodes mobiles de 10 ans) et en particulier depuis la fin des années 1990, l’analyse montre que les actions mondiales ont été presque systématiquement moins volatiles que les actions canadiennes (figure 2) grâce à un univers d’occasions de placement plus large et plus diversifié.

Figure 2 : Volatilité des rendements absolus des actions canadiennes et mondiales


Sources : Bloomberg et MSCI.

La couverture réduit-elle la volatilité des actions mondiales?

Contrairement à la croyance selon laquelle une couverture est nécessaire pour réduire la volatilité, les données historiques indiquent que ce n’est pas toujours le cas.

La figure 3 illustre la volatilité relative des rendements couverts et non couverts des actions mondiales sur des périodes mobiles de trois ans. Lorsque la ligne orange est au-dessus de 0 %, les rendements couverts ont été moins volatils; en dessous de 0 %, les rendements non couverts ont été moins volatils. Les rendements non couverts des actions mondiales ont généralement été moins volatils, surtout depuis le milieu des années 1990, car les fluctuations des taux de change tendent à contrebalancer les rendements boursiers, ce qui réduit la volatilité globale des rendements.

Figure 3 : Actions mondiales couvertes et non couvertes


Sources : Bloomberg et MSCI.

Quel est le ratio optimal de couverture du risque de change?

Le ratio de couverture, la valeur de la position de couverture par rapport à la valeur totale de la position, varie selon l’investisseur. Si un portefeuille détient 10 millions de dollars en actions mondiales et que l’exposition au risque de change est couverte à hauteur de 3 millions de dollars, le ratio de couverture est de 30 %. Bien que la recherche indique souvent qu’un ratio de couverture de 50 % est optimal, les décisions individuelles dépendent de l’exposition aux devises et des perspectives de risque de l’investisseur. La figure 4 montre deux investisseurs dont les ratios de couverture sont différents, mais dont l’exposition nette au risque de change est la même.

Figure 4 : Même exposition nette au risque de change, différents ratios de couverture

Exposition au risque de change (a) Ratio de couverture (b) Exposition nette au risque de change (a-b)
Investisseur A 60 % 50 % 30 %
Investisseur B 30 % 0 % 30 %

Sources : Bloomberg et MSCI.

Du point de vue de la gestion du risque, un ratio de couverture de 50 % est parfois utilisé pour gérer le « risque de regret », soit la déception potentielle liée à l’adoption d’une approche non couverte ou entièrement couverte qui se révèle par la suite sous-optimale.

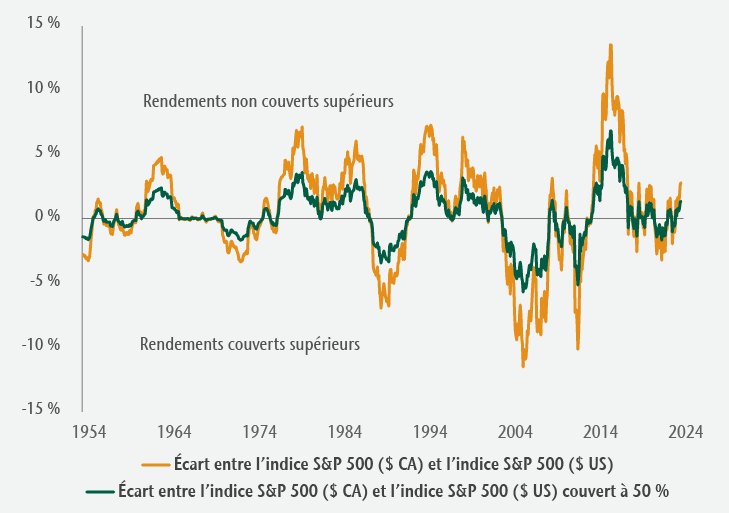
La figure 5 compare les écarts de rendement sur des périodes mobiles de trois ans entre les rendements des actions américaines non couvertes et entièrement couvertes (ligne orange) et entre les actions américaines non couvertes et couvertes à 50 % (ligne verte). Lorsque les lignes sont supérieures à 0 %, la stratégie non couverte a inscrit un rendement supérieur, tandis que les stratégies entièrement couvertes et couvertes à 50 % ont inscrit un rendement supérieur lorsque les lignes tombent en dessous de 0 %.

Figure 5 : Rendement relatif des actions américaines sur des périodes mobiles de 3 ans


Sources : Bloomberg et MSCI.

Par défaut, l’écart de rendement pour l’approche de couverture de 50 % contre le « risque de regret » (ligne verte) a été moins volatil au cours de la période. Pour certains investisseurs, il est préférable d’enregistrer de plus petites différences liées aux fluctuations des taux de change.

Comment les devises devraient-elles être gérées sur les marchés privés?

Les placements sur les marchés privés mondiaux, comme l’immobilier direct et les actifs d’infrastructures dans les fonds à capital variable, continuent d’augmenter considérablement. Ces actifs moins liquides nécessitent toujours un examen attentif de l’exposition aux devises, car celle-ci peut avoir une incidence sur leur valeur à court terme. Les investisseurs sur le marché privé s’attendent généralement à un revenu et à une diversification au moyen de rendements absolus, qui peuvent être significativement impactés par les fluctuations de change.

La couverture permet de gérer ces risques, mais une évaluation des facteurs propres à chaque placement est nécessaire. Cela comprend la compréhension des charges et des revenus sous-jacents de l’actif, des couvertures naturelles potentielles, des coûts de couverture et de la durée de la couverture. Il est également important d’apparier la devise de l’exposition nette avec le financement connexe.

Pour les investisseurs canadiens, la façon la plus simple et la plus efficace de gérer le risque de change est de confier la couverture de change au gestionnaire de placement sur le marché privé.

A recovery in the OECD’s US composite leading indicator could be reversing, in which case recent underperformance of cyclical equity market sectors versus defensives could extend.

The OECD indicator receives less attention than the Conference Board US leading economic index but its historical performance compares favourably.

The correlation coefficient of six-month rates of change is maximised with a two-month lag on the OECD indicator, i.e. the OECD measure slightly leads the Conference Board index.

The OECD indicator recovered from early 2023, signalling that recession risk was (temporarily?) receding. The Conference Board index continued to weaken, although the rate of decline slowed.

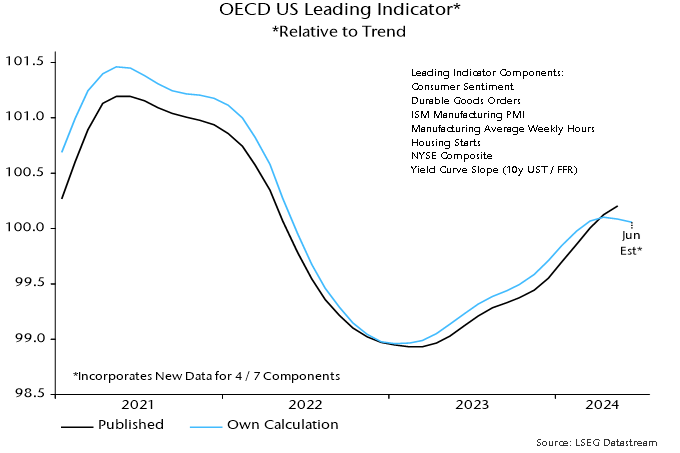
The latest published numbers show the OECD measure still rising in May. New information, however, is available for four of the seven components. An updated calculation suggests that the indicator peaked in April, with small declines in May and June – see chart 1.

Chart 1

Chart 1 showing OECD US Leading Indicator* *Relative to Trend

A firmer indication will be available at the end of next week, following release of data on the remaining three components – durable goods orders, the ISM manufacturing PMI and manufacturing average weekly hours.

The suggested stall in the OECD leading indicator recovery has coincided with larger month-on-month declines in the Conference Board measure in April and May.

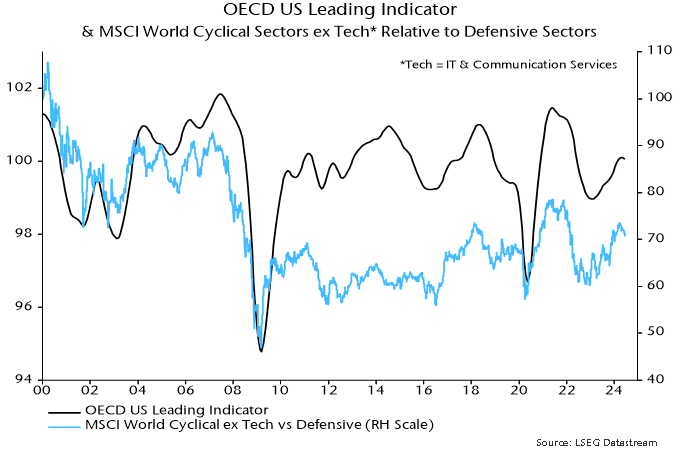
The price relative of MSCI World cyclical sectors, excluding tech, versus defensive sectors has mirrored movements in the OECD US leading indicator historically – chart 2. A rally in the relative peaked in late March, consistent with the suggestion of an April leading indicator top.

Chart 2

Chart 2 showing OECD US Leading Indicator & MSCI World Cyclical Sectors ex Tech* Relative to Defensive Sectors *Tech = IT & Communication Services

Three recycling bins on a kitchen island.

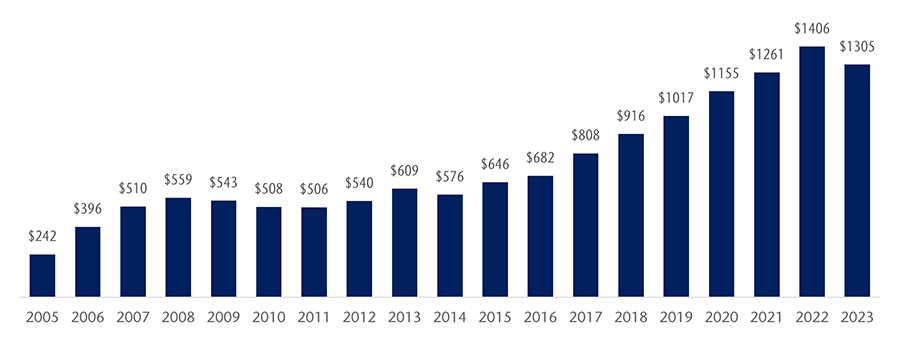
When one thinks of high-return investments, the waste management sector rarely comes to mind. It’s not as exciting as tech or biotechnology companies. Yet, the waste services industry has captured the attention of some of the world’s most sophisticated investors. For instance, the Gates Foundation owns over 35 million shares of Waste Management, the largest waste service company in the United States, making it one of the foundation’s top holdings. Private equity funds also have a keen interest in this sector, with those specializing in environmental services amassing more than $1.3 trillion globally, according to PitchBook.

Global dry powder: private equity funds seeking investments in environmental services (in billions)
Bar graph showing the growth of investment from private equity funds in environmental services, 2005 to 2023.Source: PitchBook.

So, what makes the waste management business so attractive to some investors?

The sheer size and growth potential of the market. Globally, more than two billion tons of municipal solid waste are generated annually. To visualize this, if packed into standard shipping containers and placed end-to-end, this waste would circle the Earth 25 times, or to the moon and back. On top of municipal waste, human activity generates significant amounts of agricultural, construction, industrial and healthcare waste. The global waste management market was valued at $1.3 trillion in 2022 and is expected to grow at a compound annual growth rate (CAGR) of 5.4% until 2030, reaching $1.96 trillion.

Recession-resilient business model and high entry barrier. Waste management is a fundamental service in modern society. Every day, millions of tons of waste are generated, requiring efficient collection, treatment and disposal. This ongoing need makes waste management companies indispensable, ensuring a stable demand regardless of economic conditions. These companies typically generate strong cash flows, high margins and significant return on capital. Long-term contracts with municipalities and businesses provide predictable revenue streams. Moreover, high entry barriers associated with sizable upfront investment and stringent regulations deter newcomers, giving existing players pricing power and reducing competitive pressures. This stability translates into reliable revenue streams, making the sector attractive for long-term investors.

At Global Alpha, we have identified numerous promising investment opportunities within the waste services sector over the years. Here are some examples:

  • Casella Waste Systems (CWST US) is a regional player providing integrated waste services, with a strong focus on the US Northeast and Mid-Atlantic regions. The company benefits from its strategic positioning in the capacity-constrained Northeast market, allowing it to capitalize on pricing power and opportunities for growth through M&A. The company also emphasizes operational optimization to enhance margins and efficiency.
  • Befesa (BFSA GY) is the world’s leading recycler for steel dust and aluminum, with recycling facilities across Europe, Asia and North America. The company has over 50% market share in Europe and is a first mover in China for steel-dust recycling. With increasing regulatory mandates requiring decarbonizing steel production, Befesa is well-positioned to capture the volume growth with a well-defined capacity plan.
  • Daiseki (9793 JP) is Japan’s largest liquid waste processor, including waste oil, wastewater and sludge. Its recycling technologies can treat waste oil to produce recycled lubricating oil, heavy oil and supplemental fuels. Demand for recycled oil is rising as Daiseki’s clients seek to reduce their carbon footprint.
  • ARE Holdings (5857 JP) is the world’s largest precious metals refiner. The company collects, recycles and refines precious metals, including gold, silver, platinum and palladium from dental, electronics and jewelry materials. The carbon footprint of recycled silver is roughly one-third of mined silver. Recycling gold emits less than 1% of emissions than mining new gold. Many industry players, such as Prada, Tiffany, Cartier and Pandora, now use recycled metals.
  • TRE Holdings (9427 JP) is one of the leading waste treatment and recycling companies in Japan, specializing in handling construction waste and waste metals from automobile, home appliances and industrial sectors. It has over 20% market share in the construction industry and recycling schemes with auto makers and home appliance manufacturers. The company also has renewable energy businesses that use recycled wood from its own operations as fuel for biomass power generation.

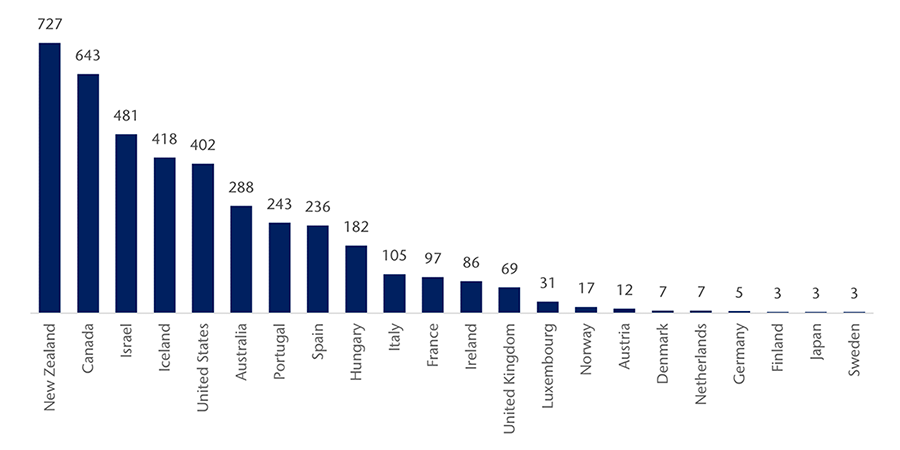
When it comes to waste management, Japan is known for its rigorous waste sorting and disposal practices. The country faces a challenge with limited landfill capacity. Existing landfill sites have remaining capacity of 96.66 million cubic meters, projected to reach full capacity in 23 years, so Japan tries to minimize garbage through efficient sorting and processing. That explains why Japan has such low landfill waste per capital compared to other economies.

Global landfill waste generated per capita 2022, by select countries (in kilograms)
Bar graph showing landfill waste per capita across select countries.Source: Statista.

Daiei Kankyo (9336 JP), a name added in our portfolios in a recent quarter, is a Kansai-based waste disposal company that offers one-stop services from collection, transport and intermediate processing, to final disposal. The company has top share in the final disposal market among private-sector players, accounting for approximately 11% of Japan’s total landfill capacity. The final disposal business is extremely difficult for new players to enter because of the strengthened regulatory processes and environmental concerns by local communities. Only companies with a strong track record and reputation can possibly get a permit and expand their capacity. Additionally, it takes six to seven years to open a new facility. This lengthy process further increases the barriers to entry, ensuring stable volume growth and strong pricing power for incumbents. That’s why Daiei Kankyo boasts the highest margin among its waste management peers in Japan. Over the years, the company has diversified into recycling, soil remediation and electricity generation businesses to provide a total solution to its clients.

In contrast to other markets, Japan’s waste management industry is more fragmented, with the four players accounting for only 4.2% of the market, compared to 40% to 50% of the US market, which allows ample M&A opportunities. Daiei Kankyo has acquired over 20 companies since its founding in 1979, typically at EV/EBITDA multiples of 3x to 5x. M&A will remain a growth driver in the coming years.

Another driver for the company is public-private partnerships (PPP). Many Japanese local municipalities struggle with handling household waste due to a declining population and labour shortages and have started working with private players. Daiei Kankyo pioneered PPP contracts where the plant will be built, owned and operated by Daiei Kankyo, and municipalities will pay waste treatment fees once operational. So far, the company has won three orders and expects to win 12 by 2030.

Turning waste into wealth

While only a small portion of waste is recycled, global innovators and industry leaders are finding new ways to turn waste into sustainable materials or fuels. The potential for these innovations to convert waste streams – currently incinerated or buried – into valuable resources is promising for the future.


Chinese May money numbers were weak even allowing for a distortion from a recent regulatory change.

The preferred narrow and broad aggregates here are “true M1” (which corrects the official M1 measure for the omission of household demand deposits) and “M2ex” (i.e. M2 excluding bank deposits held by other financial institutions – such deposits are volatile and less informative about economic prospects).

Six-month rates of change of these measures fell to record lows in May – see chart 1.

Chart 1

Chart 1 showing China Nominal GDP & Narrow / Broad Money (% 6m)

April / May numbers, however, have been distorted by a clampdown on the practice of banks making supplementary interest payments to circumvent regulatory ceilings on deposit rates. This appears to have triggered a large-scale outflow from corporate demand deposits.

The April / May drop in six-month narrow money momentum into negative territory was entirely due to a plunge in demand deposits of non-financial enterprises (NFEs), with household and public sector components little changed – chart 2.

Chart 2

Chart 2 showing China True M1 Breakdown (% 6m)

Where has the money gone? The answer appears to be into time deposits (included in M2ex) and wealth management products (WMPs), with a small portion used to repay debt.

NFE demand deposits contracted by RMB3.82 trillion in April / May combined. Their time and other deposits grew by RMB1.14 trillion over the same period. Total sales of WMPs with a term of six months or less, meanwhile, were unusually large, at RMB2.60 trillion, according to data compiled by CICC.

It has been suggested that banks were paying supplementary interest to meet lending targets – the additional payments gave NFEs an incentive to draw down credit lines while leaving funds on deposit at the lending bank (“fund idling” or “roundtripping” in UK parlance). Repayments of short-term corporate loans, however, were a relatively modest RMB0.53 trillion in April / May.

The appropriate response to regulatory or other distortions to monetary aggregates is to focus on a broadly-defined measure that captures shifts between different forms of money.

Chart 3 includes the six-month rate of change of an expanded M2ex measure including short-maturity WMPs. While momentum is stronger than for M2ex – and not quite at a record low – a decline since December 2023 continued in April / May, suggesting still-deteriorating economic prospects.

Chart 3

Chart 3 showing China Narrow / Broad Money with Adjustment for WMPs (% 6m)

New Parliament House in New Delhi, at night.

The futility of pollsters was on full display in India, Mexico and South Africa this month. Prime Minister Narendra Modi’s BJP fell short of expectations for a landslide in India. In Mexico left-wing party Morena took the presidency as expected, but came surprisingly close to a supermajority in Congress. In South Africa, the dismal performance of ruling party ANC opens up a new era of coalition politics.

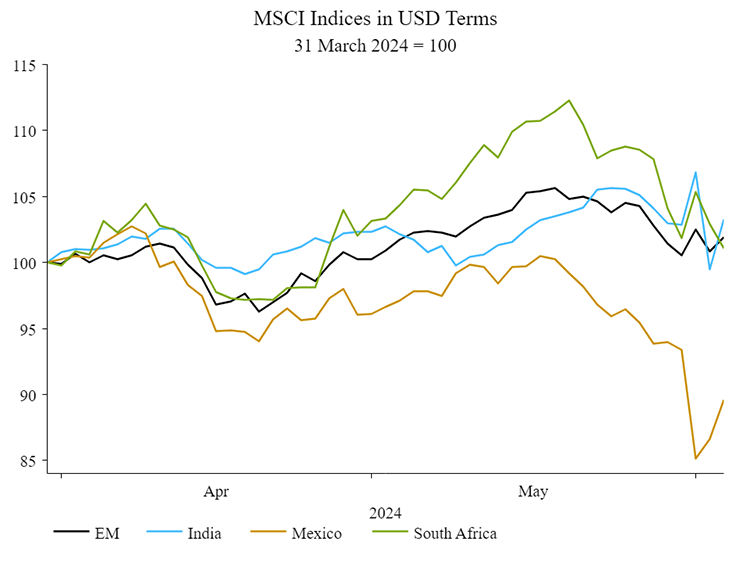
Political risk spiking in these countries has fuelled some wild swings in their stock markets.

All three markets took a hit on election uncertainty through May-June
Line graph showing index performance across India, Mexico and South Africa compared to Emerging Markets, from May to June 2024.
Source: NS Partners and LSEG Datastream.

Political risk is a factor that we consider as part of our macro analysis, which we know is crucial in EM investing. Fundamentals alone will not save you when the macro is headed south and the risk premium spikes. Outperforming in EM is about finding the right stock in the right country.

India

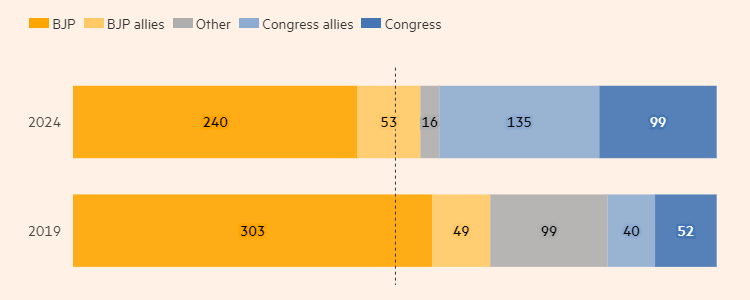
India’s Modi is set to become the first Prime Minister to serve three consecutive terms since the first post-colonial leader, Jawaharlal Nehru (Congress Party). Early June exit polls sent expectations (and stocks) soaring for Modi’s BJP to storm home to victory and claim as many as 400 hundred seats out of 543 in India’s lower house. Stocks exposed to infrastructure led the way on the expectation that a strong mandate would allow Modi to pursue a growth/investment-focused manifesto.

Instead, the BJP failed to claim a majority on its own and will have to rely on the support of regional allies to form government.

Seats won in the 2024 and 2019 elections
Bar graph comparing India election results in 2019 to 2024.
Source: Financial Times & Indian Electoral Commission, June 2024.

BJP strongholds crumble

The BJP ran on a record of positive reform over the past decade which has fuelled economic growth that has lifted millions out of poverty, cracked down on corruption, and built out electrification and sanitation access across the country. Tax reform also led to a doubling of tax revenue that has been reinvested into developing critical infrastructure, including freight railway lines and ports. Personalised rule and a presidential-style campaign positioned Modi as the figurehead of such rapid progress. At the outset of the campaign, approval ratings for the Indian PM were among the highest for any major democracy in the world.

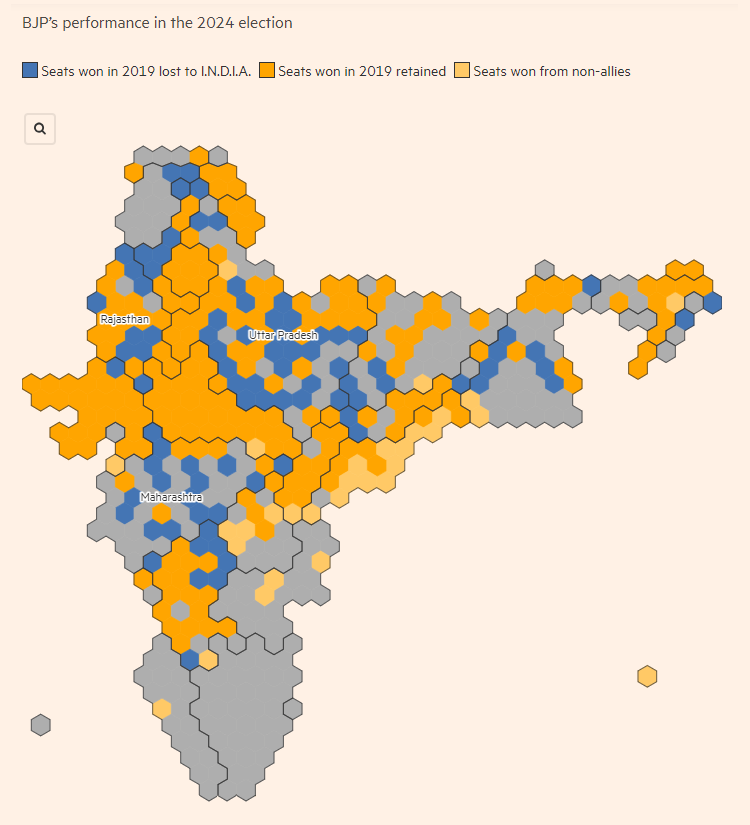
Yet the damaging swing against the BJP came from the party’s Hindi-speaking northern heartland. The opposition INDIA alliance was able to peel away BJP supporters by targeting poorer rural communities feeling the effects of high inflation and unemployment.

Loses in Uttar Pradesh were pivotal
Decorative.
Source: Financial Times, June 2024.

Positive structural story intact

Modi nevertheless claimed victory in a coalition with regional allies known as the National Democratic Alliance. Despite the surprise verdict, it is unlikely that Modi will be prevented from pursuing his agenda barring a few tweaks likely to increase social spending. This may dilute business sentiment and infrastructure spending in the near term, while consumption should remain robust.

One positive is that the result should alleviate fears Modi would use a supermajority to pursue regressive constitutional changes.  On the other hand, there also is a higher risk that a diminished Modi, a pro-growth moderate within the BJP, could cede influence to nationalist elements who will have more sway over a leadership transition.

Overall, our expectation for markets is some profit taking in the short term, while the long term structural story remains very positive.

South Africa

The African National Congress (ANC), South Africa’s dominant political party having governed since 1994, was rebuked by voters for having presided over a polycrisis in the economy, energy and law and order. The scale of the result was the surprise, while uncertainly looms over the make-up of a governing coalition.

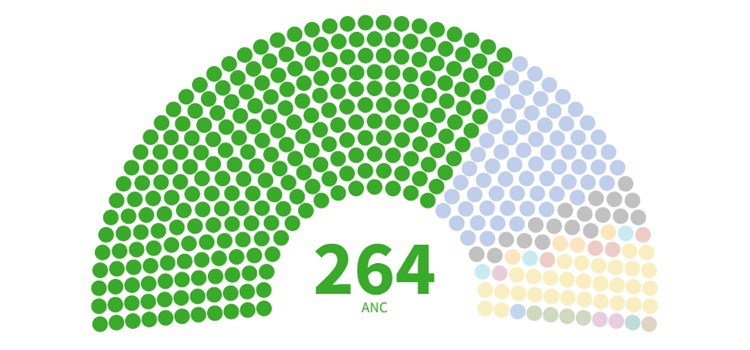
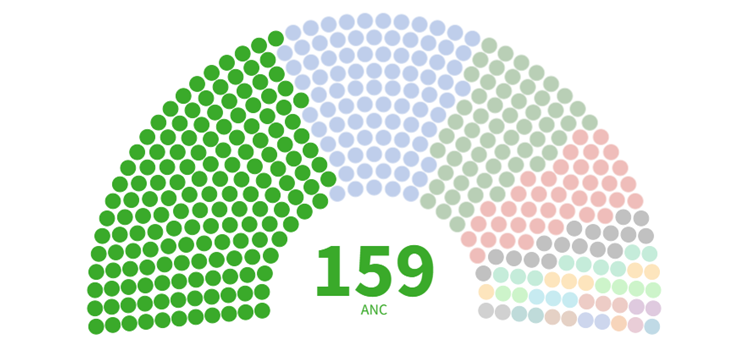
The ANC fell a long way short of a majority, commanding only 159 seats of the 400 in the National Assembly. The graphics below illustrate just how sharply ANC support has fallen from a once commanding position.

2009 ANC National Assembly share
Decorative.

2024 ANC National Assembly share
Decorative.
Source: Daily Maverick, May 2024.

The result could mark the beginning of a new era of politics in South Africa. Much like with the decades-long decline of the Congress party in India, the ANC as a post-colonial liberation movement finds itself out of step with the challenges that confront the country today.

Uncertainty and opportunity

The horse trading to form a coalition government within the next two weeks is now underway. The worst outcome, a deal with a radical breakaway party such as disgraced former president Zuma’s MK, who wants to ditch South Africa’s constitution, is off the table, while a direct deal with Julius Malema’s socialist EFF won’t command a majority.

A coalition between ANC and the second largest party Democratic Alliance (DA) is clearly the outcome markets are cheering for, the most likely outcome is for the ANC to kick the can down the road through a multiparty alliance that should disintegrate within 12 months. The result of this may well be a broader re-alignment of South African politics. No doubt this will be a time of high uncertainty, but there is also a chance that some political creative destruction will act as a catalyst for positive change.

Mexico

While the election of Claudia Sheinbaum to Mexico’s presidency was widely expected, the surprise was her left-wing Morena party running close to a parliamentary supermajority. Mexican stocks tumbled 12% and the peso fell on the result as investors fret that a stronger mandate for Morena will allow Sheinbaum to carry on with the agenda of outgoing president Andrés Manuel López Obrador (AMLO).

AMLO’s chequered legacy

AMLO leaves office with high approval ratings owing in part to large cash transfers from the state and minimum wage hikes that lifted over five million Mexicans out of poverty during his term (The Economist (November 2023): Andrés Manuel López Obrador has reduced poverty in Mexico, but he could have done better). In contrast to India’s Modi alleviating poverty through reform-driven economic growth, critics argue AMLO achieved this by diverting funds away from education and healthcare.

Is Morena a threat to Mexico’s democratic institutions?

Crucially for investors, AMLO and Morena are pursuing policies that could threaten Mexico’s institutions. Institutional quality is a key factor in determining whether a country moves up the economic development ladder. Throughout his term, AMLO threatened to attack institutions on the notion that they have been corrupted by neoliberal partisans. His term also saw the military play a growing role in domestic affairs, becoming involved in major infrastructure projects, tourism and customs oversight, and the militarisation of domestic security as a response to rising cartel violence (which proved ineffective).

Investors fear that a strengthened mandate will allow Sheinbaum (or even an outgoing AMLO) to undermine judicial independence, and pursue plans to eliminate autonomous government agencies overseeing telecoms, energy and access to information, as well as weaken electoral supervisory bodies.

Hopes for fiscal discipline

Finance Minister Ramírez de la O has been credited with steering AMLO away from the fiscal profligacy characteristic of so many socialist leaders in Latin America. Markets have welcomed his return in Sheinbaum’s cabinet, with the leader tweeting a series of pledges concerning the economy following a recent meeting with the Minister:

  1. A fiscal consolidation in 2025 of 3% of GDP to stabilize public finances and the overall debt/GDP ratio;
  2. Maintain an open dialogue with the investor community and rating agencies to reiterate the new government’s priorities: economic stability, fiscal prudence and feasible fiscal targets.
  3. Work closely with Pemex [state-owned oil company] and take advantage of the government’s support in Congress to “optimize the use of public resources.”
  4. Reiterate to international organizations and private investors that the government’s project is based on fiscal discipline, preserving and protecting Banco de México’s independence, a commitment to the rule of law, and incentivising domestic and international private investment.

We are encouraged that the incoming administration is clearly looking to soothe frayed market nerves.

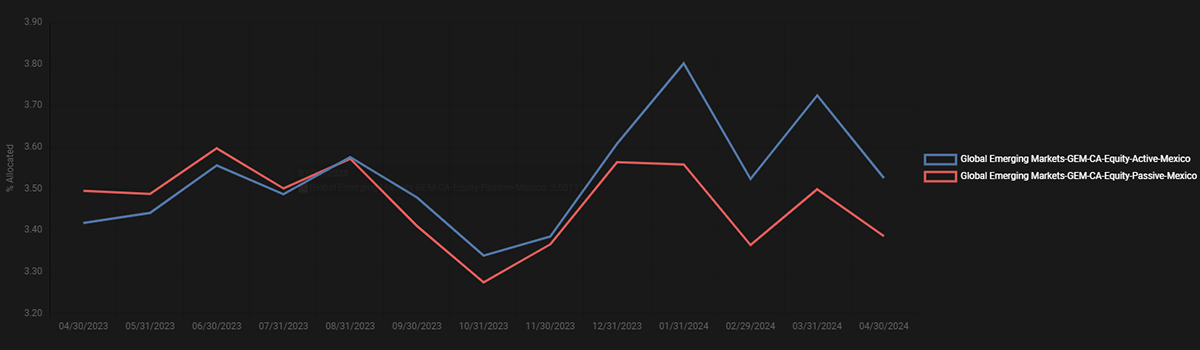
Mexico has been a favourite for most GEM managers

We have been in the minority of GEM investors to remain underweight the market on concerns over political risk, an overvalued currency and exposure to a US slowdown.

GEMs active vs. passive country allocations
Line graph comparing global emerging markets active and passive index country allocations from April 30, 2023 to April 30, 2024.
Source: EPFR, June 2024.

That’s not to say there isn’t real potential – the trend of global supply chain reshoring and Mexico’s geographic proximity to the powerhouse economy of the US leaves it well-positioned to harness a major structural tailwind in the years ahead.

However, making the most of this opportunity hinges on the dynamism of Mexico’s private entrepreneurs, supported by strong institutions. The question is whether Morena under Sheinbaum can resist their worst instincts.