Global six-month real narrow money momentum is estimated to have rebounded from a sharp December fall to reach a new high in January, based on monetary data covering three-quarters of the G7 plus E7 aggregate tracked here – see chart 1.

Chart 1

200226c1i.png

The December drop was the basis for an earlier forecast that a rise in global manufacturing PMI new orders would fizzle out in Q2, with a relapse into Q3. The January monetary news suggests that the current upswing will be sustained into H2 – chart 2.

Chart 2

Chart 2 showing Global Manufacturing PMI New Orders & G7 + E7 Real Narrow Money (% 6m)

Both G7 and E7 components contributed to the January rise in real money momentum, but the G7 series is estimated to have remained below a February 2025 peak, whereas E7 momentum reached a new high – chart 3.

Chart 3

200226c1i.png

The rebound in global real money growth has likely restored a positive differential with industrial output momentum, suggesting “excess” money support for markets – chart 4.

Chart 4

20251127_NSP_MMM_Image_WP-Thumbnail.jpg

Previous posts noted that EM equities outperformed DM on average historically in months following positive readings of this differential and the E7 / G7 real money growth gap (allowing for reporting lags). The joint condition was in place in nine of the last 12 months. Chart 5 shows the performance of a monthly switching rule that prefers EM only when the joint condition is satisfied, otherwise reverting to DM. The latest news implies that the rule will continue to favour EM in March and, probably, April.

Chart 5

Mixed flash PMIs

A January post noted the possibility that global six-month real narrow money momentum had crossed below industrial output growth in December, suggesting less favourable monetary conditions for markets. Recent dramatic sell-offs in some speculative assets could reflect such a shift.

The suggestion is still tentative: additional – but not yet complete – December data indicate that the two series converged rather than intersected – see chart 1.

Chart 1

060226c1

Will a cross-over be confirmed soon? Monetary prospects are uncertain but stronger January manufacturing PMI results suggest a rise in six-month industrial output momentum in early 2026.

In data since 1970, global equities outperformed US dollar cash significantly on average in months following a positive reading of the gap between real money and output momentum (by 12.0% annualised). (The calculation allows for reporting lags.)

By contrast, negative gaps were associated with average underperformance in the following month (of 5.5%).

Needless to say, these averages conceal frequent “misses” in both directions.

The six-month real money / output momentum gap was positive in most months in 2025. It was, however, negative in 2023 and much of 2024, when equities rallied strongly.

As previously discussed, the six-month gap was a misleading guide to “excess” money over this period because of a large monetary overhang from the money growth surge in 2020-21.

A simple way of illustrating this overhang is to compare five-year growth rates of real money and industrial output. Real money growth was still much higher in 2023 – chart 2.

Chart 2

060226c2

The five-year gap turned negative last year. It last closed in the early stages of the GFC bear market.

Back then, the six-month gap had been negative for more than a year. The closing of the five-year gap was followed by an acceleration of the market decline.

With the five-year gap already negative, a negative shift in the six-month gap could be reflected in more immediate market weakness than in 2007-08.

Global manufacturing PMI new orders recovered strongly in January following a November / December relapse. Both the fall and revival had been signalled by money trends: global six-month real narrow money momentum declined sharply in April / May 2025 but rebounded into November. The seven-month interval between a (revised) May low in real money momentum and the December PMI trough matches the lead time at the prior two turning points – see chart 1.

Chart 1

030226c1

The rise in real narrow money momentum into November suggests that the PMI upswing will extend into Q2. As foreshadowed in a previous post, however, real money momentum declined sharply in December, retracing most of its May-November gain. Accordingly, the manufacturing bounce is expected to fizzle out in Q2, with renewed weakness into Q3.

Real narrow money momentum has slowed across most major economies, though to varying degrees. China and India have contributed most to the global decline, although the Indian number remains strong – chart 2.

Chart 2

030226c2

The US series shown incorporates an adjustment for a suggested distortion to demand deposit data affecting the M1A measure used here. However, substituting the official M1 measure – unaffected by the mooted distortion – for M1A would give the same current reading.

Eurozone momentum remains above the US level while the UK has recovered from significant weakness in mid-2025, suggesting improving relative economic prospects. Still, both series have stalled at modest levels, cautioning against optimism.

Japanese real narrow money contraction continues to flag a policy mistake, while a faster decline in Brazil argues for urgent rate cuts. (The Brazil manufacturing PMI was the weakest in the global stable in January.)

Elsewhere, prior strength in Australian real narrow money momentum is consistent with recent upbeat economic news but a slowdown since September suggests that prospects were cooling before this week’s rate hike.

Global manufacturing PMI new orders fell back in November, consistent with the forecast here of an inflection weaker from late 2025, based on a slowdown in six-month real narrow money momentum from a March peak – see chart 1.

Chart 1

091225c1

The PMI decline was mirrored by an alternative global survey indicator derived from national polls. The alternative indicator has been undershooting the PMI recently, reflecting relative weakness in the US ISM and Chinese NBS surveys compared with their S&P Global counterparts – chart 2.

Chart 2

091225c2

The suggestion of a turning point is supported by the OECD’s G7 composite leading index. The one-month change in the index usually moves ahead of the PMI and peaked in July, easing further in November. The slowdown, however, has been minor and numbers can be revised – chart 3.

Chart 3

091225c3i

A recovery in real money momentum since July suggests a PMI low around end-Q1. Still, approaching downswings in the stockbuilding and housing cycles argue against a sustained rebound.

PMI swings are typically mirrored by the price relative of cyclical equity market sectors (excluding IT and communication services) versus defensive sectors (excluding energy). Relatives peaked in September, consistent with the October PMI high, but have rallied with rising Fed rate cut expectations – chart 4. A further PMI decline into late Q1 could be associated with renewed underperformance.

Chart 4

091225c4


Global money trends suggest that major economic weakness will be deferred until later in 2026.

Six-month real narrow money momentum in the G7 and seven large emerging economies recovered further in October, almost returning to its March high – see chart 1.

Chart 1

271125c1

The fall from March into the summer is expected here to be reflected in a slowdown in industrial momentum – as proxied by global manufacturing PMI new orders – into late Q1 2026. The recent money growth recovery suggests a partial PMI rebound in Q2 – chart 2.

Chart 2

271125c2

The cyclical framework used here implies rising recession risk, with the stockbuilding and housing cycles in time windows to begin downswings. Monetary weakness would signal that a negative scenario is crystallising. The latest numbers appear to signal a delay.

The composition of the money growth rebound gives pause. The return towards the March high has been driven by further strength in the E7 component, with G7 real money momentum lagging significantly – chart 3.

Chart 3

271125c3

Narrow money trends are respectable or strong across major EMs, with the exception of Brazil – chart 4.

Chart 4

271125c4

Soft G7 growth reflects a slowdown in the US and continued – though moderating – weakness in Japan and the UK. Eurozone momentum rose further last month, though remains unexceptional.

Chart 5

271125c5

The forecast that global manufacturing PMI new orders will inflect weaker from a Q4 peak is supported by the “internals” of the October survey.

While new orders rose on the month, the increase was smaller than had been suggested by DM flash surveys, reflecting an EM decline led by China and Korea – often global bellwethers.

Firms were gloomier despite the orders uptick, with the future output index falling to its lowest since April in the wake of the “Liberation Day” shock. In contrast to new orders, this component is below its post-2015 average – see chart 1. (So is the corresponding services gauge.)

Chart 1

051125c1

Pessimism may partly reflect an inventory overhang: indices measuring additions to stocks of purchased inputs and finished goods were in the 82nd and 97th percentiles of their long-run ranges (i.e. since 1998) respectively last month – more evidence that the global stockbuilding cycle is peaking.

Purchases of inputs boost orders of supplier firms. Accordingly, the new orders index is positively correlated with changes in the stocks of purchases index. The latter is likely to fall from its currently extended level. Even a stabilisation would imply a decline in the rate of change, in turn suggesting softer new orders – chart 2.

Chart 2

051125c2

Global manufacturing deceleration is often associated with underperformance of cyclical equity market sectors. The price relative of MSCI World non-tech cyclical sectors versus defensive sectors ex. energy is below a September peak – chart 3.

Chart 3

051125c3

Cyclical earnings are more at risk when pricing power is weak. The output price index has fallen back and is close to its 2010-19 average, while delivery delays remain below the corresponding average, suggesting excess capacity and / or inventories – chart 4.

Chart 4

051125c4i

The suggestion from cycle analysis of significant economic weakness in 2026-27 has yet to receive confirmation from monetary trends.

Global six-month real narrow money momentum recovered for a second month in September, though remains below a March peak. Nominal money growth firmed in August-September, offsetting a small rise in six-month consumer price momentum – see chart 1.

Chart 1

291025c1

The March peak was expected here to be reflected in a peak in global manufacturing PMI new orders around October. DM flash results are consistent with a further rise in the orders index this month – chart 2.

Chart 2

291025c2

The latest monetary numbers suggest that the expected PMI fall will be contained, at least through Q1 2026. This is compatible with cycle analysis: the stockbuilding cycle is judged to be at the start of a downswing, so the maximum negative impact could be delayed until H2 2026 or even later.

The minor recovery in global real narrow money momentum since July has been driven by China and Japan, with US, Eurozone and UK readings little changed and Indian growth moderating – chart 3.

Chart 3

291025c3

Real money momentum remains below its long-run average – chart 4.

Chart 4

291025c4

Could recent / prospective central bank easing sustain monetary reacceleration, extending economic cycles? While possible, there are also reasons for expecting renewed monetary weakness.

First, policy stances are mostly still restrictive, and real rates may fall by less than nominal as inflation declines further.

Secondly, recent issues in private credit may cause banks to slow lending to shadow banks and tighten standards more generally, dampening (broad) money growth.

Thirdly, money trends reflect as well as influence economic cycles. Stockbuilding cycle downswings are associated with reduced demand for short-term business credit, which could contribute to monetary weakness.

Finally, the demand to hold narrow money is related to consumer / business confidence and spending intentions. Labour market weakness could lead to greater consumer caution, while ongoing trade dislocation and policy uncertainty may dampen business animal spirits.

Cycle analysis suggests economic and market weakness in 2026-27. A recent monetary slowdown is consistent with this perspective but needs to extend to confirm a negative scenario.

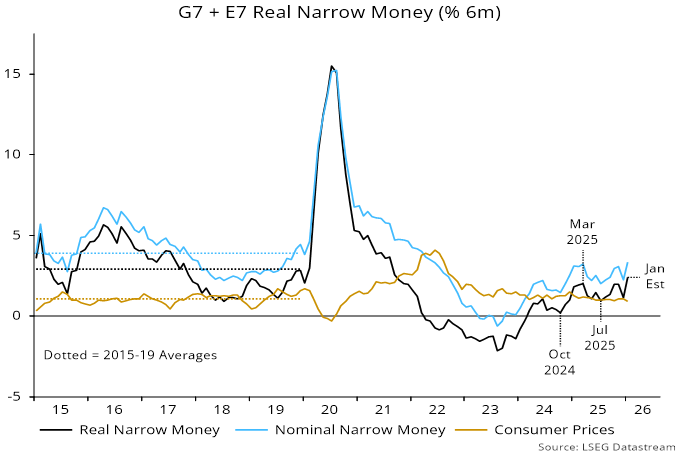
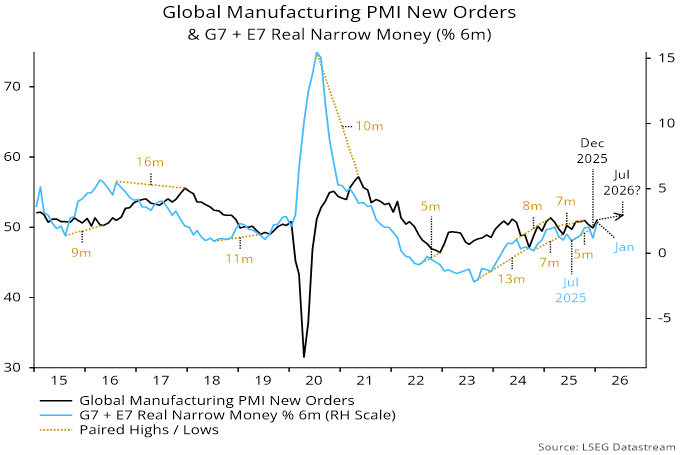
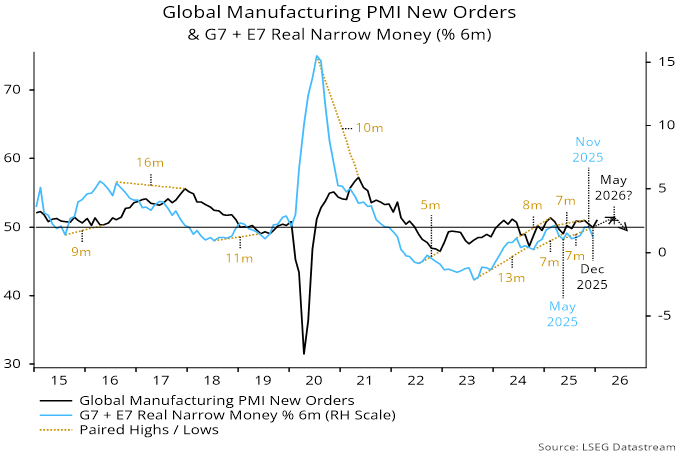
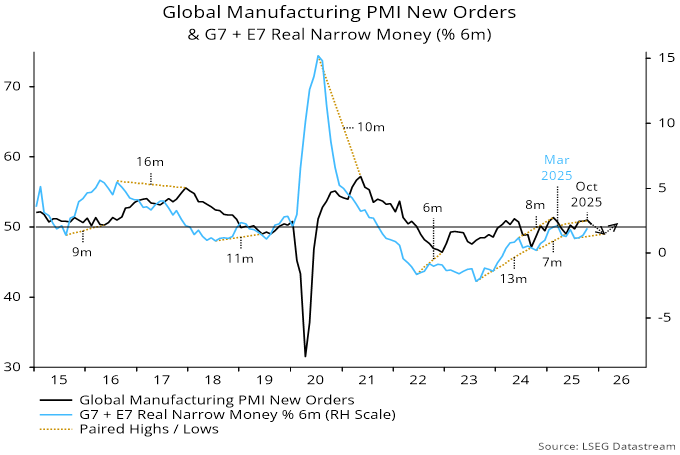
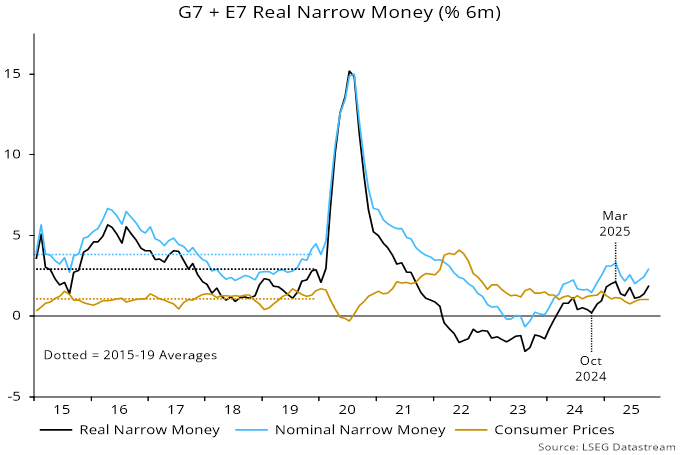
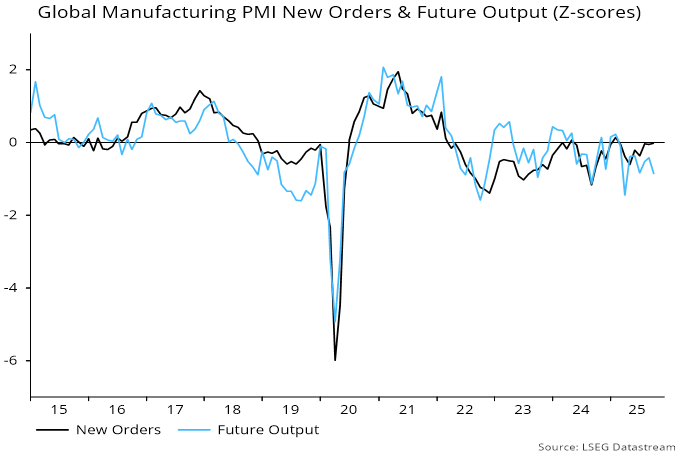
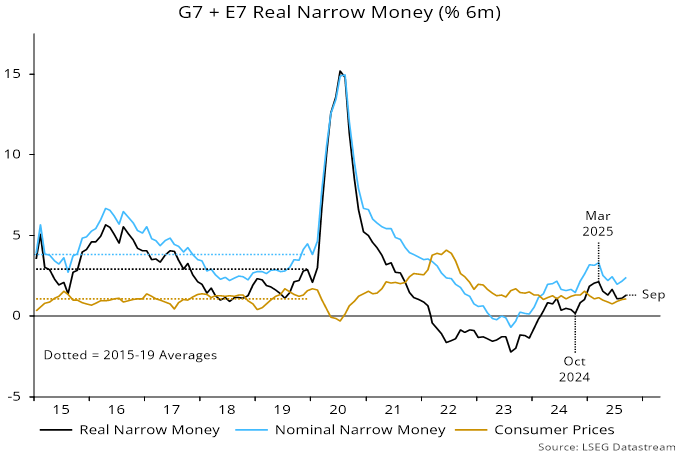
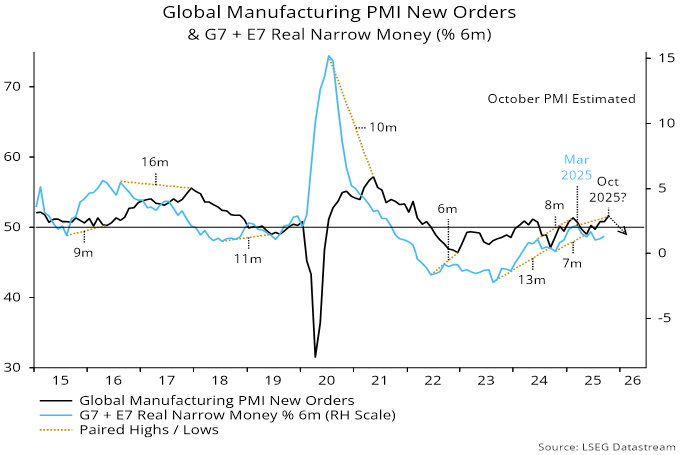
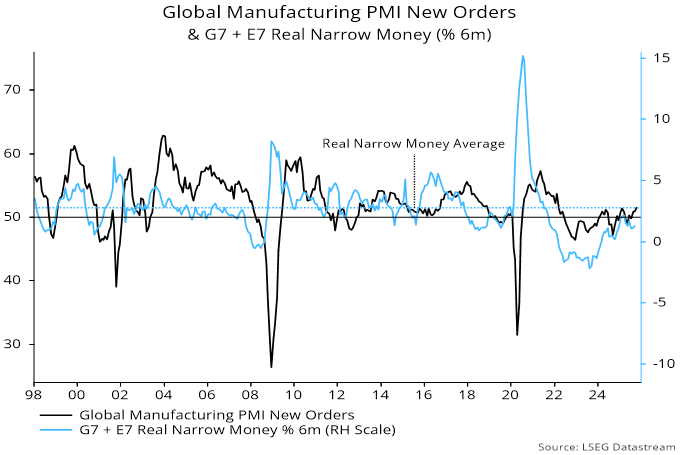
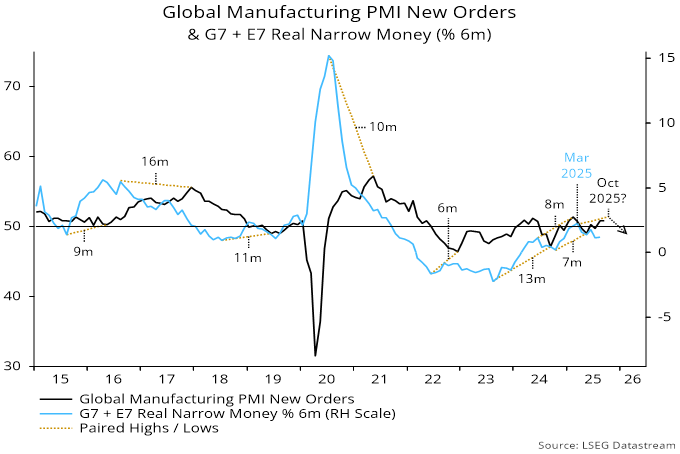
Global (i.e. G7 plus E7) six-month real narrow money momentum moved sideways in August, following a March-July fall. The previous low in real money momentum in October 2024 was reflected in a low in global manufacturing PMI new orders in May. Accordingly, the monetary slowdown since March could be mirrored by a peak and reversal in PMI new orders from around October – see chart 1.

Chart 1

031025c1

The fall in real money momentum has been modest but an expected economic slowdown could become more serious than others in recent years, for two reasons. First, the stockbuilding and housing cycles have entered time windows to begin downswings. Secondly, labour markets are showing signs of weakness for the first time since the pandemic recession, raising the risk of self-reinforcing negative dynamics.

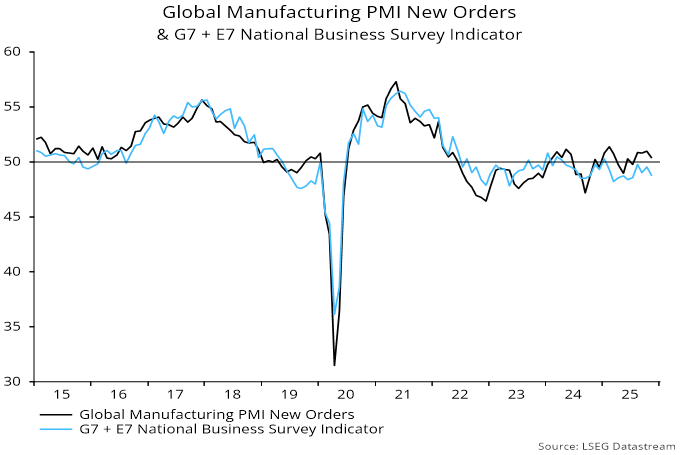
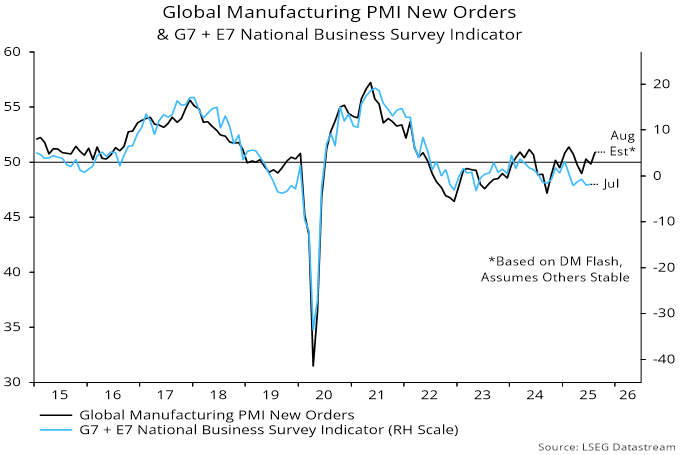
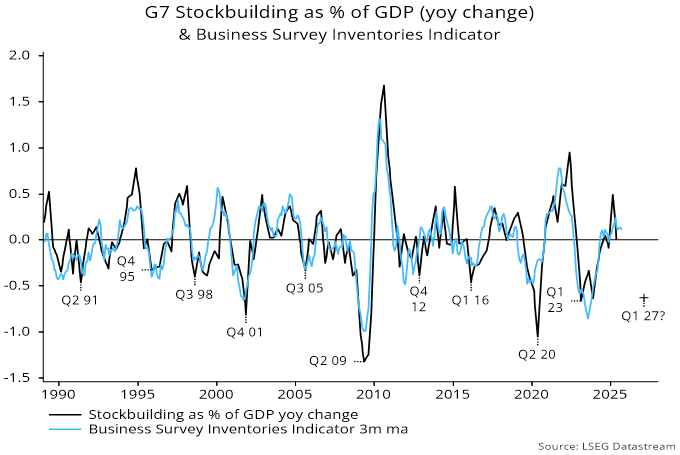
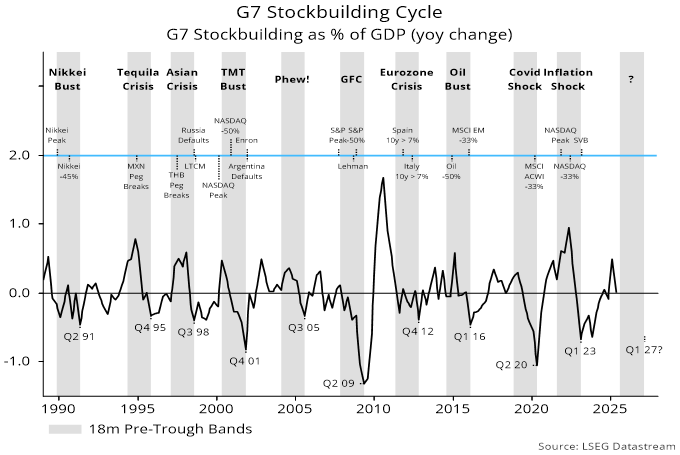
The working assumption here has been that the stockbuilding cycle will reach another low in Q1 2027, implying a four-year current cycle versus a 3.5-year historical average. Recent G7 national accounts stockbuilding data as well as an indicator based on business surveys are consistent with the cycle being at or near a peak – chart 2.

Chart 2

031025c2

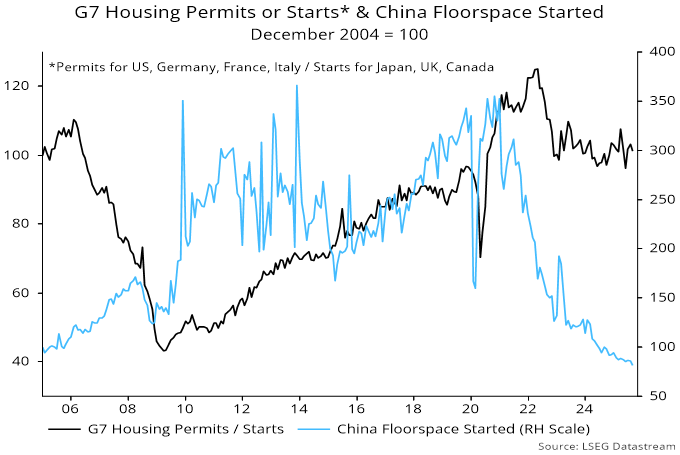
The housing cycle bottomed in 2009 and has ranged between 15 and 25 years historically, averaging 18 years. The pandemic-related money growth surge of 2020-21 appears to have resulted in the current cycle peaking early, in 2022. G7 housing starts or permits have been range-bound since early 2023 but rising unemployment could be the trigger for a break lower.  China has been leading in the current cycle and starts are still falling – chart 3.

Chart 3

031025c3

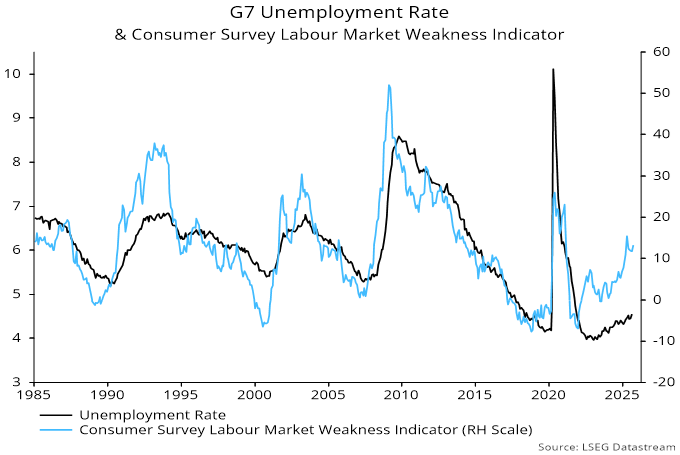
The suggestion that unemployment is on a rising trend is supported by consumer surveys, with a composite G7 indicator of negativity recently reaching a four-year high – chart 4.

Chart 4

031025c4

Monetary policy easing, if sufficiently dramatic, could short-circuit negative cyclical dynamics. A dramatic move could occur conventionally if additional evidence of labour market weakness is accompanied by a downside inflation surprise, or unconventionally if the Trump administration succeeds in gaining control of the Fed. A large cut in US rates would magnify US dollar weakness, forcing other central banks to follow.

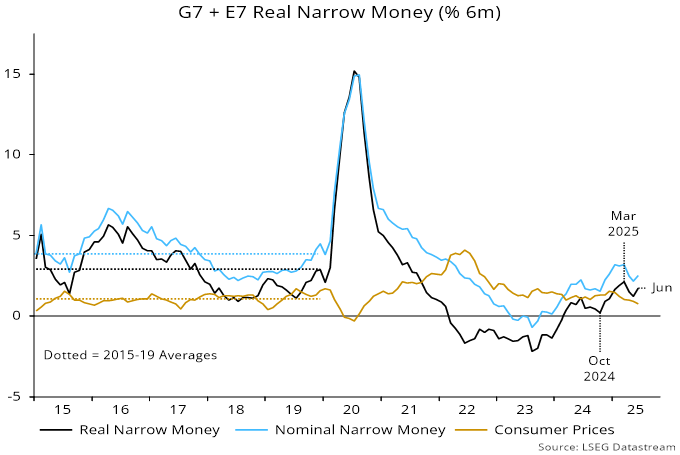
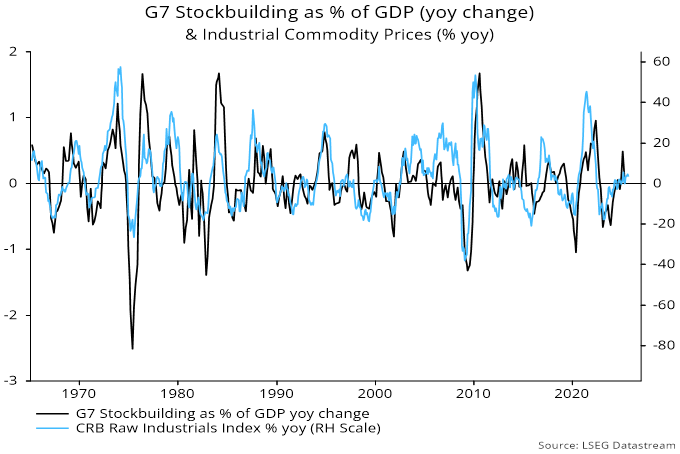
Inflation prospects are judged here to be favourable, at least through early 2027. G7 annual broad money growth remains subdued (4.3% in August versus a 2015-19 average of 4.5%), while stockbuilding cycle downswings are usually associated with weakness in commodity prices – chart 5.

Chart 5

031025c5

Near-term US inflation numbers, however, will continue to reflect tariff effects. Elsewhere, central bankers focused on fighting the last war may be slow to respond to favourable surprises. As an example of hawkish bias, the ECB has gone on hold despite forecasting below-target inflation.

The alternative route to a large near-term fall in rates – a take-over of the Fed by the executive branch – still seems far-fetched, with the administration lacking scope to push through personnel changes on the necessary scale.

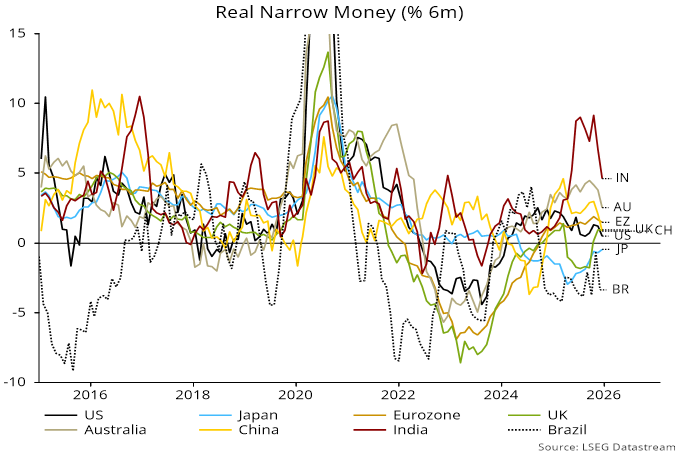
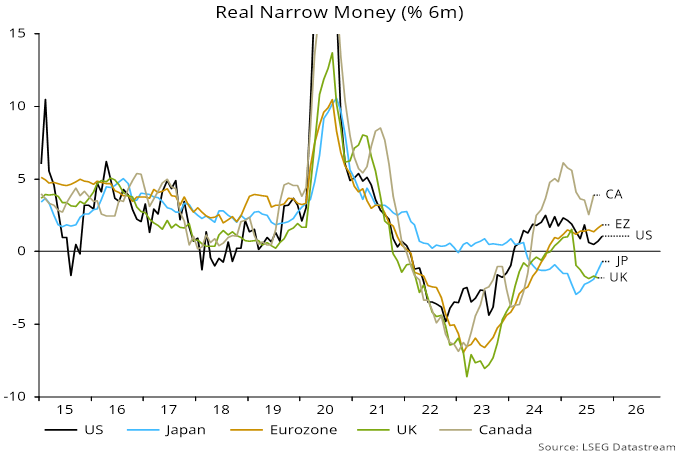
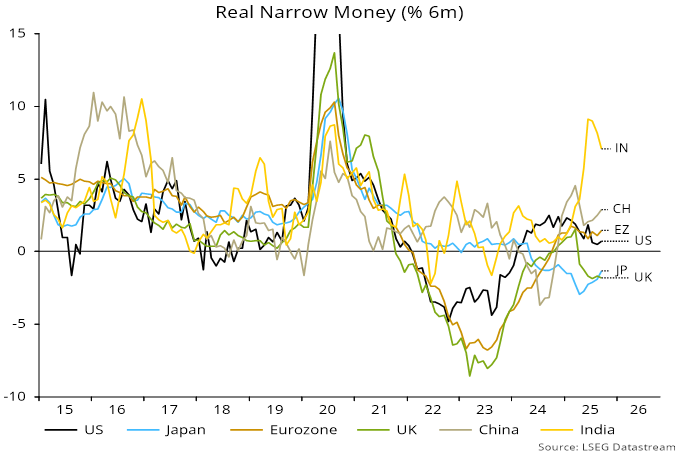
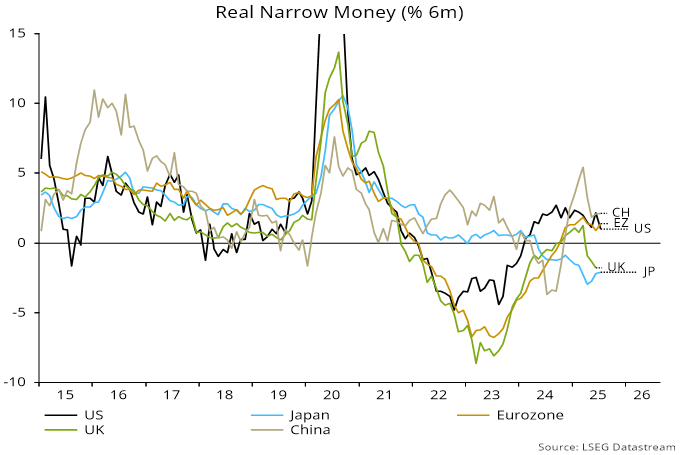
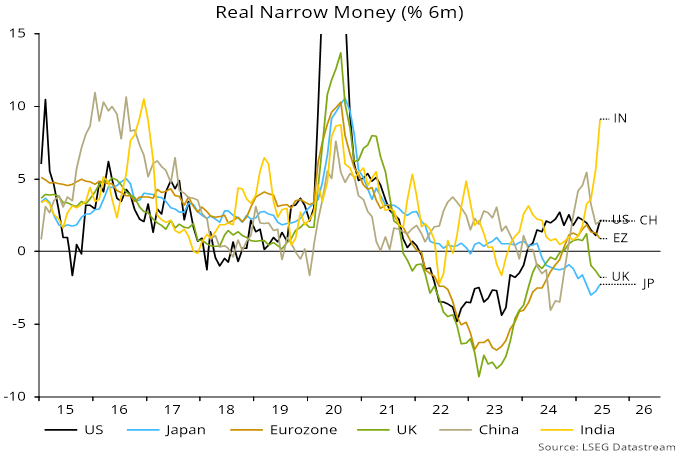
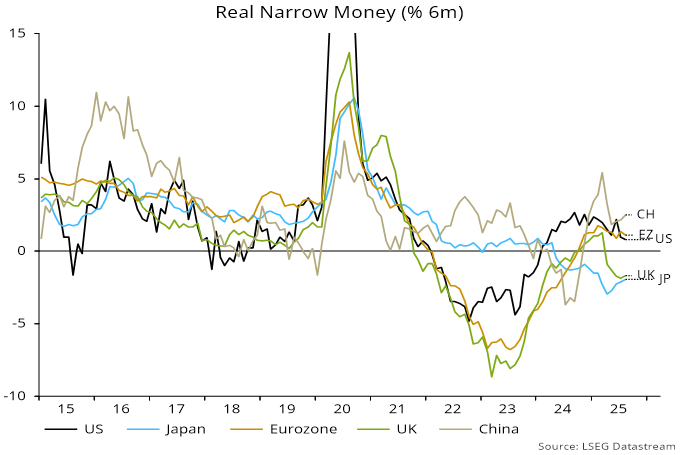
Among major economies, six-month real narrow money momentum is weakest in Japan and the UK, suggesting over-restrictive monetary policies and downside economic risk. Momentum is similar in the US and Eurozone but the US has slipped to a 17-month low, while a Eurozone recovery has stalled since Q1 – chart 6.

Chart 6

031025c6

The Eurozone story seems to be that higher bond yields triggered by fiscal loosening along with a stronger euro have offset ECB easing. Optimists argue that German fiscal stimulus is only now arriving but the impact could be balanced by an early stockbuilding downswing – the stockbuilding share of GDP rose by 0.7 pp in the year to Q2 and is above its long-run average.

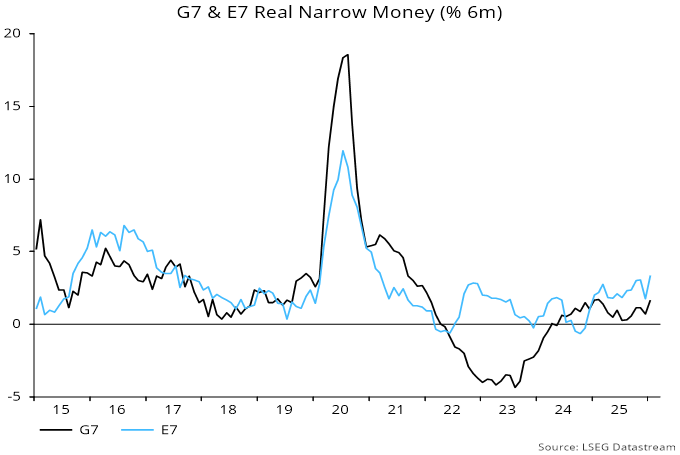
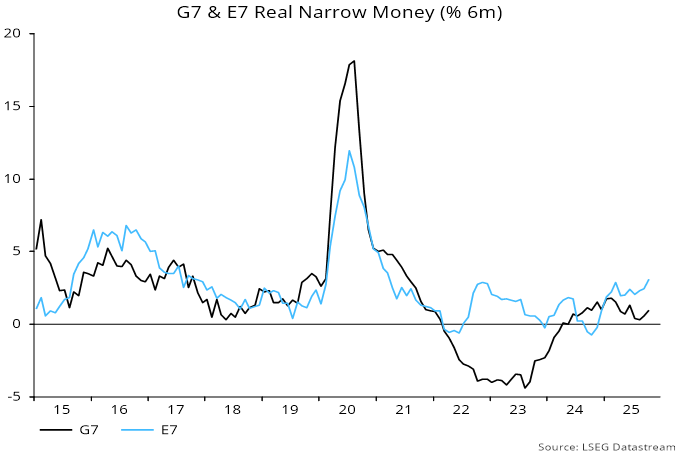
The recent decline in global six-month real narrow money momentum has been driven by the G7 component. Chinese momentum fell back in April-May but has recovered since, giving a modestly favourable signal for economic prospects.

The assumption of a Q1 2027 trough implies that the current stockbuilding cycle has entered its final 18 months. The 18-month windows before previous lows were usually negative for risk assets and marked by credit events or “crises” – chart 7. The possibility of simultaneous housing cycle weakness, as well outsized gains in the upswing phase of the current cycle, suggests greater-than-normal downside.

Chart 7

031025c7

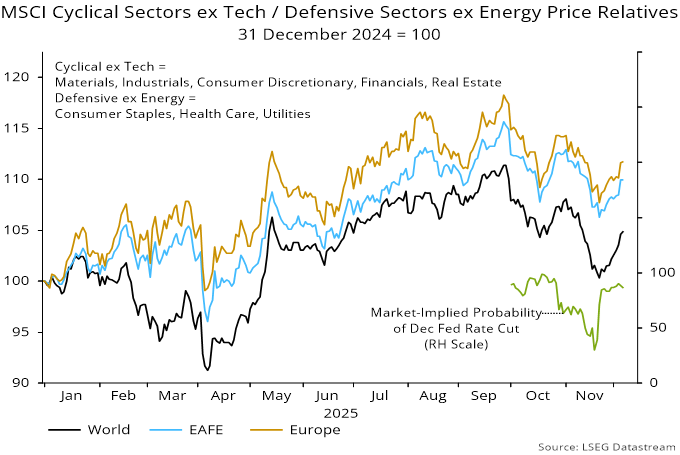
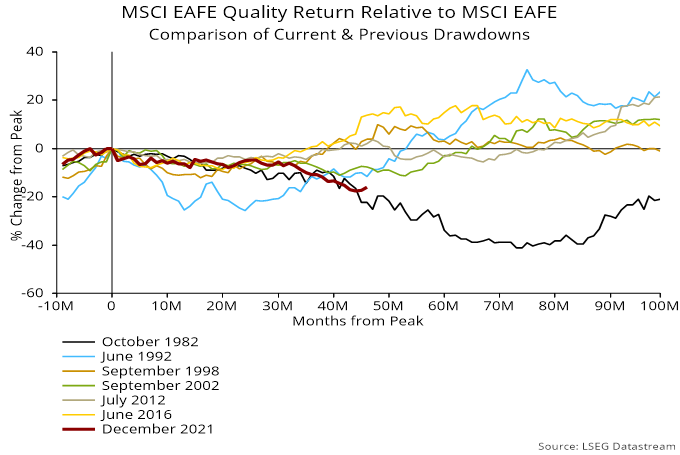
These 18-month windows were usually associated with cyclical equity market sectors underperforming defensives, following outperformance during the upswing (unusually strong in the current cycle). Stylewise, there was a weak tendency for quality to outperform, while momentum lagged its upswing gains significantly. The recent drawdown in relative performance of the MSCI EAFE Quality index versus MSCI EAFE was exceeded in magnitude and duration only in the early 1980s – chart 8.

Chart 8

031025c8

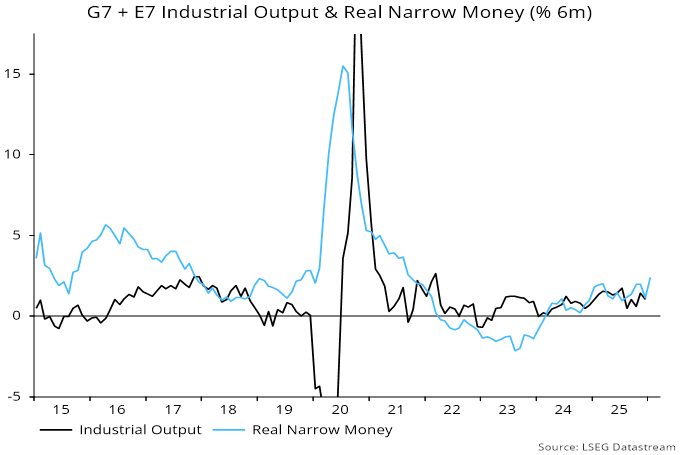
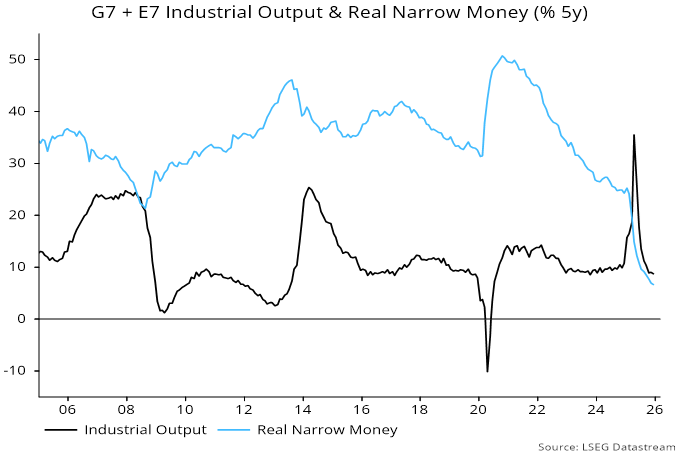
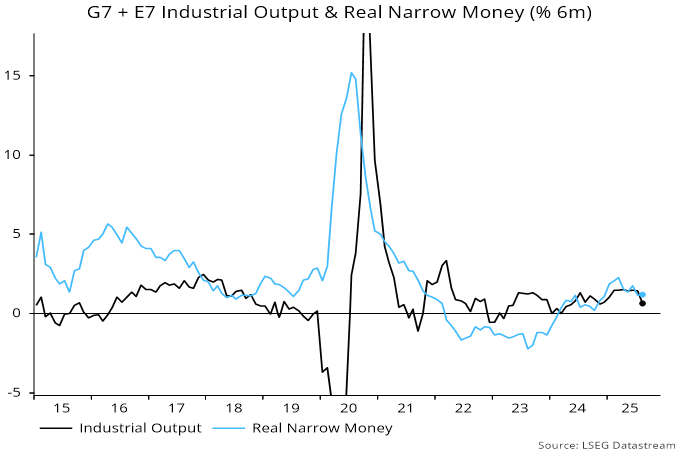
Six-month growth rates of global real narrow money and industrial output have been tracking closely with a small monetary excess on the latest readings – chart 9. The strength of markets appears to reflect a rise in the financial velocity of money more than ample liquidity, suggesting reversibility in the event of a cyclical deterioration in sentiment.

Chart 9

031025c9

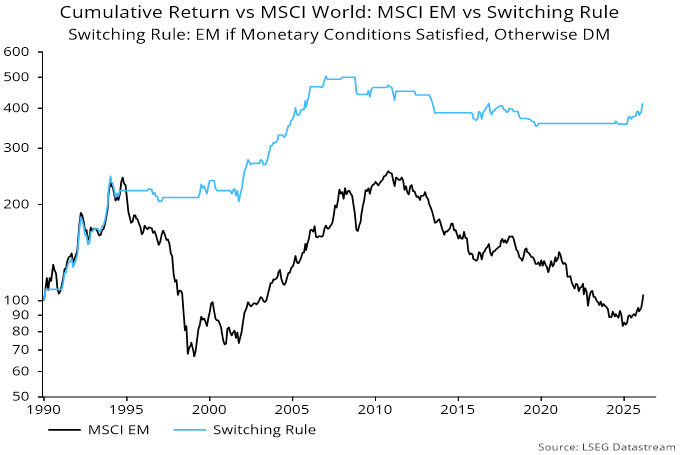
The two monetary conditions historically favouring EM equities – E7 real money growth above the G7 level and global real money growth above industrial output expansion – are currently in place, suggesting EM outperformance in the event of a near-term further rise in markets.

Global six-month real narrow money momentum – a key leading indicator in the forecasting approach used here – is estimated to have fallen to its lowest since November / December in July, based on monetary data for countries with a combined 88% weight.

The resumption of a decline from a March peak reflected both a slowdown in nominal money growth and a small rise in six-month CPI momentum (which, however, remains slightly below its 2015-19 average) – see chart 1.

Chart 1

280825c1

A rise in real money growth between October 2024 and March suggested that the global economy would regain momentum in H2 2025 after a weak start to the year. Tariff effects cloud interpretation but PMI results are consistent with this forecast, with August DM flash numbers reading across to a rise in global manufacturing PMI new orders to a six-month high – chart 2.

Chart 2

280825c2

An alternative indicator calculated here using national survey data has been lagging the PMI but may also have increased in August. US regional Fed manufacturing surveys are pointing to stronger ISM results.

Still, the slowdown in real money momentum since March suggests that survey strength, if confirmed, will prove short-lived, with another inflection weaker before year-end – chart 3.

Chart 3

280825c3

The July decline in global real money momentum mainly reflected a US fall to its lowest since March last year – chart 4. US money growth may have been supported in H1 by a run-down of the Treasury’s cash balance at the Fed. With the debt ceiling now raised, the balance stabilised in July and has increased in August, with financing plans targeting a further rise, i.e. Treasury cash-raising may drain money from private accounts.

Chart 4

280825c4

Real money momentum rose slightly in China and the Eurozone but remains below recent peaks, with Japan little changed in negative territory and UK July numbers yet to be released.

Global (i.e. G7 plus E7) six-month real narrow money momentum – a key indicator in the approach followed here – recovered in June but remains below a multi-year high reached in March.

The June rise reflected a small rebound in nominal money growth combined with a further fall in six-month consumer price momentum, to its lowest since 2020 – see chart 1.

Chart 1

310725c1

CPI momentum is now below its 2015-19 average, vindicating the « monetarist » forecast that global inflation would fully reverse its 2021-22 spike once the ridiculous – but thankfully temporary – policy-driven money growth surge of 2020-21 had passed through the system.

The rise in six-month real narrow money momentum into March suggested that global economic growth would strengthen into late 2025, following a weak start to the year related to a monetary slowdown into October 2024.

Front-running of US tariffs, however, may have supported growth during H1, with H2 payback liable to dampen the expected pick-up. The March peak in real money momentum, meanwhile, suggests economic deceleration from late 2025.

The June rise in global real money momentum was driven by a further pick-up in India following a dovish RBI shift coupled with a surprise rebound in the US. By contrast, Eurozone momentum slowed for a third month while UK contraction intensified, almost catching down to Japan – chart 2.

Chart 2

310725c2

Interpretation of recent US money numbers is clouded by disruption to fiscal financing from the delay in lifting the debt ceiling. An associated run-down of the Treasury’s cash balance at the Fed may have supported H1 money growth, suggesting a drag as the balance is restored to its prior level.

(“Austrian” measures of the money stock include government deposits, on which basis US six-month narrow money momentum was negative in June. Such an approach is not endorsed here, for the obvious reason that – unlike for private sector agents – government money holdings are unrelated to future spending.)

Still, recent sideways movement of US six-month real narrow money momentum versus a slowdown in the Eurozone and outright weakness in Japan / the UK suggests improving US relative economic prospects while casting doubt on forecasts of further equity market underperformance.