The ECB and Bank of England have signalled an expectation of policy tightening, while the latest Fed statement maintained an easing bias. Economic / monetary conditions argue for the opposite relative positions.

Eurozone core inflation is lower than in the US, labour market indicators softer, money growth slower and credit conditions weaker. The UK resembles the Eurozone in most of these respects.

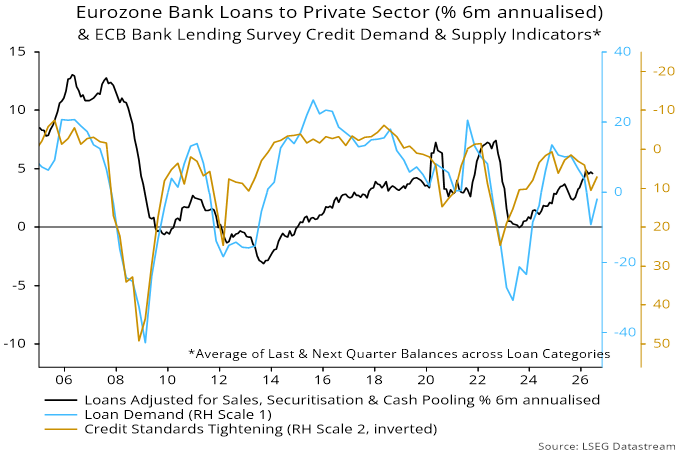
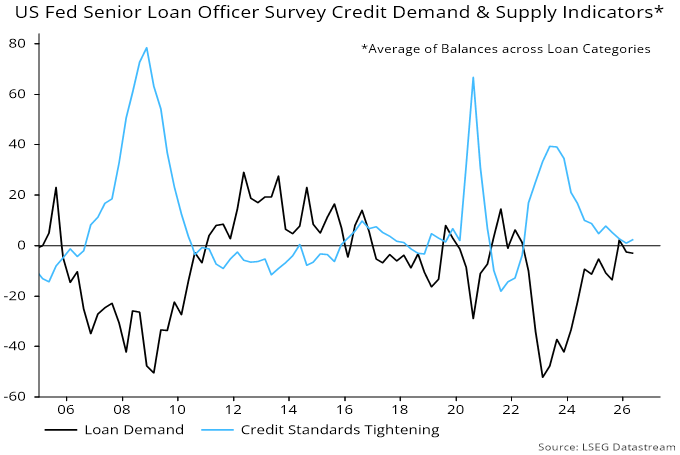
Last week’s ECB bank lending survey signalled tighter credit standards and notably weaker loan demand – see previous post and chart 1. The corresponding Fed survey this week, by contrast, shows little change from last quarter – chart 2. (Note that the Fed survey asks about current conditions, while the ECB survey additionally canvasses expectations.)

Chart 1

NSP-WeeklyBulletin-20260420-Chart13-1024×889-1.png

Chart 2

NSP-WeeklyBulletin-20260420-Chart12-1024×888-1.png

The last Bank of England credit conditions survey, released on 9 April, was benign but partly pre-dated Gulf hostilities.

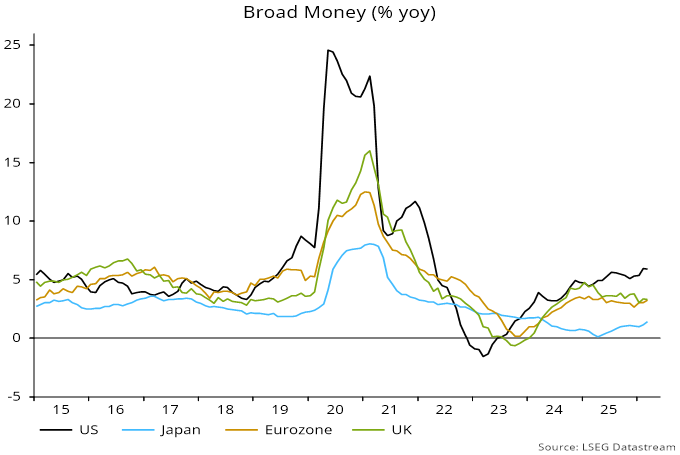
US annual broad money growth – as measured by “M2+”* – was 5.9% in March versus an increase of 3.3% in both Eurozone non-financial M3 and UK non-financial M4 – chart 3.

Chart 3

NSP-WeeklyBulletin-20260420-Chart12-1024×888-1.png

US annual core PCE inflation rose to 3.2% in March versus a Eurozone core CPI increase of 2.2% in both March and April. UK core CPI inflation was 3.1% in March but the number still incorporates a boost from large rises in water bills and vehicle excise duty last April – the policy-adjusted measure calculated here was 2.7%.

The US trimmed mean PCE inflation measure preferred by incoming Fed Chair Warsh was 2.4% in March but there are no Eurozone / UK numbers for comparison. The calculation excludes 31% and 24% respectively of the top and bottom “tails” of the distribution, i.e. included items have a combined weight of only 45%.

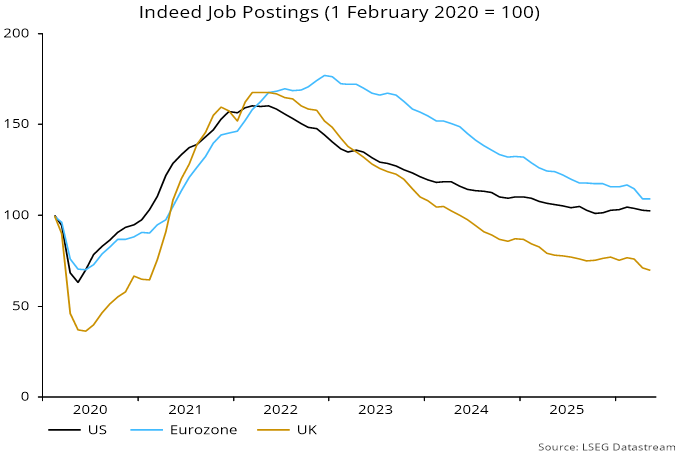
Labour demand is weaker in the Eurozone / UK than the US, with Indeed job postings making new lows versus US stability – chart 4.

Chart 4

NSP-WeeklyBulletin-20260420-Chart13-1024×889-1.png

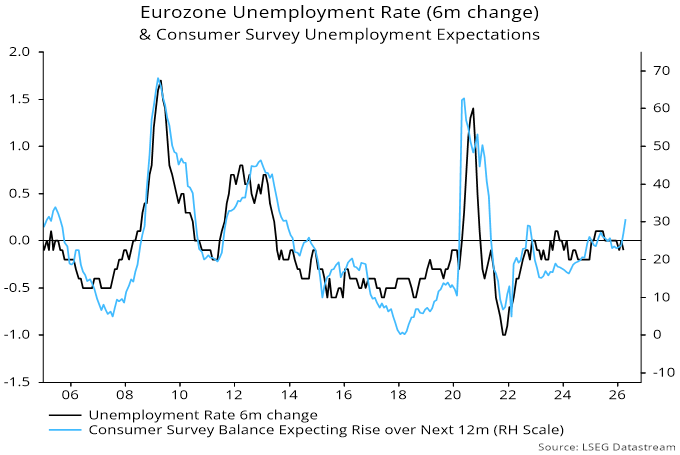
Unemployment expectations have picked up in the EU Commission consumer survey, suggesting a rise in the official jobless rate – chart 5.

Chart 5
NSP-WeeklyBulletin-20260420-Chart14-1024×850-1.png

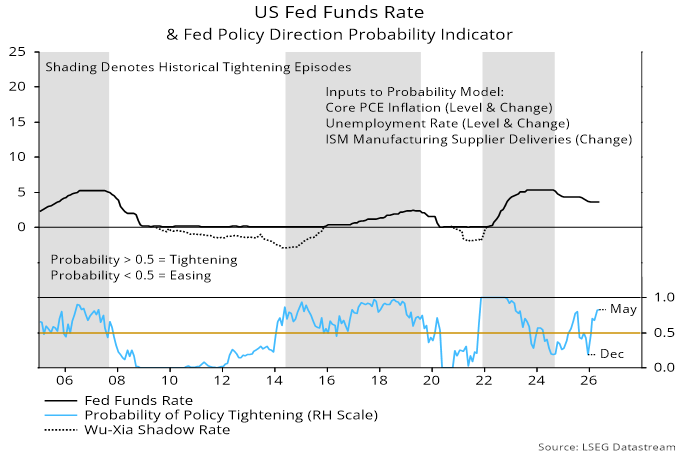
The Fed model used here predicts policy direction based on current and lagged values of annual core PCE inflation, the unemployment rate and the ISM manufacturing delivery delays index. A rise in the latter has pushed the model estimate further into the tightening zone – chart 6.

Chart 6

230426c1.png

*M2+ adds large time deposits at commercial banks and institutional money funds to the official M2 measure.

The April bank lending survey signals an “endogenous” tightening of monetary conditions, which the ECB should – but won’t – offset with policy easing.

A previous post suggested that the Gulf War III shock would interact with concerns about private credit exposure to cause banks to tighten lending standards. April Fed and ECB lending surveys were flagged as important markers.

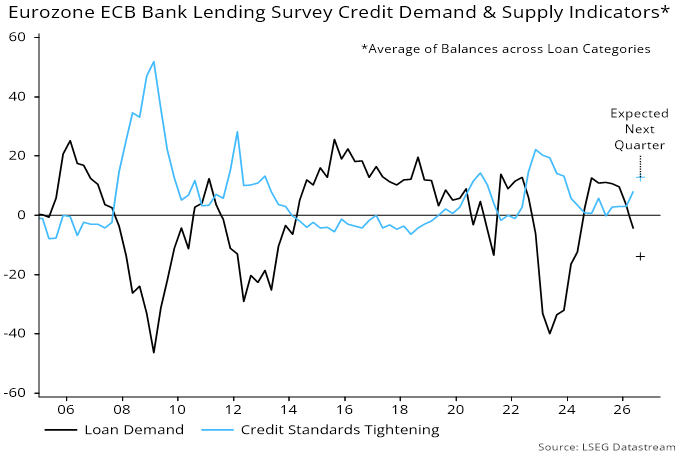
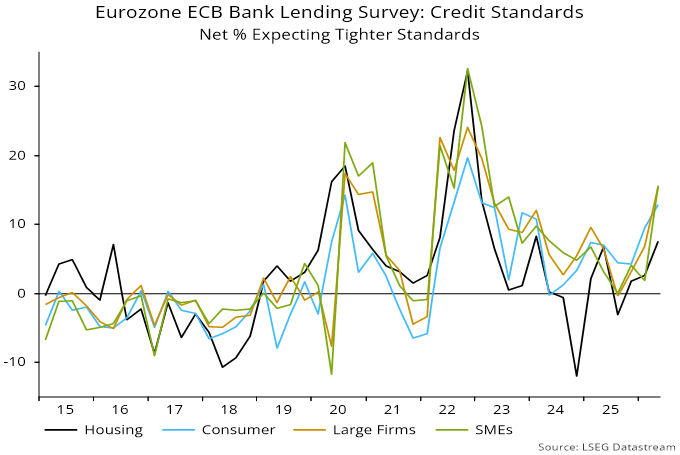
The ECB survey confirms the thesis, showing significant rises in reported and expected credit tightening balances across loan categories – see chart 1. (The Fed survey is expected next week.)

Chart 1

NSP-WeeklyBulletin-20260413-Chart8-1024×889-1.png

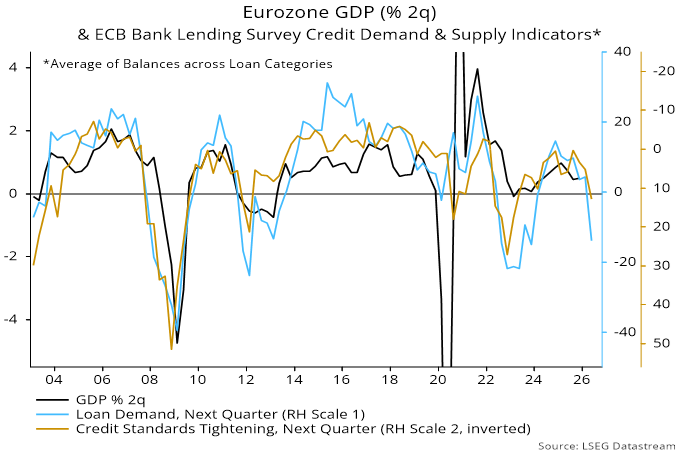
The shock, however, appears to have had an even greater negative impact on the risk appetite of borrowers. An average of expected demand balances fell to a level historically consistent with GDP contraction – chart 2.

Chart 2

NSP-WeeklyBulletin-20260413-Chart9-1024×889-1.png

With both supply and demand weakening, loan growth may slow sharply, in turn threatening a fall in meagre broad money expansion. Non-financial M3 rose by only 3.3% in the year to March.

Prospective monetary weakness argues for pre-emptive policy loosening but the ECB, following new Keynesian convention, is focused on upside risk to inflation expectations. Expectations measures, unlike money trends, failed to give timely warning of the 2021-22 inflation surge, contributing to policies remaining excessively loose. An opposite mistake may be brewing.

The Gulf War III energy shock has been compounded by a dramatic repricing of interest rate expectations, partly reflecting hawkish central bank communications, particularly from the ECB and Bank of England.

The central banks fear a repeat of the inflation upsurge around the Russian invasion of Ukraine, their accepted wisdom being that higher energy prices destabilised inflation expectations, resulting in significant “second-round” effects.

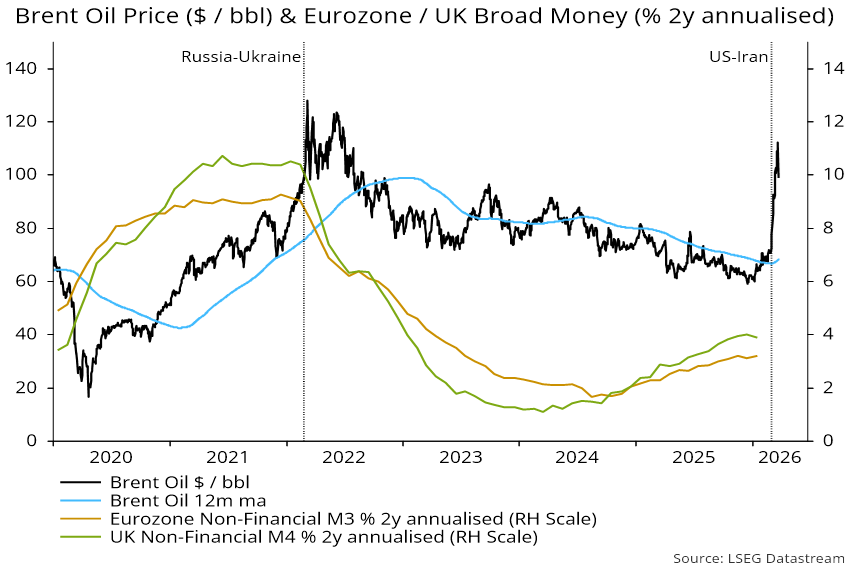
The “monetarist” view is that the impact of a shock on price- and wage-setting depends on the prevailing monetary environment. The Russia-Ukraine shock generated large second-round effects because it occurred against a backdrop of strong money growth. Eurozone and UK broad money – as measured by non-financial M3 and M4 – rose by 9.1% and 10.5% annualised respectively in the preceding two years – see chart 1.

Chart 1

Chart 1 showing Brent Oil Price ($ / bbl) & Eurozone / UK Broad Money (% 2y annualised)

The latest two-year growth rates, by contrast, are 3.2% and 3.9%, with little sign of acceleration in shorter-term data. Money to nominal GDP ratios have returned to around end-2019 levels. Unlike in 2022, there is no monetary “excess” to accommodate a sustained inflation rise.

Policy tightening against this backdrop would likely result in much more serious economic weakness than in 2022-23, with attendant risk of a medium-term inflation undershoot.

One caveat to a relaxed view of second-round effects is that political pressure to respond to a new cost-of-living shock could trigger a fiscal / funding crisis, forcing a return to QE that results in another money growth surge. Still, the suspension of central bank independence implied by such a scenario will be more likely if officials compound their 2021-22 policy error by making the opposite mistake now.

Eurozone and UK money trends have shown disappointingly small responses to policy easing, suggesting that rates remain in restrictive territory and casting doubt on hopes of stronger economic growth.

The preferred monetary aggregates here are “non-financial”, covering households and non-financial corporations. Money holdings of financial institutions are volatile and less informative about near-term economic prospects.

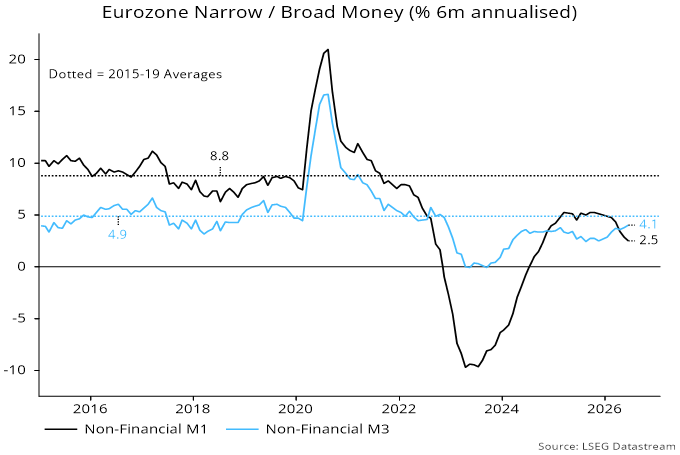
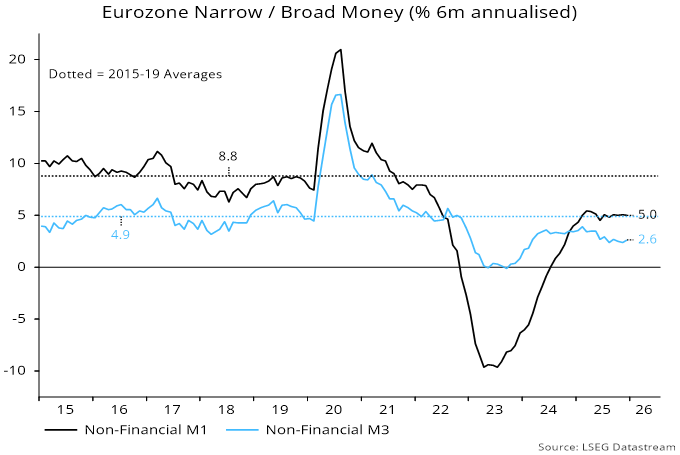
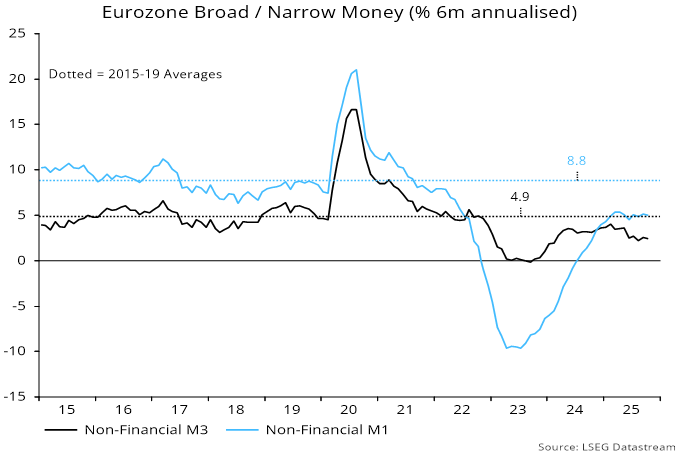
A recovery in six-month growth rates of Eurozone narrow and broad money stalled in early 2025 despite the ECB continuing to cut rates through June, with both well below pre-pandemic averages – see chart 1.

Chart 1

300126c1

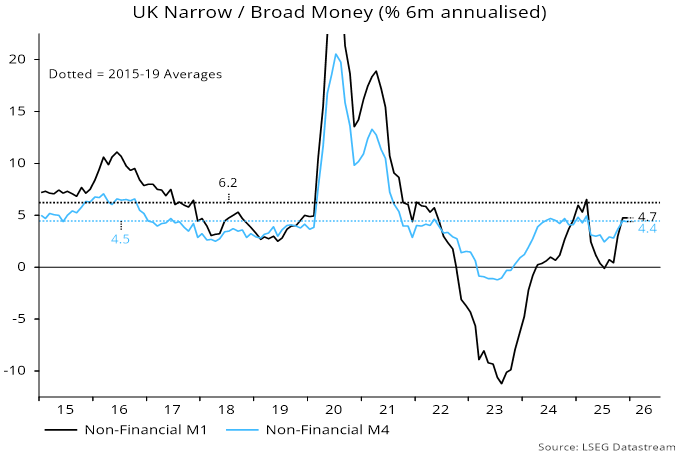
The UK profile is different. The laggardly pace of rate cuts appears to have contributed to a relapse in growth rates in H1 2025 but these recovered into November, moving sideways in December – chart 2.

Chart 2

300126c2

While suggesting UK relative improvement, narrow money expansion remains beneath its pre-pandemic average (and the Eurozone level), with annual broad money growth a below-par 3.8% (versus 2.7% in the Eurozone).

One reason for the disappointing responses is that policy rate cuts have yet to translate into a decline in longer-term yields. Relatedly, UK QT has been a significant and unnecessary drag.

A hopeful scenario is that low inflation implied by weak broad money trends will allow longer-term yields to subside. Still, additional policy adjustment will likely also be required to generate a monetary response sufficient to warrant economic optimism.

Eurozone monetary trends suggest that interest rates remain above a “neutral” level.

The ECB’s deposit rate has been stable at 2.0% since June, following a 200 bp reduction over the prior 12 months. Lower rates should be feeding through to money trends by now.

Six-month growth of non-financial M3, however, was 2.4% annualised in October, half its average in the five years before the pandemic and slightly below the level when rate cuts started.

Chart 1

031225c1

Non-financial M3 comprises broad money holdings of households and non-financial corporations (NFCs). Six-month growth of headline M3, including volatile financial sector money, was even weaker, at 1.8% annualised.

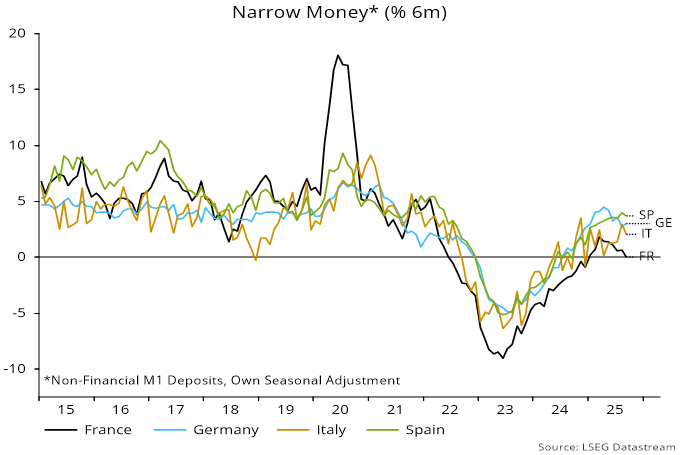
Narrow money growth – as measured by non-financial M1 – is stronger but also below its pre-pandemic average.

There is no sign of acceleration in the latest numbers, with three-month rates of change close to six-month levels.

Broad money probably needs to expand by at least 4% pa to accommodate potential growth of about 1.25% pa and 2% inflation, allowing for a long-run decline in velocity. (The ratio of nominal GDP to non-financial M3 fell by 1.9% pa on average over 2000-19.)

Money growth below this level implies downward pressure on output relative to trend and / or inflation – inconsistent with rates being at “neutral”.

Slow broad money growth is partly attributable to sluggish credit trends: lending to households and NFCs rose by 2.8% annualised in the six months to October, with momentum stable recently.

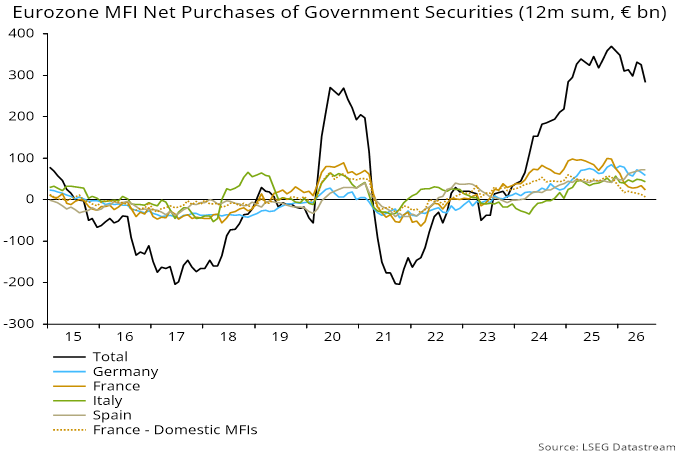
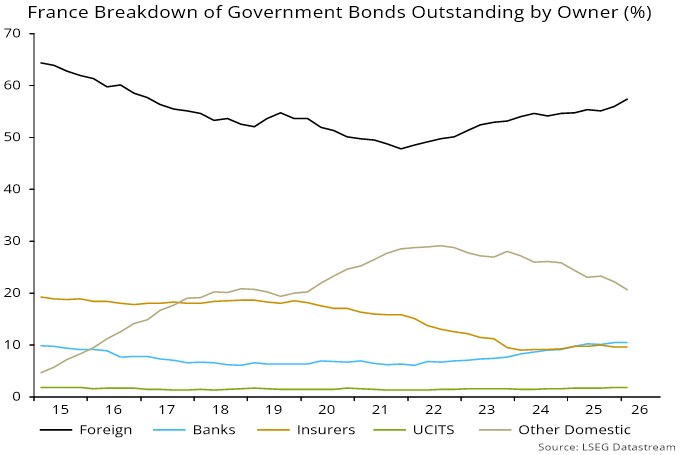
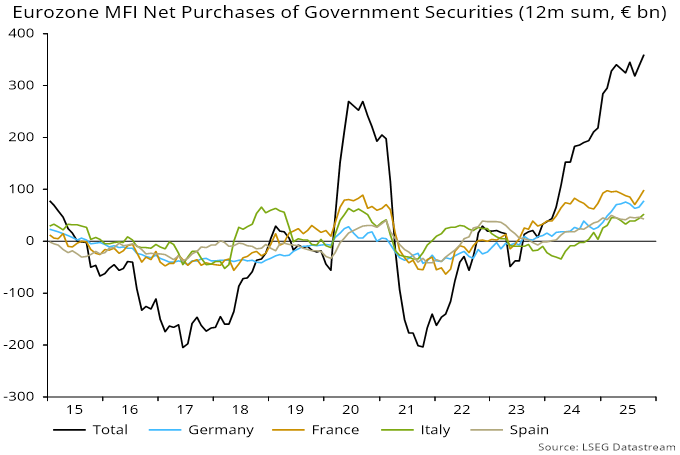
A drag from ECB QT, meanwhile, has been fully offset by solid buying of government bonds by banks. Purchases have been spread across countries but were largest in France over the past 12 months – chart 2.

Chart 2

031225c2

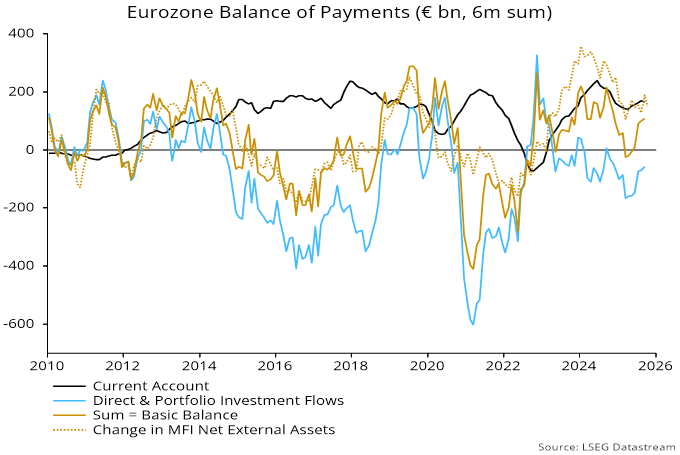
Money growth would have been weaker without support from external inflows, reflecting a basic balance of payments surplus and a corresponding rise in banks’ net external assets – chart 3.

Chart 3

031225c3

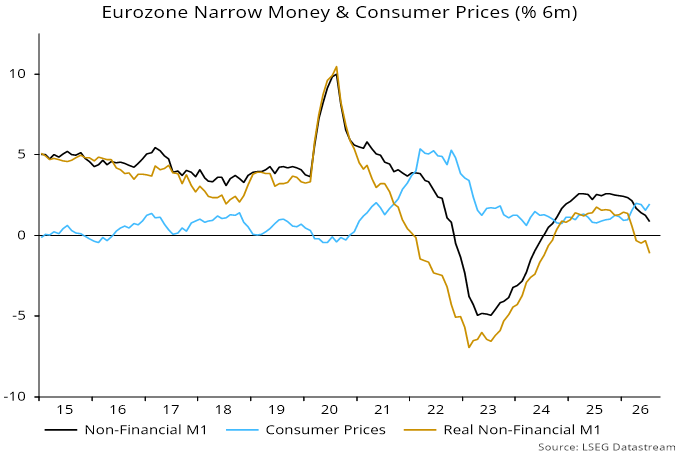
Eurozone narrow and broad money measures rose respectably on the month in September but six-month momentum remains sluggish, at roughly half the pre-pandemic pace – see chart 1.

Chart 1

281025c1

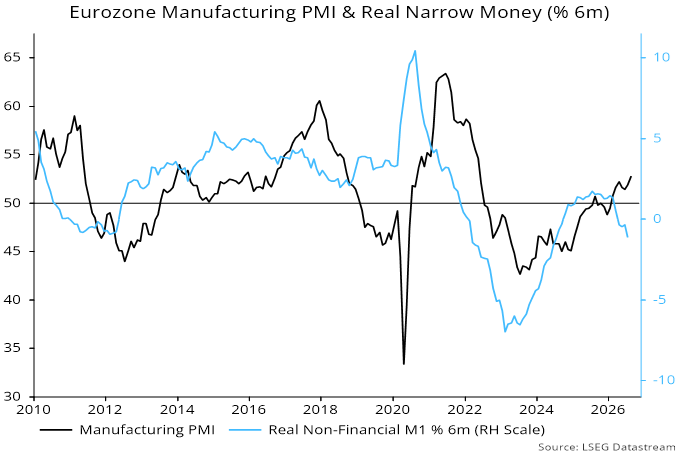
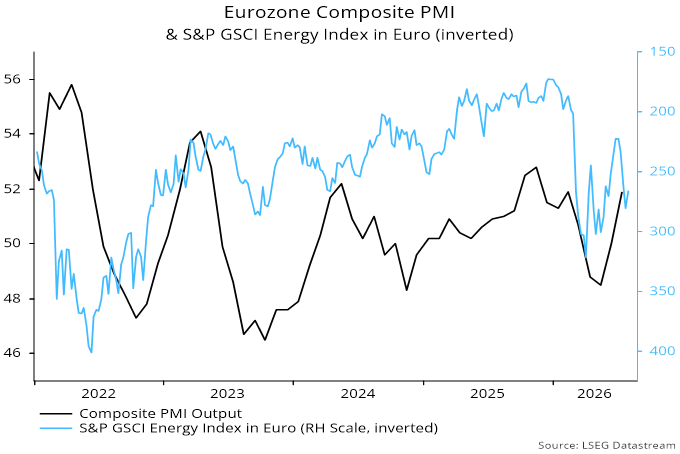
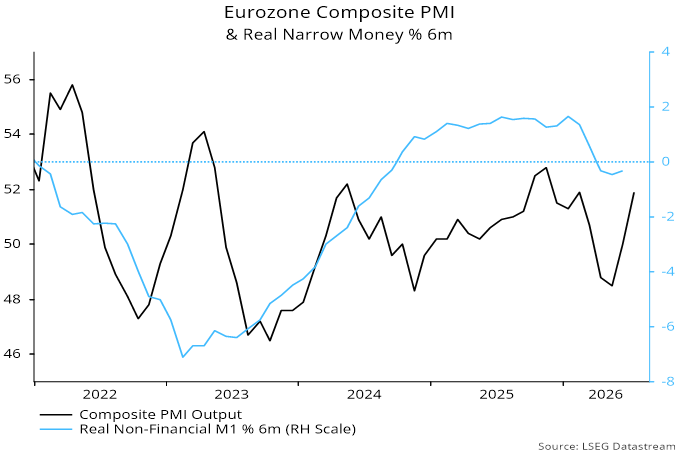
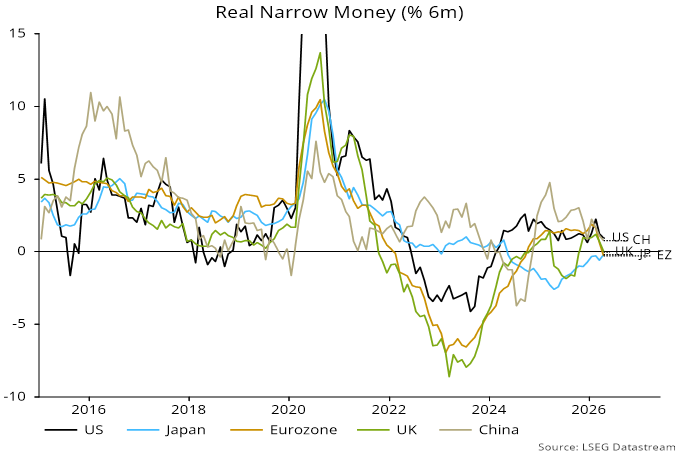
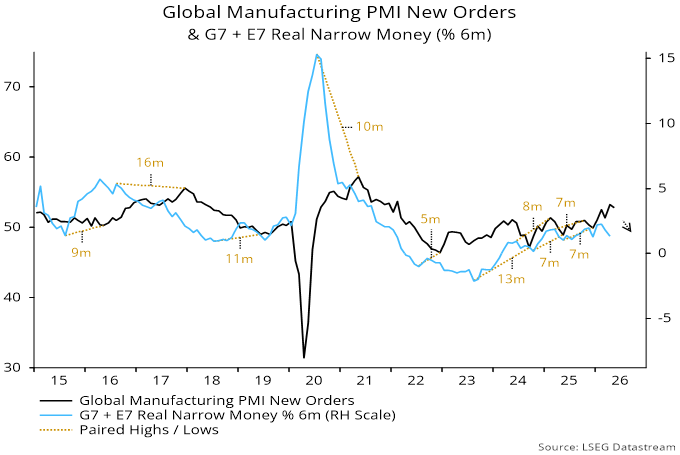
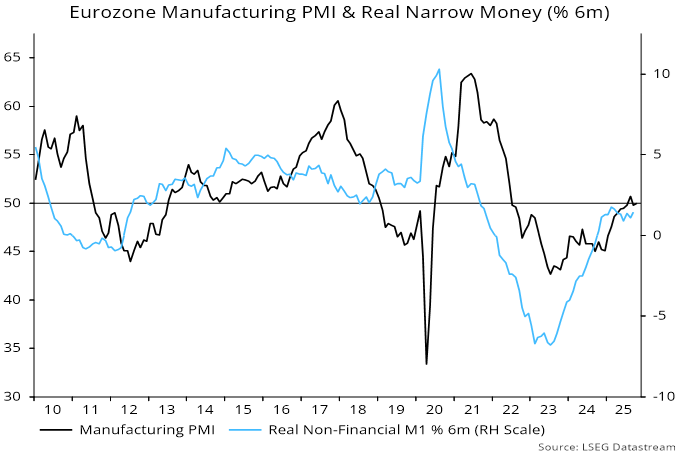
Six-month real narrow money momentum is below a peak reached in February, consistent with a stalled recovery in the manufacturing PMI – chart 2. A recent pick-up in services results may prove short-lived.

Chart 2

281025c2

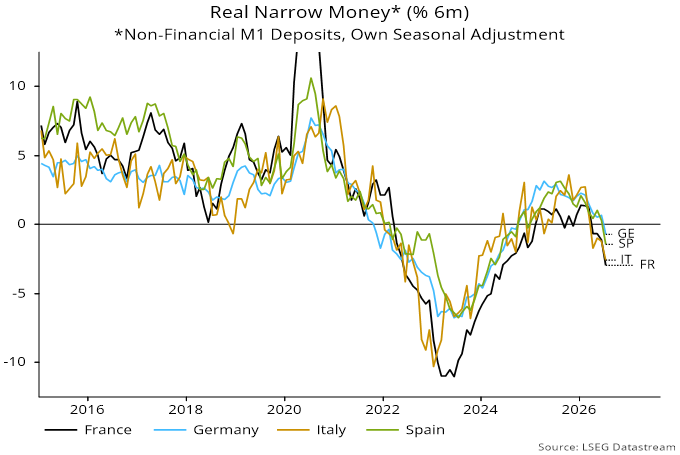
Country details show French relative weakness, with M1 deposits of households and non-financial firms stagnant in nominal terms over the last six months, implying real contraction – chart 3.

Chart 3

281025c3

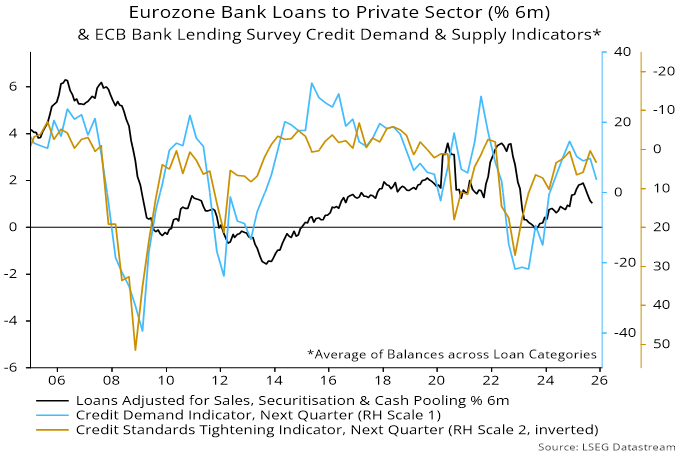
Six-month bank lending growth has cooled, with expected credit demand balances in the latest ECB loan officer survey suggesting a further slowdown – chart 4.

Chart 4

281025c4

Bullish economic hopes rest on German fiscal easing but restriction elsewhere will temper the impact. The Eurozone cyclically adjusted fiscal deficit is projected by the IMF to widen by a modest 0.3% of GDP in 2026, after no change this year.

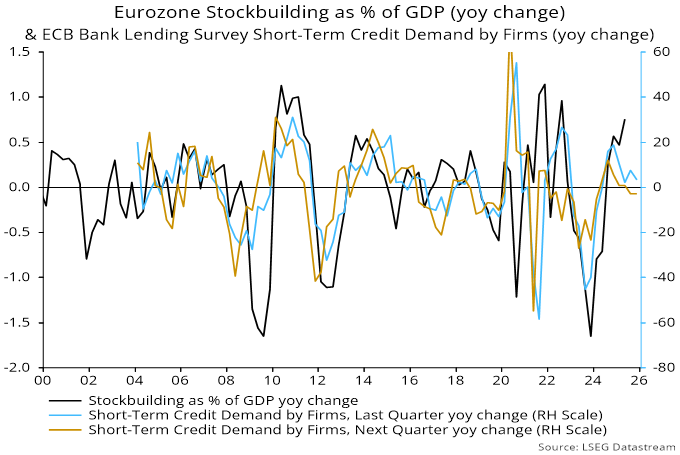
A downturn in the stockbuilding cycle could more than offset fiscal support. A rise in stockbuilding accounted for 0.8 pp of GDP growth of 1.5% in the year to Q2 2025. (The “true” contribution will have been smaller because of an associated increase in imports.)

Stockbuilding is a key influence on firms’ demand for short-term credit. Year-on-year changes in credit demand balances in the bank lending survey have weakened, consistent with a prospective stockbuilding downswing – chart 5.

Chart 5

281025c5

Eurozone money trends have been giving a downbeat signal for economic prospects. Incoming evidence is consistent with a loss of momentum.

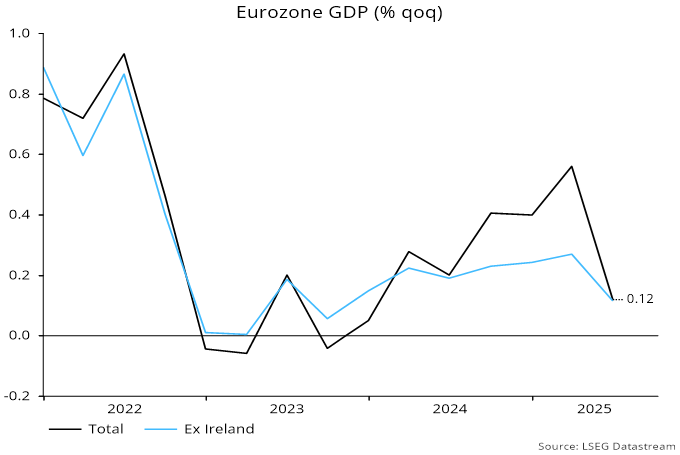
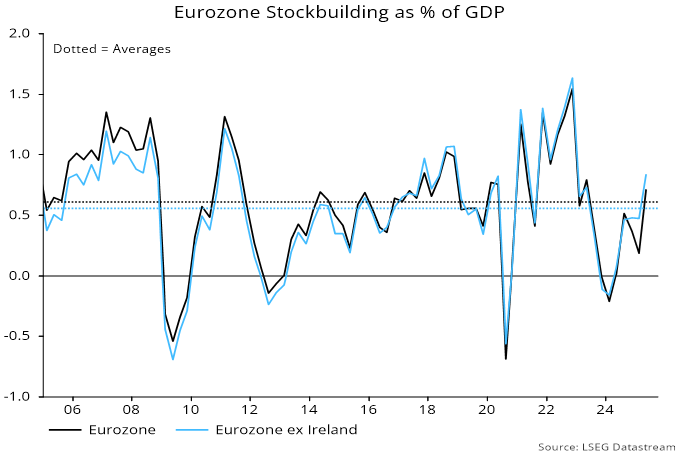
Eurozone GDP rose by only 0.8% at an annualised rate during H1 excluding distorted Irish numbers – see chart 1. Growth was dependent on an increase in stockbuilding, to an above-average level as a percentage of GDP – chart 2.

Chart 1

100925c1

Chart 2

100925c2

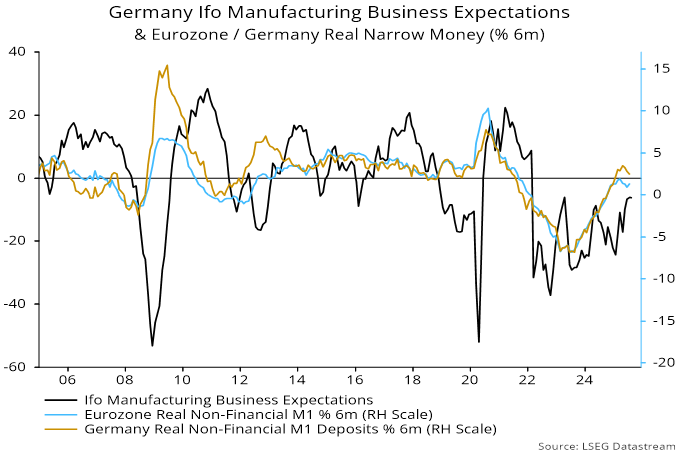
Rises in bond yields and the euro exchange rate have tightened monetary conditions, offsetting ECB rate cuts. Six-month Eurozone real narrow money momentum peaked in March, although the subsequent reversal has been modest – chart 3.

Chart 3

100925c3

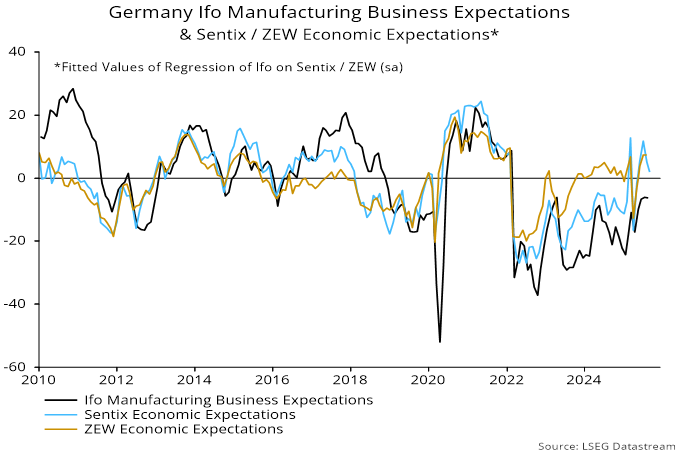
German Ifo manufacturing business expectations – closely correlated with Eurozone / German manufacturing PMIs – reached a two-year high in July, consistent with earlier monetary acceleration. Expectations moved sideways in August, with the March peak in real money momentum suggesting an inflection weaker soon.

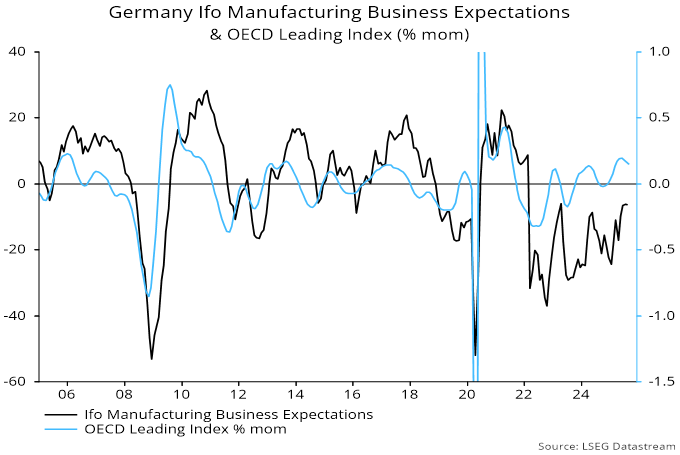
Other evidence supports this forecast. The one-month change in the OECD’s German leading index also anticipates turning points in Ifo expectations and has eased since May – chart 4.

Chart 4

100925c4

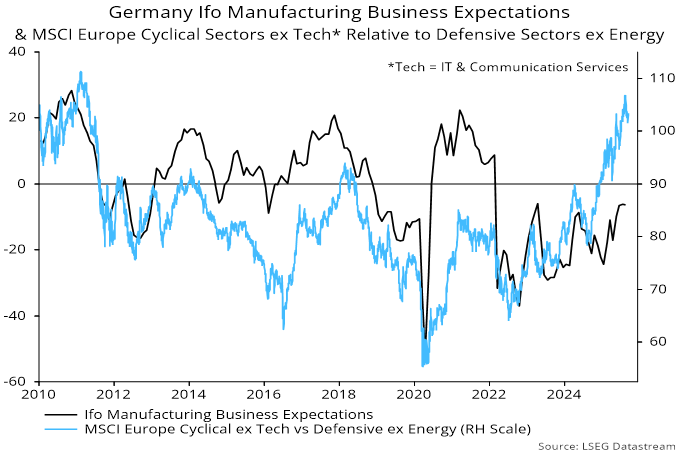
European cyclical sector equities often start to lag as business surveys inflect weaker and have given back some outperformance since mid-August – chart 5.

Chart 5
100925c5

The Sentix and ZEW surveys of financial analysts correlate with Ifo results, with Sentix September numbers already available and showing a second monthly decline – chart 6.

Chart 6

100925c6

The slowdown in Eurozone / German real money momentum is not yet alarming and may prove temporary, particularly if bond yields and the euro subside. Still, the ECB’s move to the sidelines was premature, with near-term data likely to bolster the case for further easing.

Recent Eurozone money trends cast doubt on economic optimism based on German / regional fiscal expansion. Weakening job openings suggest that a negative economic scenario is already starting to crystallise.

Six-month real narrow money momentum peaked in March at a modest level by historical standards, declining into June. The fall was driven by weakness in corporate deposits, suggesting that firms would cut back investment and hiring – see chart 1 and previous post for more discussion.

Chart 1

080825c1i

Indeed numbers on job postings are a timely coincident indicator of labour demand and appear to display less volatility than official survey-based measures of job openings or vacancies. The level and rate of decline of the UK Indeed series signalled recent job losses – chart 2.

Chart 2

080825c2

The latest numbers show signs of stabilisation in the UK / US. By contrast, job postings in Germany and France are falling rapidly, with the Italian series breaking below its late 2024 low and even Spain rolling over.

The German / French results chime with elevated consumer expectations of a rise in unemployment – chart 3*.

Chart 3

080825c3

Why haven’t ECB rate cuts and German fiscal expansion energised the Eurozone economy? The initial impact of the fiscal news has been to push up longer-term yields and the euro, offsetting ECB stimulus.

Fiscal expansion, even if well-executed, will play out over the medium term, with growth implications dependent partly on the extent of monetary financing. The direct and confidence effects of the unfavourable US-EU trade “deal”, meanwhile, are a further near-term negative.

*The Spanish series has been suspended.

June money numbers cast doubt on ECB President Lagarde’s assertion that policy-makers – and by extension the Eurozone economy – are “in a good place”.

Six-month growth of the preferred narrow / broad money measures here – non-financial M1 / M3, comprising holdings of households and non-financial corporations (NFCs) – fell further to 3.4% and 1.6% annualised respectively last month. The latter is the slowest since December 2023 and compares with a 4.9% average over 2015-19 – see chart 1.

Chart 1

250725c1

Weakness is focused on the corporate sector: NFC M1 / M3 deposits rose by only 0.5% and 0.1% annualised respectively in the six months to June, implying real terms contraction – chart 2.

Chart 2

250725c2-renamed

Corporate liquidity deterioration suggests that companies are under increased financial pressure and will rein in expansion plans – chart 3. A contraction in UK real corporate money preceded recent employment cut-backs.

Chart 3

Chart 3 showing Eurozone Non-Residential Fixed Investment (% 2q) & Real Corporate Deposits (% 6m)

Six-month narrow money momentum is notably weaker in France / Italy than Germany / Spain, although German growth has fallen back since April – chart 4.

Chart 4

250725c4-renamed

Consensus commentary focuses on bank lending, which, as an empirical matter, lags money trends. Adjusted loans to households and NFCs rose by a solid 0.4% on the month but six-month growth eased from 3.0% to 2.8% annualised. The “credit impulse”, in other words, may be rolling over.

Recent rate cuts are feeding through and it is possible that monetary weakness will prove temporary. Still, ECB officials should be concerned by the slowdown and signalling an openness to further easing rather than projecting complacency.

Eurozone / UK money growth has weakened despite rate cuts, suggesting that central banks – particularly the MPC – have more work to do to sustain economic expansion and prevent inflation undershoots.

Preferred broad money aggregates – Eurozone non-financial M3 and UK non-financial M4 – grew by 2.3% and 2.1% annualised respectively in the three months to April, down from 4.6% and 4.4% in the prior three months – see chart 1.

Chart 1

060625c1

Concern about the Eurozone slowdown is tempered by still-respectable narrow money growth – non-financial M1 rose by 5.2% annualised between January and April versus 6.2% in the prior three months.

UK non-financial M1, by contrast, contracted by 1.7% annualised in the latest three months, following 6.5% growth in the three months to January.

The slump in UK momentum was driven by a month-on-month fall of 1.0% (not annualised) in April, mostly due to the household component. This may have been related to the end of the stamp duty holiday on 31 March – a bunching of transactions and mortgage borrowing ahead of the deadline may have been associated with a temporary rise in demand for sight deposits, which reversed in April as activity normalised.

An additional possibility is that individuals who sold assets in anticipation of tax rises in the October Budget delayed reinvesting the proceeds until the start of the 2025-26 tax year.

Household broad money rose by 0.2% in April despite the big fall in sight deposits, reflecting a record £14.0 billion inflow to cash ISAs.

Still, the movement of money out of current accounts is a negative signal for the economy, suggesting low spending intentions and a preference for saving.

UK corporate broad money, meanwhile, resumed a decline in the latest three months, suggesting that firms remain under financial pressure to cut jobs and investment.