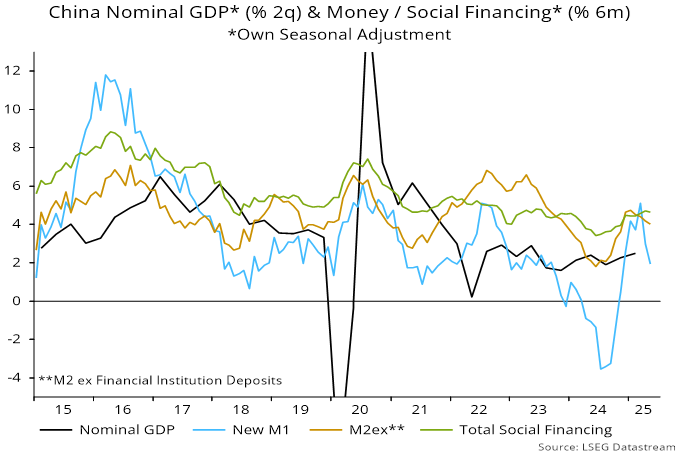
Chinese October money / credit numbers were mixed, suggesting a continuation of sluggish economic growth.
On the positive side, six-month growth of narrow money M1 extended its recent recovery, reaching its highest since March – see chart 1. (A fall in the year-on-year measure reflected an unfavourable base effect.)
Chart 1
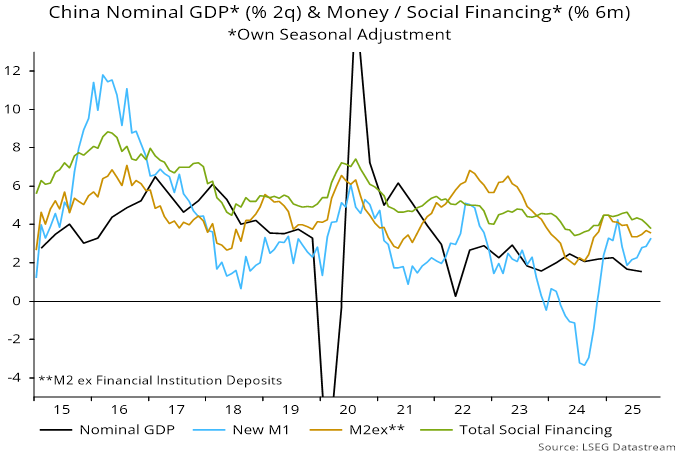
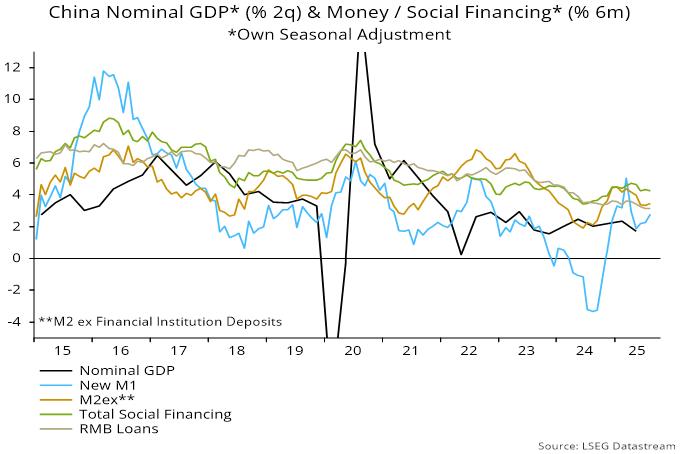
Broad credit slowed further, however, while growth of broad money – on the preferred definition here excluding deposits of financial institutions – fell back.
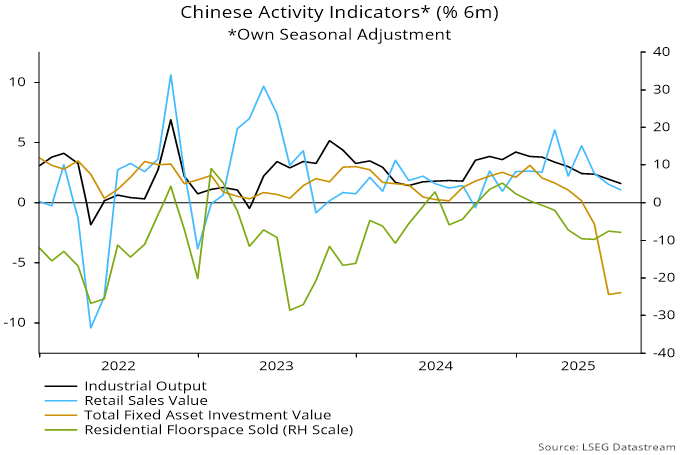
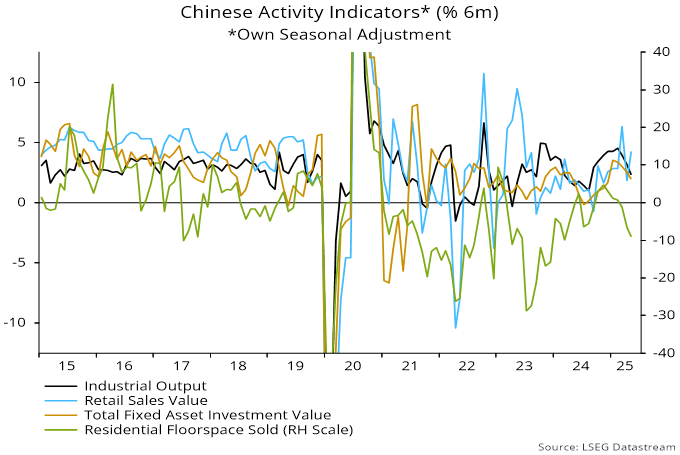
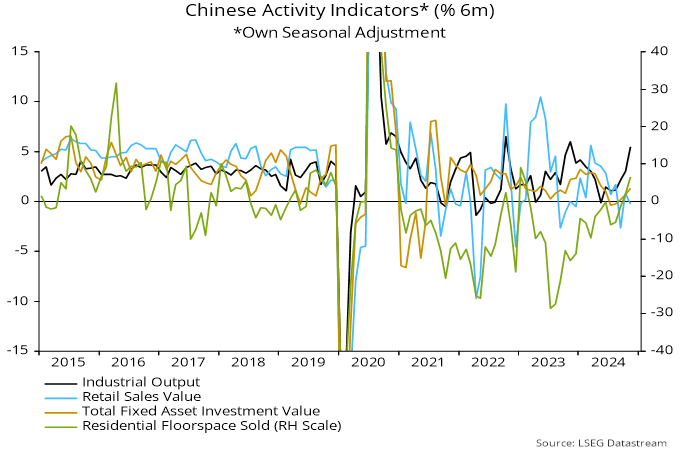
Concern about downside economic risks is supported by October activity numbers, showing faster rates of contraction of fixed asset investment and housing sales / starts – chart 2.
Chart 2
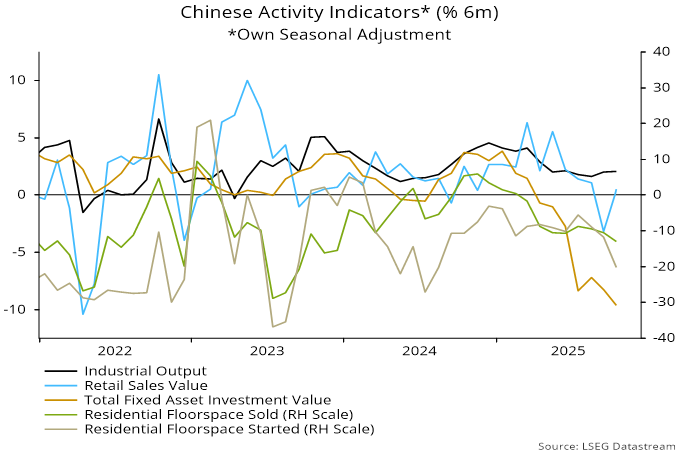
The weakness of the fixed asset investment data is difficult to square with Q3 GDP results showing an investment contribution of 0.9 pp to annual growth of 4.8%. The national accounts number includes stockbuilding but there is no indication from other evidence – admittedly limited – of a rapid build-up of inventories.
Industrial output growth continues to hold up while retail sales recovered after September weakness.
The authorities announced modest additional stimulus measures in September / October – new investment financing and an increase in local government bond issuance, each of RMB500 bn – and probably need to see greater weakness in the data before considering further action.
A positive gap between money growth and nominal GDP expansion may continue to offer support to equities, given low bond yields and still-negative property trends.
From a global perspective, lacklustre Chinese news presents no challenge to the forecast here of a loss of industrial momentum into early 2026 – see previous post.
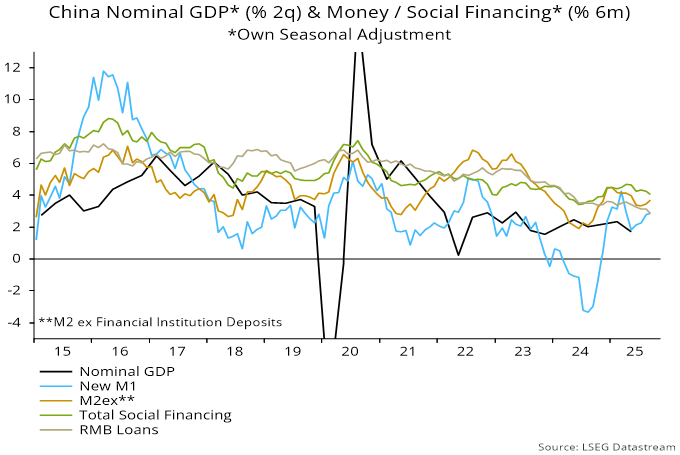
Chinese money trends suggest a continuation of sluggish economic growth, negligible inflation and a supportive liquidity environment for markets.
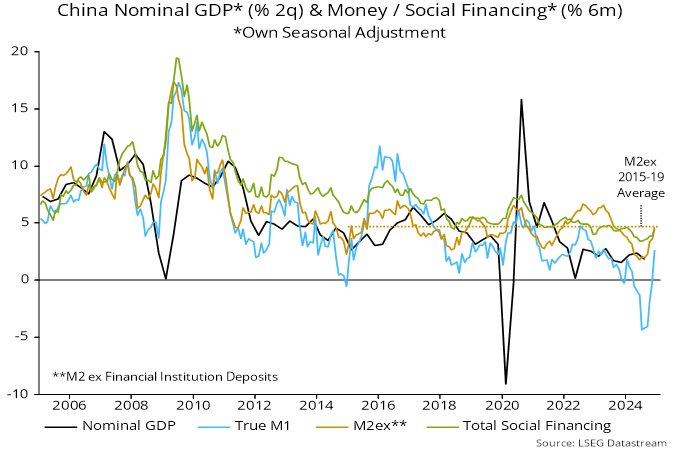
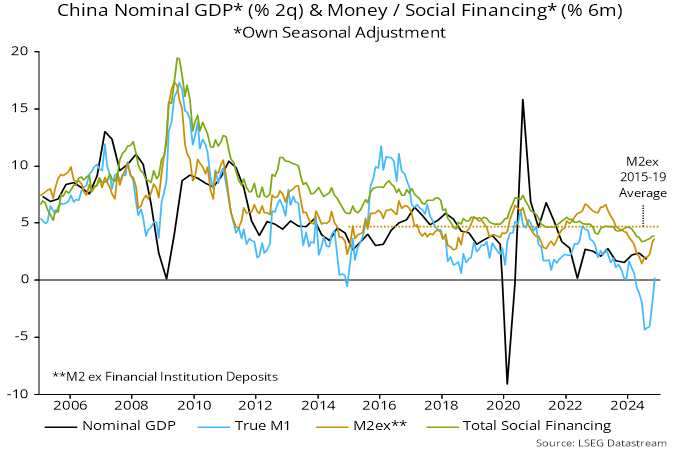
Six-month growth of narrow money – as measured by the new M1 definition incorporating household demand deposits – rose slightly in September, extending a recovery from a May low. Broad money momentum also edged higher. Both series are around their average levels in recent years – see chart 1.
Chart 1
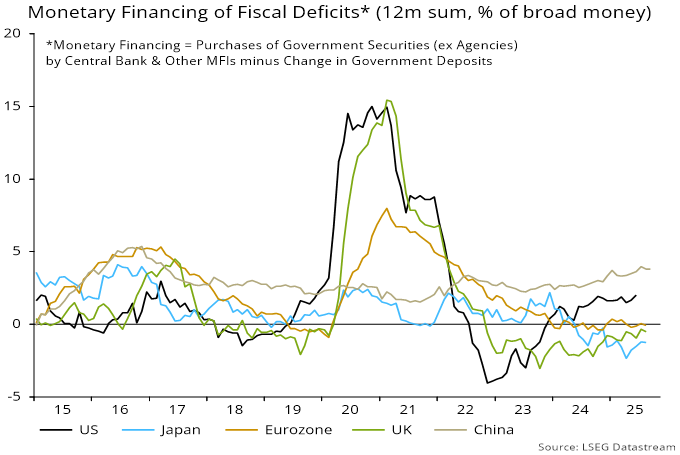
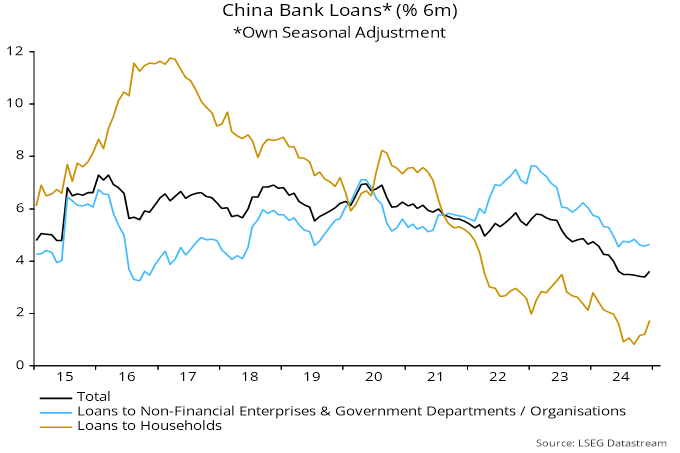
Credit trends remain weak, with six-month growth of bank lending reaching another record low, although numbers have been suppressed by bond swaps. Monetary expansion, however, continues to be boosted by China’s version of QE, conducted via the state banks. Monetary financing of the government, including bond swaps, accounted for 3.8 pp of M2 growth of 8.4% in the year to September – chart 2.
Chart 2
Money growth remains above nominal GDP expansion, arguing against a debt deflation scenario and suggesting “excess” money support for asset prices. With the housing market still weak and longer-term bond yields recently moving up from record lows, equities could remain the default beneficiary.
The Chinese economy has slowed sharply but money trends are giving a modestly reassuring signal.
Six-month growth of industrial output and retail sales eased further in August, while fixed asset investment remained in deep contraction, following dramatic June / July weakness. Home sales also continued to slide – see chart 1.
Chart 1
Investment weakness has recently spread from the property sector to state-controlled spending and manufacturing, reflecting anti-“involution” policies.
August money numbers, however, argue against embracing economic pessimism, at least for now. Six-month growth of narrow money – as measured by the new M1 definition incorporating household demand deposits – rose modestly for a third month, following a sharp drop in April / May. Broad money momentum has also edged up, with both series comfortably within their ranges in recent years – chart 2.
Chart 2
Sectoral details, meanwhile, indicate that the earlier drop in narrow money growth reflected a fall in demand deposits of government-related bodies (excluding central government), consistent with recent weakness in state-controlled investment. Growth of an alternative “private sector” measure comprising holdings of households and non-financial enterprises remains close to its recent high – chart 3.
Chart 3
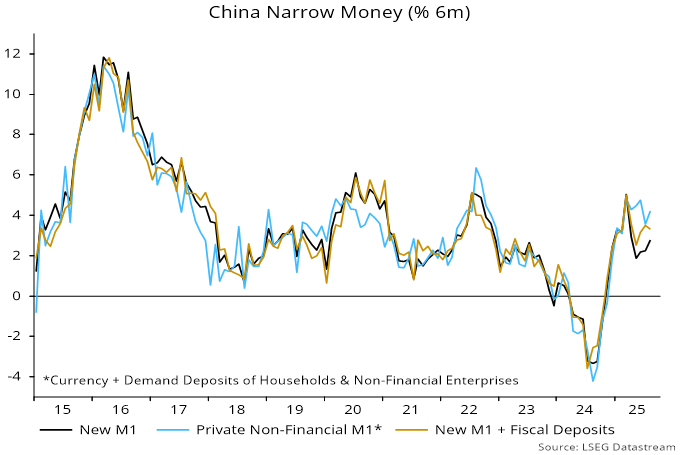
The fall in demand deposits of government-related bodies, moreover, was balanced by a strong rise in central government (i.e. fiscal) deposits, suggesting yet-to-be-deployed firepower. Six-month growth of an expanded measure including such deposits has also remained solid.
The message of supportive monetary / financing conditions is reinforced by survey evidence – the corporate financing index from the Cheung Kong Graduate School of Business survey is above its long-run average – as well as recent yield curve steepening.
Despite the April / May slowdown, six-month narrow money momentum has remained above nominal economic growth, with the “excess” providing fuel for the rally in equities.
A further rise in China’s trade surplus over the past year has been accompanied by bumper growth of US dollar deposits in Hong Kong, suggesting that Chinese entities have been building a hedge against RMB depreciation – see chart 1.
Chart 1
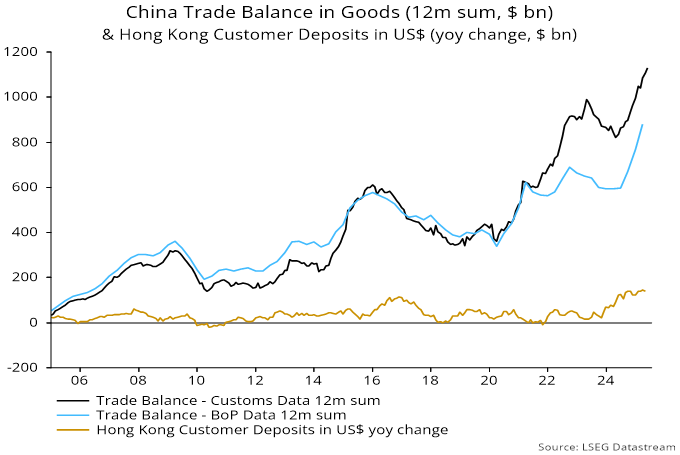
US dollar deposits grew by $139 bn or 15.6% in the year to April to stand at $975 bn, equivalent to 4.5% of US M2. They have risen much more strongly than Hong Kong dollar deposits, now representing 92% of the value of the latter, up from 79% at end-2022.
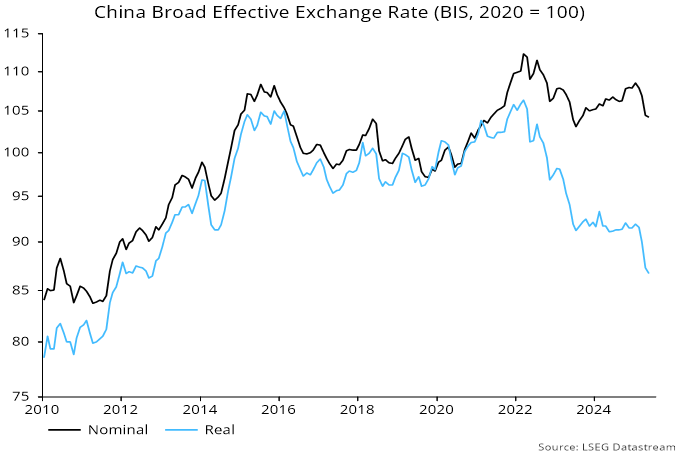
Low inflation has allowed China to gain competitiveness without nominal depreciation, with the BIS real effective rate at a 13-year low – chart 2.
Chart 2
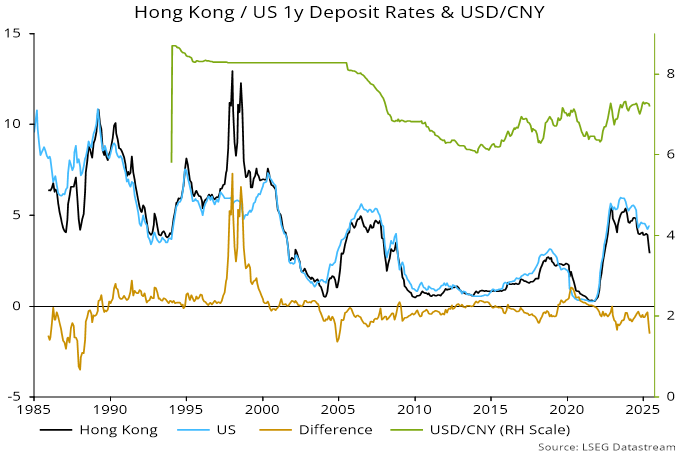
Is demand for US dollar balances starting to wane? The recent fall in Hong Kong rates is consistent with a switch into local dollars. The one-year Hong Kong / US rate differential is the most negative since 2005, before a sustained appreciation of the RMB – chart 3.
Chart 3
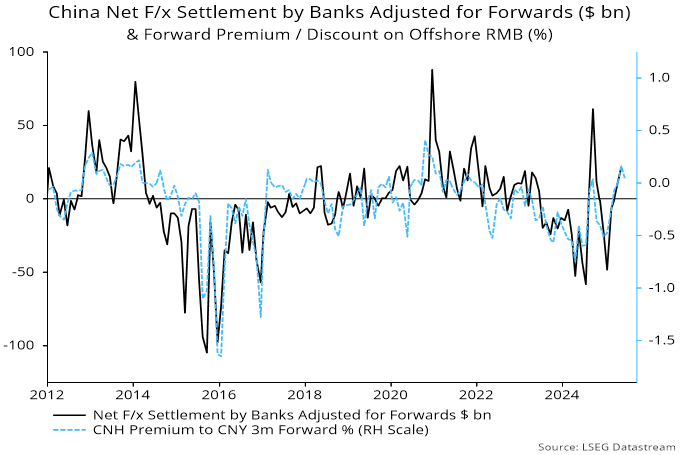
Chinese f/x settlement numbers, meanwhile, indicate that the authorities intervened to hold down the RMB for a second month in May. Upward pressure had been signalled by a forward premium on the offshore RMB, which has persisted in June – chart 4.
Chart 4
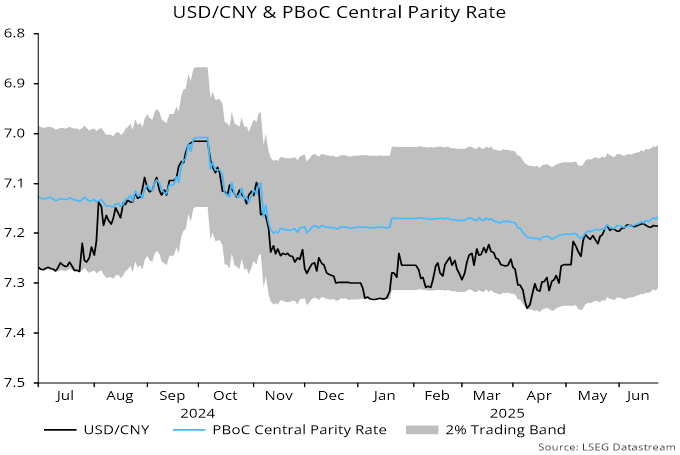
The onshore spot rate has moved from the weak end to the middle of the PBoC’s trading band, with the central parity rate edging higher – chart 5.
Chart 5
Any signal from the Chinese authorities of acquiescence to an appreciating trend could quickly become self-fulfilling by encouraging a further unwind of hedges, including via a reduced US dollar share of Hong Kong deposits.
Chinese monetary trends suggest a continuation of lacklustre economic growth with negligible inflation.
Six-month momentum of narrow and broad money picked up strongly during H2 2024, raising hopes of a reflationary scenario. Growth rates, however, have fallen back since Q1, to around the middle of ranges in recent years – see chart 1.
Chart 1
May activity numbers confirm an economic slowdown, with six-month growth of industrial output and fixed asset investment falling again, and home sales contracting at a faster pace. Retail sales were boosted by subsidy programmes and promotions, with payback likely – chart 2.
Chart 2
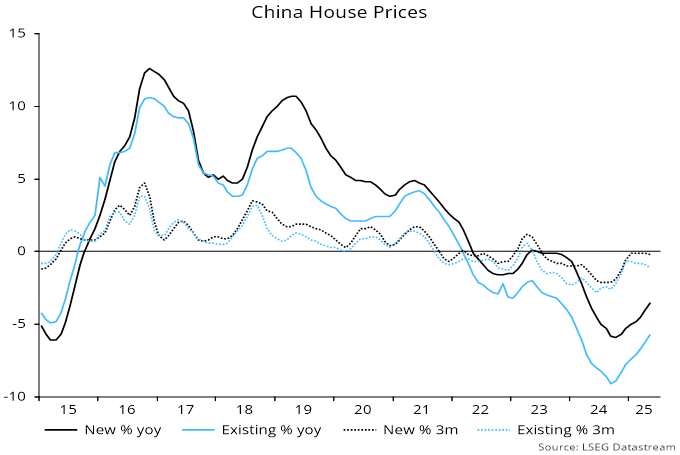
House prices haven’t stabilised. The three-month change in new house prices has stalled below zero, with that for existing homes becoming more negative – chart 3.
Chart 3
Monetary developments don’t yet warrant pessimism. Six-month broad money momentum remains respectable, at 4.0% – 8.2% annualised – in May. This could be consistent with nominal GDP growth of c.6.5% pa, based on a long-run trend rise of 1.75% pa in the money to GDP ratio.
Narrow money momentum has weakened more sharply but the sectoral breakdown is reassuring, showing stable growth of household and enterprise money, with the aggregate slowdown due to a fall in demand deposits of government-related bodies – chart 4.
Chart 4
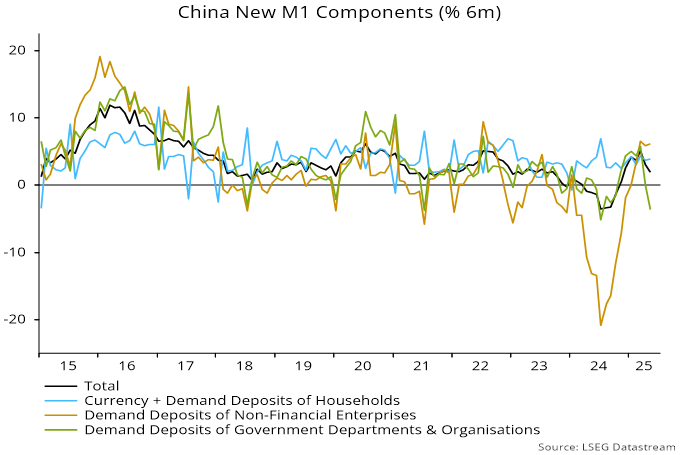
This fall is unlikely to be a leading indicator of reduced spending by these bodies, particularly as their overall deposit growth – i.e. including time as well demand deposits – has remained stable.
The money numbers, moreover, exclude fiscal (i.e. central government) deposits, six-month growth of which has picked up since Q1. Demand deposits of government-related bodies could recover as funds are transferred to finance spending projects.
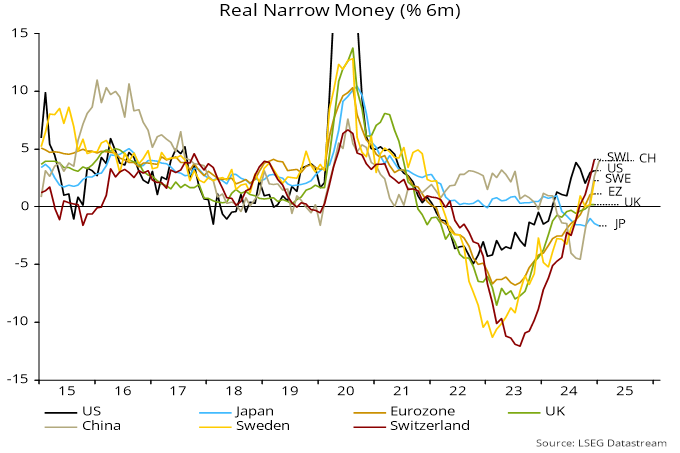
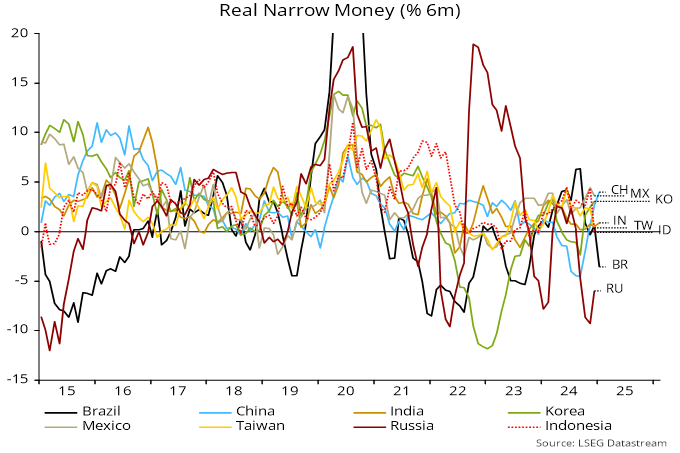
Monetary trends suggest that China’s economy is better placed to withstand tariff damage than Japan’s.
Chinese six-month real narrow money momentum rose further in March, reaching its highest level since August 2020. Japanese momentum moved deeper into contraction – see chart 1. (US March numbers will be released next week, with Eurozone / UK data the following week.)
Chart 1
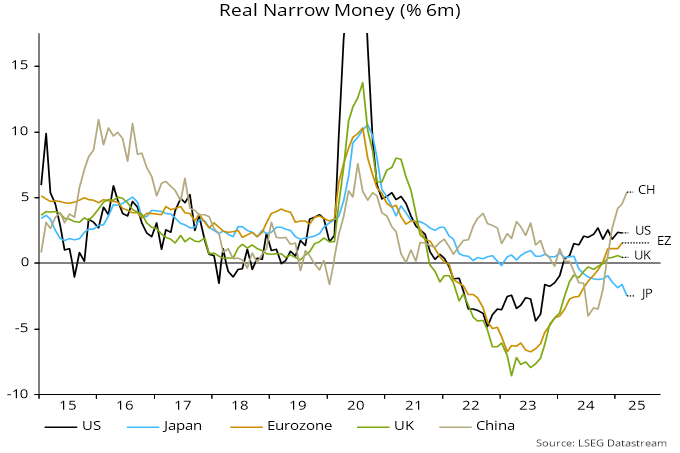
Inflation divergence has contributed to the wide gap but it mainly reflects nominal money trends: Japanese narrow money is contracting even in nominal terms.
The Japanese fall is partly explained by money-holders switching out of sight deposits (included in narrow money) into time deposits (excluded), which now pay modest interest. Still, broad money trends are also weak: M3 grew by just 0.5% at an annualised rate in the six months to March. Broad money expansion has been dragged down by BoJ QT and a fall in bank lending to non-bank financial corporations.
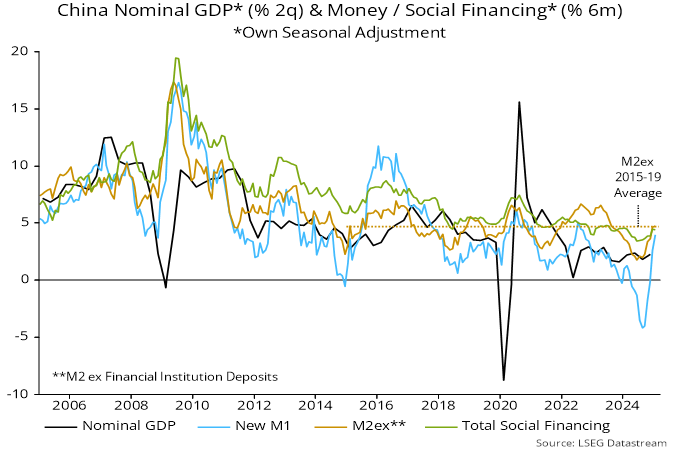
By contrast, six-month growth of Chinese broad money – on the preferred definition here excluding deposits held by financial institutions – was stable in March at a level close to the 2015-19 average. This pace was associated with solid nominal GDP expansion – chart 2.
Chart 2
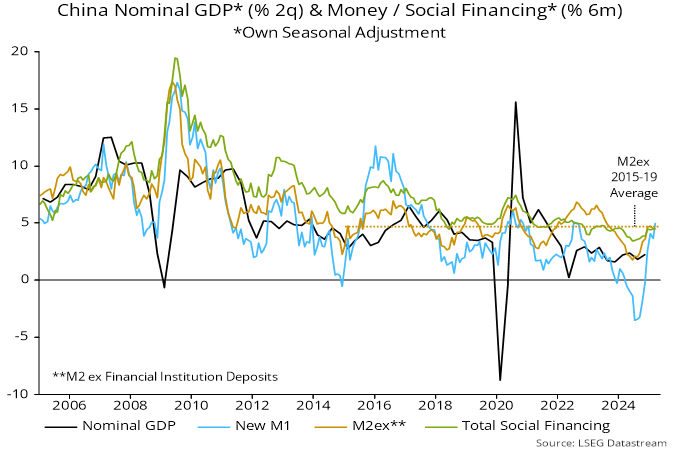
Broad money trends have been supported by PBoC and state bank purchases of government bonds issued to finance fiscal stimulus measures. In addition, six-month growth of bank lending has revived recently, despite a drag from debt swap operations (under which funds raised through bond issuance are used to repay bank loans of government-related entities).
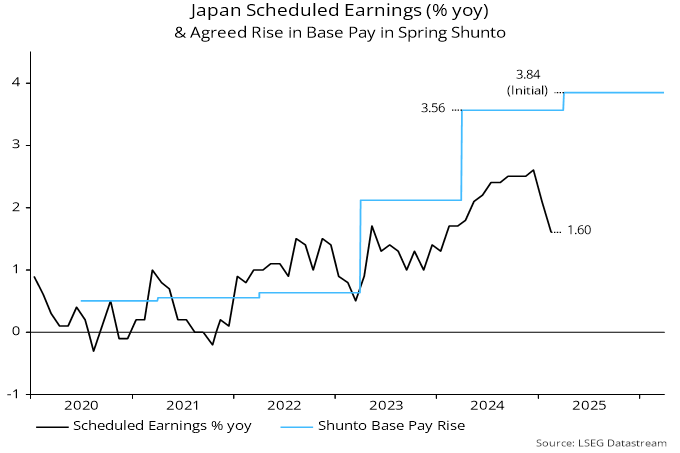
Previous posts suggested that Japanese monetary weakness would be reflected in downside economic and inflation surprises. The composite PMI output index fell sharply last month, to well below levels in the US, Eurozone, UK and China.
Annual growth of scheduled earnings, meanwhile, undershot expectations in February. Inflation believers have been relying on a developing wage-price spiral but bumper headline pay awards in the spring Shunto may not be representative of trends across the whole economy – chart 3.
Chart 3
MSCI indices for continental Europe and China have outperformed year-to-date – see chart 1.
Chart 1
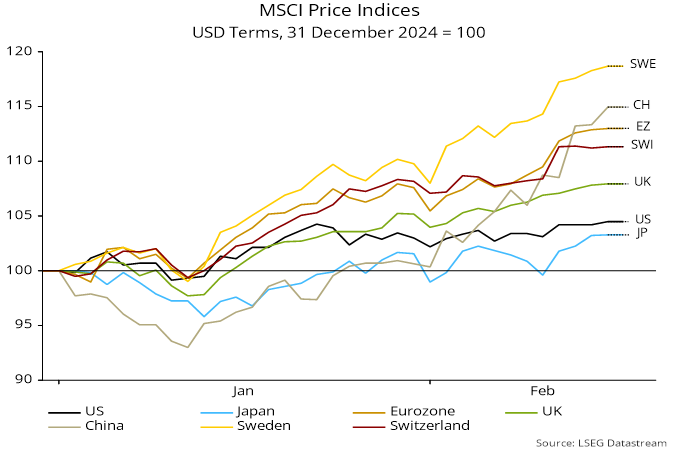
The pattern of returns echoes monetary trends: six-month real narrow money growth has picked up in China and continental Europe while moving sideways in the US, with Japan and the UK lagging – chart 2.
Chart 2
A previous post noted that Chinese money / credit numbers strengthened significantly in December. The pick-up was sustained in January: six-month growth rates of the narrow / broad monetary aggregates followed here rose further and are back around the middle of recent historical ranges – chart 3.
Chart 3
The official M1 definition has been revised to include personal demand deposits, aligning it with international practice. The new measure is close to the “true M1” aggregate used here historically.
Annual growth of official M2 eased from 7.3% in December to 7.0% in January. The slowdown, however, reflected a fall in bank deposits held by non-bank financial institutions – movements in such deposits are less informative about economic prospects. Annual and six-month growth of non-financial M2 rose further in January.
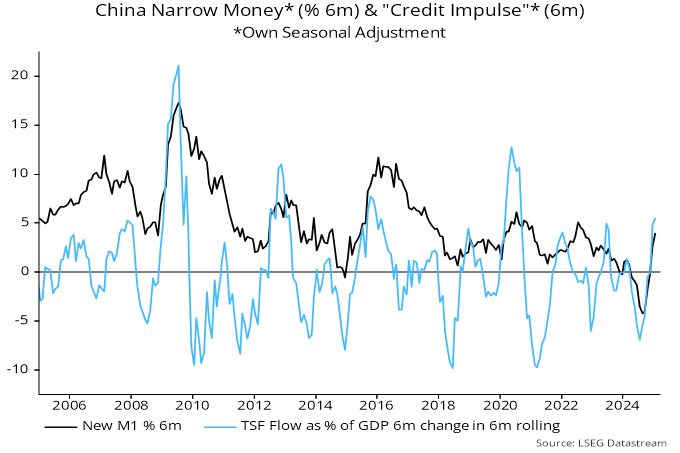
The sharp turnaround in six-month narrow money momentum has been mirrored by a “credit impulse” measure based on the six-month flow of total social financing – chart 4.
Chart 4
The turnaround in money / credit momentum partly reflects the negative impact of regulatory changes last spring dropping out of six-month calculations. Seasonal adjustment is more uncertain in January / February because of New Year timing effects. Money / credit growth is not yet strong by historical standards.
Still, money trends warrant increased confidence that domestic demand growth will recover sufficiently to offset any loss of support from net exports due to trade conflict.
MSCI China remains on a steep valuation discount to the rest of EM despite recent outperformance – chart 5. Chinese six-month real narrow money momentum is now stronger than in most other EMs – chart 6.
Chart 5
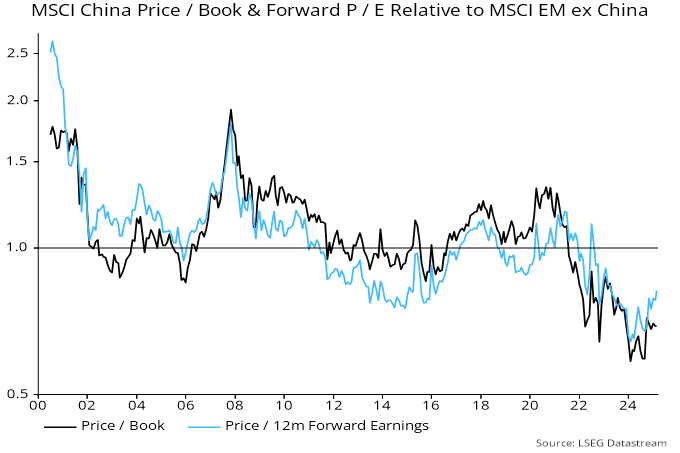
Chart 6
Chinese money and credit numbers for December suggest that policy stimulus is becoming effective, warranting an upgraded assessment of economic prospects.
Six-month rates of change of broad / narrow money and broad credit (total social financing) bottomed in June / July but the recovery through November was modest. All three jumped higher in December – see chart 1.
Chart 1
Money measures – particularly narrow money – were negatively distorted last spring by regulatory enforcement of deposit rate ceilings*. The revival in six-month momentum partly reflects the dropping out of this effect. Still, December readings should be undistorted and broad money momentum is close to its 2015-19 average, when nominal GDP grew solidly.
Monetary financing of fiscal easing has been a key driver of the money growth pick-up. Banking system net lending to government (including by the PBoC) contributed 2.0 pp (not annualised) to M2 growth in the six months to December, the most since the 2015-16 stimulus episode.
An apparent weak spot in the December release was a further fall in annual bank loan growth (i.e. excluding lending to government). The numbers, however, are being distorted by debt swap operations, involving repayment of bank loans by government-related organisations. Six-month loan momentum has edged up despite this drag, with household lending weakness abating – chart 2.
Chart 2
Will the money growth recovery continue? Recent renewed pressure on the currency has been associated with a resumption of f/x sales and a firming of money market rates. The increase in term rates has so far been modest and may be offset by ongoing support from money-financed fiscal easing.
Chinese money trends are normalising after weakness, suggesting modest economic improvement.
A previous post argued that a recovery in money growth was under way but the extent of reacceleration was uncertain. A revival remains on track but has so far proved lacklustre.
Money numbers were distorted in the spring by regulatory enforcement of deposit rate ceilings, which resulted in corporations switching out of demand deposits into time deposits and non-monetary instruments. Broader money measures were less affected, resulting in a focus here on the “M2ex” aggregate (i.e. official M2 minus deposits of financial institutions, which are volatile and less correlated with future activity / prices).
Six-month M2ex momentum bottomed in June and recovered further in November, though remains below its 2015-19 average – see chart 1.
Chart 1
Narrow money momentum is much weaker but has started to normalise as the spring distortion drops out of the six-month comparison. (The “true M1” measure shown approximates to a new official M1 definition to be adopted from January.)
Chinese money momentum has led nominal GDP momentum by two quarters on average historically, so monetary reacceleration since mid-year suggests better economic data from early 2025.
November activity numbers were positive on balance. Six-month rates of change of industrial output, fixed asset investment and home sales rose further but retail sales disappointed – chart 2. Output strength could reflect front-loading ahead of tariffs.
Chart 2
The suggestion from monetary trends of improving prospects is supported by the OECD’s composite leading indicator, six-month momentum of which has turned positive, suggesting above-trend growth – chart 3.
Chart 3
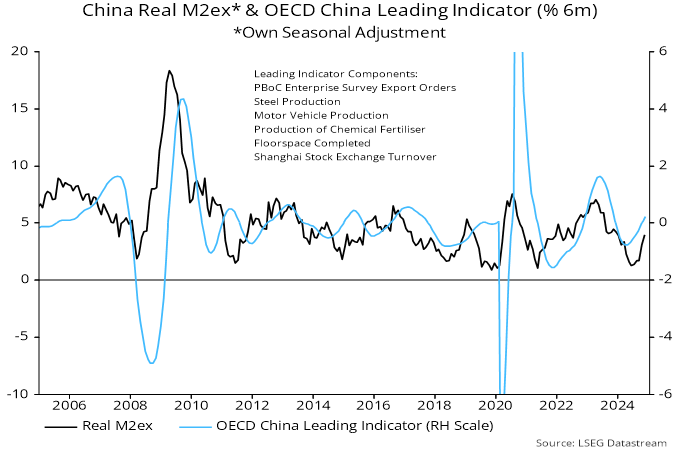
Real money momentum has led leading indicator momentum by four months on average historically but the low in the latter occurred earlier on this occasion, perhaps reflecting the regulatory distortion to monetary data mentioned above.
A post last month suggested that Chinese money growth was bottoming, based on year-to-date policy easing and the space for additional stimulus opened up by a stabilisation of the currency. September money numbers and recent policy announcements bolster this assessment but the scale of monetary acceleration is uncertain.
As previously discussed, narrow money measures have been distorted by regulatory changes in April that reduced the attractiveness of demand deposits, arguing for giving greater weight to broader aggregates. Six-month growth of the preferred broad measure here – M2 excluding deposits of non-bank financial institutions – bottomed in June, edging up further in September. Broad money has led nominal GDP by around six months at momentum turning points historically, suggesting that two-quarter nominal GDP expansion will bottom by year-end – see chart 1.
Chart 1


Narrative about the insufficiency of the latest initiatives may underestimate policy stimulus already in the pipeline. Government net securities issuance reached CNY10.8 trillion or 8.3% of GDP in the 12 months to September, the highest proportion since 2017 and up by 2.6 pp from the prior 12 months. A further increase is likely. The banking system buys the bulk of securities so increased issuance usually boosts broad money growth (unless funds are used to repay other bank lending or increase system capital) – chart 2*.
Chart 2


Stimulus packages in 2008-09 and 2015-16 succeeded in reflating nominal GDP growth; smaller-scale initiatives in 2012-13 and 2019-20 resulted in stabilisation but little increase – chart 3. The extent of a recovery in money growth will signal which scenario is more likely. Markets appear to be discounting the latter: the yield curve (10s-2s) has steepened but less than in 2009 and 2015, while the rally in MSCI China still leaves it on a significant forward P / E discount to the rest of EM – chart 4.
Chart 3


Chart 4

