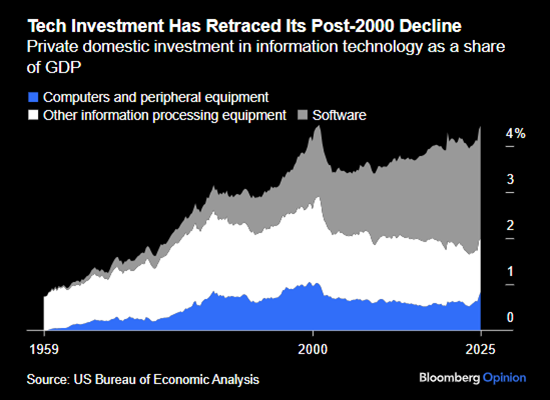
En 2025, les actions américaines ont été stimulées non seulement par les sociétés technologiques et les géants de l’IA, mais aussi par un plus vaste éventail de titres, ce qui signale une réorientation au-delà des fameuses sept magnifiques. Pourtant, ce sont les actions canadiennes qui ont damé le pion, propulsées par une remarquable remontée de l’or qui a bondi de plus de 60 % cette année. Pour les investisseurs, il s’agit de la troisième année consécutive de solide croissance totale des portefeuilles, malgré les incertitudes géopolitiques persistantes et les défis commerciaux.
Actions – les actions canadiennes ont mené le bal
L’année 2025 a été exceptionnelle pour les actions canadiennes, qui ont devancé les autres grands marchés. L’indice composé plafonné S&P/TSX a inscrit un rendement de 31,7 %, et les actions canadiennes à petite capitalisation ont bondi de plus de 50 %. Cette impressionnante remontée a été alimentée par la croissance fulgurante des sociétés aurifères et de métaux précieux, ainsi que par le momentum soutenu des sociétés axées sur l’IA à l’échelle mondiale. Les actions des marchés émergents et internationales ont également inscrit des rendements exceptionnels, progressant de 27,3 % et de 25,1 % respectivement.
En revanche, les actions américaines ont tiré de l’arrière, progressant de 12,4 % pour l’année, résultat plombé pour les investisseurs canadiens par la dépréciation du dollar américain. En revanche, l’indice S&P 500 a progressé de 17,9 % en dollars américains. Le rendement de l’indice S&P 500 en 2025 est attribuable à un plus vaste éventail de titres, mais l’influence collective des sept magnifiques – Alphabet (Google), Amazon, Apple, Meta Platforms, Microsoft, NVIDIA et Tesla – a légèrement grimpé, NVIDIA ayant été un facteur clé de cette croissance.
Figure 1 – Rendements des actions pour l’année civile 2025 (%)
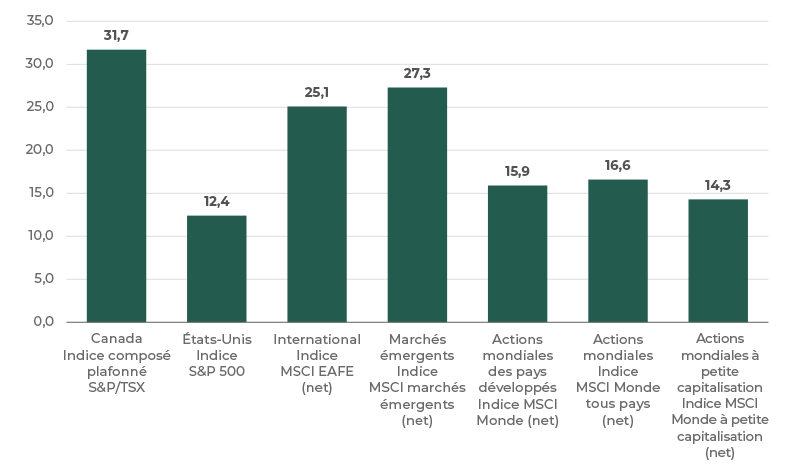
Sources : Bloomberg, S&P et MSCI (tous les rendements sont en $ CA)
Même si les indices boursiers ont enregistré des gains impressionnants, les gestionnaires actifs ont fait face à un contexte difficile, surtout s’ils n’ont pas profité de la flambée des secteurs de l’or et des technologies de l’information. Les gestionnaires de placements axés sur l’analyse quantitative (systématique) font exception, car ils utilisent la technologie pour analyser un large éventail de sociétés mondiales et maintenir des portefeuilles diversifiés. Les gestionnaires axés sur l’analyse quantitative ont généralement réussi à composer avec les marchés boursiers difficiles et concentrés et à surpasser l’indice au cours des dernières années.
Titres à revenu fixe – effet négatif de la durée
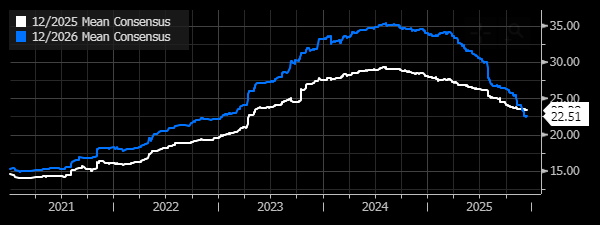
L’année 2025 s’est révélée encore une fois difficile pour les marchés des titres à revenu fixe traditionnels. Les titres de créance des marchés émergents et les obligations américaines à rendement élevé ont le plus brillé, ce qui a stimulé les rendements des titres à revenu fixe des marchés publics. La Banque du Canada a continué de réduire son taux, ramenant le taux du financement à un jour à 2,25 % à la fin de l’année. Encore une fois, les obligations à durée plus longue ont fait face à des obstacles, les obligations universelles de toutes les échéances ont inscrit un modeste gain de 2,6 %, tandis que les obligations à long terme ont reculé de 0,8 %.
Figure 2 – Rendements des titres à revenu fixe pour l’année civile 2025 (%)
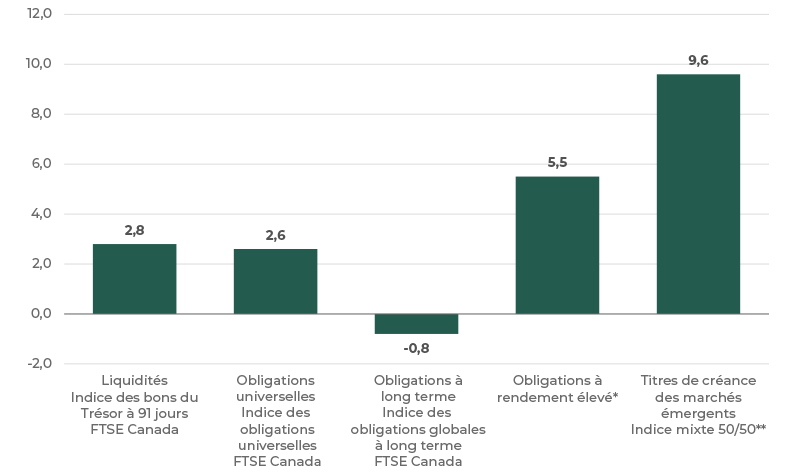
* 30 % de l’indice Merrill Lynch US High Yield Cash Pay BB ($ CA), 30 % de l’indice Merrill Lynch US High Yield Cash Pay BB ($ US), 30 % de l’indice FTSE TMX Canada Universe BBB Bond et 10 % de l’indice Merrill Lynch Canada BB-B High Yield ($ CA)
** 50 % de l’indice JP Morgan Emerging Market Bond et 50 % de l’indice JP Morgan Corp Emerging Market Bond ($ CA)
Sources : Bloomberg, Merrill Lynch, S&P et FTSE (tous les rendements sont en $ CA)
Marchés privés
Les marchés privés en 2025 ont encore une fois révélé un contexte façonné par la stratégie et le moment. Contrairement aux marchés publics, où les rendements sont immédiats et transparents, les placements privés nécessitent de la patience en raison des décalages de valorisation et de déclaration. Cette année, les résultats ont été encourageants : le crédit privé et les stratégies d’infrastructures ont produit de solides rendements, tandis que l’immobilier commercial s’est amélioré de façon soutenue.
Les rendements du capital-investissement, bien que contrastés, ont ravivé l’optimisme, surtout compte tenu du fait que le volume des opérations a dépassé les 3 300 milliards de dollars américains au troisième trimestre de 2025 seulement. Les fonds de couverture ont démontré leur polyvalence, de nombreuses stratégies ayant produit des rendements qui étaient plus proches de ceux des actions mondiales, ce qui représente un changement important par rapport à l’année précédente.
En fin de compte, les marchés privés continuent de jouer un rôle essentiel dans la diversification des portefeuilles, complétant les actions cotées en bourse et les titres à revenu fixe pour créer une répartition de l’actif plus résiliente.
Appréciation du huard
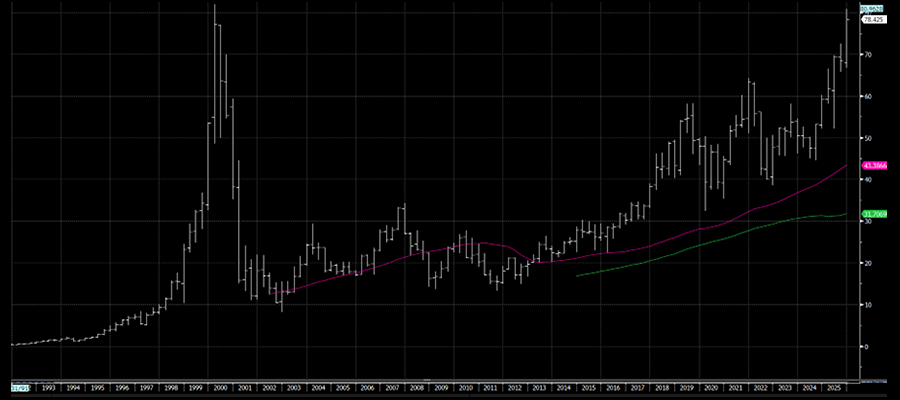
Le dollar canadien a récupéré une grande partie de la dépréciation qu’il a connue en 2024 par rapport au dollar américain. Pour les investisseurs canadiens qui détiennent des actions américaines non couvertes, ce rebond a réduit les rendements en raison de l’effet de change. La figure 3 suit la variation des taux de change depuis 1970 et illustre donc le contexte associé aux fluctuations du dollar canadien par rapport au dollar américain à l’ère moderne. Depuis environ 2016, le dollar canadien se situe dans une fourchette relativement étroite, même pendant la récente flambée de l’inflation. À la fin de 2025, le dollar canadien se situait autour de 73 cents américains, ce qui représente un gain de près de 5 % par rapport à la clôture de l’année précédente.
Figure 3 – Historique du taux de change entre le dollar américain et le dollar canadien
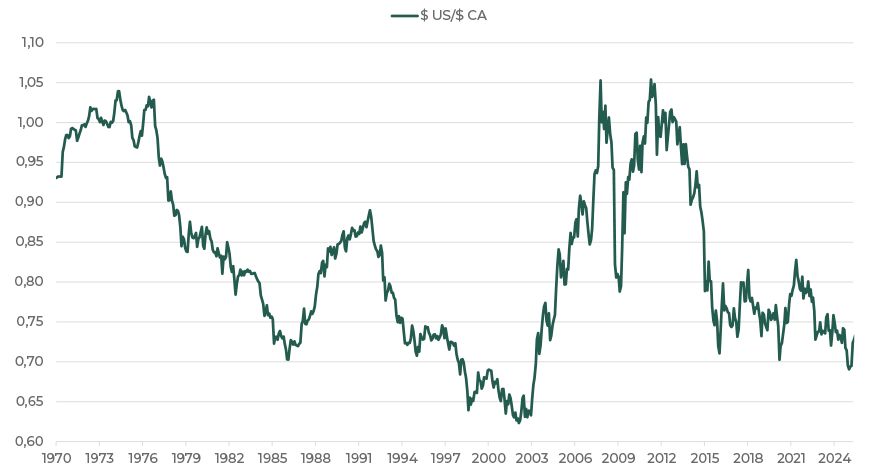
Source : Bloomberg
Des occasions à saisir
Les occasions s’offrent aux investisseurs en 2026. Après plusieurs années de gains remarquables sur les marchés boursiers, le moment est venu de revoir à quel point votre portefeuille est réellement diversifié. Même si les placements non traditionnels ont récemment été à la traîne des actions mondiales qui ont monté en flèche, ils demeurent un outil essentiel pour accroître la résilience. En intégrant des placements non traditionnels à votre répartition de l’actif, vous pouvez mieux préparer votre portefeuille à composer avec les inévitables bouleversements du contexte financier.