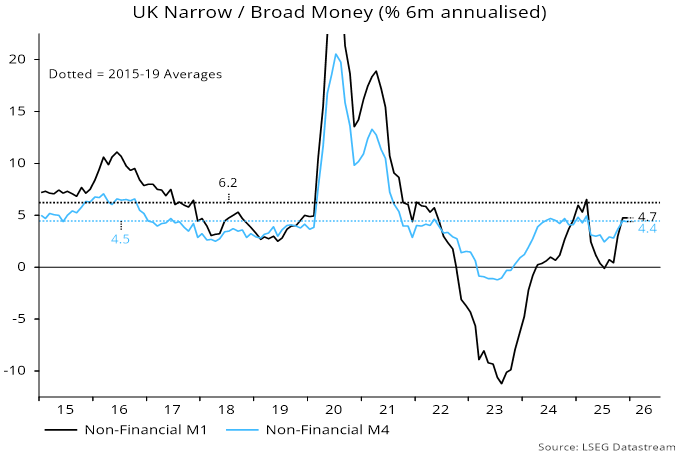
The rapid repricing of global gaming equities year to date reflects a sharp narrative pivot in the market, hitting the stocks of portfolios holding Tencent, as well as other leading players such as Nintendo and Roblox. Only months ago, consensus held that AI would be an operational tailwind for game developers through cost reduction and faster content generation.
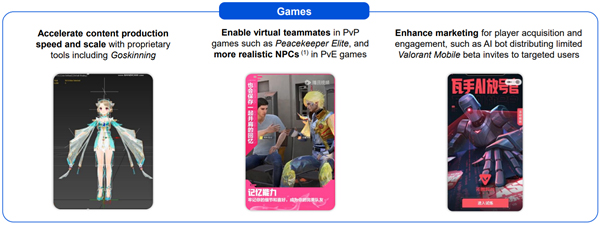
AI enhancing content production and experience
Source: Tencent Investor Relations 2026
Following new AI model releases such as Anthropic’s Claude Code and Google’s Project Genie, the prevailing fear is that AI will disrupt traditional game development entirely.
The question for investors is whether Tencent, as the world’s largest gaming company by revenue, is positioned to benefit from or be impaired by this shift.
AI as a development tool
Tencent’s core strength is scale – both financial scale and model training scale. In discussions with management late last year, they emphasised that AI is already deeply embedded in their workflow: procedural content generation, NPC behavioural modelling, art and animation tooling and faster iteration cycles. These capabilities are not theoretical; Tencent purchases more AI compute and silicon than nearly any other company in Asia, outside hyperscalers.
Small studios will indeed be empowered by AI, lowering entry barriers and enabling “one hit wonder” creators, much like YouTube transformed video production.
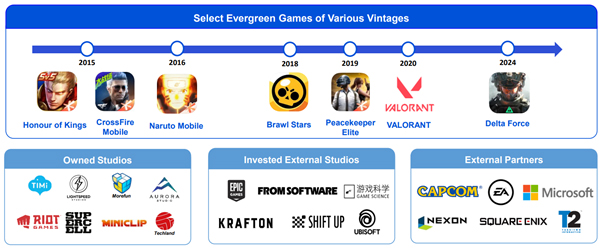
However, distribution, marketing and IP longevity remain durable moats. Tencent excels in all three. Owning evergreen franchises – over 80% of its portfolio – means that even if development costs fall, the value of recognised IP rises.
Source: Tencent Investor Relations 2026
AI makes content easier to create, but not easier to distribute at scale, monetise efficiently or ensure regulatory compliance – areas where Tencent’s ecosystem advantage is overwhelming.
Golden age of movie studios gives way to more atomised content creators – parallels?
Consider the shift from studio dominance in Hollywood to a more atomised creator economy. AI could indeed enable a long tail of nimble game creators, just as digital tools transformed music and film production. If so, Tencent’s role may shift toward that of a global distributor and platform – akin to Netflix in video or Spotify in music.
But unlike movies, gaming economics rely heavily on ongoing monetisation: loot boxes, in-game economies, battle passes, skins and continuous seasonal content. Even if AI reduces production costs, developers with large user bases can simply retain the value by expanding monetisable content. Consumers rarely pay less – they typically pay more in more immersive and interactive environments. Tencent’s superior ability to drive retention and average revenue per user works in its favour.
Fear premium
Tencent today trades at ~16x PE with mid-teens EPS growth, and minimal risk to near-term earnings. This is historically inexpensive for a high-quality global IP and distribution engine. The derating reflects uncertainty over future industry economics – not current fundamentals.
The key debate is not whether Tencent gets disrupted this year (unlikely), but whether AI compresses long duration returns on capital for AAA studios globally.
Markets are trying to reprice the terminal value of moats like content creation and distribution.
Our view: Tencent is better positioned than most
AI will shift value around the gaming ecosystem. Some of that may move to consumers, some to new AI native studios and some to distributors. But scale matters. IP matters. Distribution matters. And Tencent is uniquely advantaged in all three.
The company may face multiple compression as investors debate the long-term competitive dynamics, but fundamentally, Tencent is more likely to be a beneficiary of AI than a casualty. The path will be volatile, but the structural advantages remain intact.
Trump’s trade doctrine: Opening the door to higher-return industrial champions
Last month, I spoke with Benefits and Pensions Monitor about the short-term noise generated by Trump tariff headlines. We explored whether investors should be looking through the noise based on the TACO (Trump Always Chickens Out) view that the US president will retreat in the face of market revolt.
My argument was that, while amusing, TACO risks obscuring the unmistakable direction of travel. US trade policy signals a shift to a multipolar world, defined by a US centric economic sphere and a China centric one, each with competing supply chains, industrial priorities and strategic alliances. Tariffs are signals of tectonic shifts in global trade.
Our view is that these shifts bring risks, but will also be a durable source of opportunity for EM investors.
When China is taken out of your supply chain, everyone makes money
Traditionally, sectors like shipbuilding, industrial machinery, energy logistics and specialty manufacturing have been deeply cyclical with limited pricing power. They lived and died by freight rates, commodity cycles and economic growth. But the combination of US reindustrialisation, reshoring and decoupling from China is transforming these industries.
Historically commoditised, price‑taking businesses are now at the heart of national security and industrial policy. Reindustrialisation and rebuilding supply chains have the potential to drive visibility, margins and returns on capital that would have been unthinkable a few years ago.
For example, the order books of Korean shipbuilders are increasingly less shaped by commercial shipping cycles, and increasingly by long‑cycle defence, LNG infrastructure and government‑aligned industrial programmes across the United States and its allies.
Major opportunities ahead for Korean shipbuilders in LNGC and naval vessels
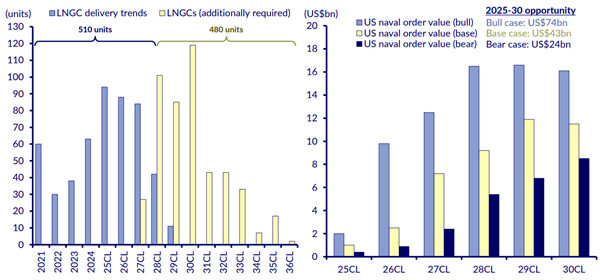
Source: CLSA, Clarksons
US-China decoupling has effectively removed Chinese yards from security‑sensitive projects, structurally elevating demand for non‑Chinese capacity.
For countries aligned with US industrial and security priorities – Korea, Japan, India, parts of ASEAN – select industries have the potential to enjoy rerating as increasingly strategic rather than cyclical businesses.
This extends far beyond shipbuilding. We are seeing it in components for AI data centres, grid and power equipment, strategic metals, defence, electronics, energy infrastructure and advanced manufacturing.
These sectors are beginning to enjoy the boost of multi‑year, policy‑backed spending.
Many EM countries offer the scale, labour force depth and geopolitical neutrality that global supply chains now require. As the world bifurcates, EM manufacturers, suppliers and logistics operators are becoming essential nodes in both the US and China spheres. This creates a long pipeline of opportunities in markets that historically suffered from volatility and low returns.
In short, Trump’s trade doctrine accelerates a global realignment that raises the return potential of industries previously stuck in low‑margin cycles.