Positive for emerging markets
Source: Bloomberg, as at April 10, 2026
Learn fast and adjust
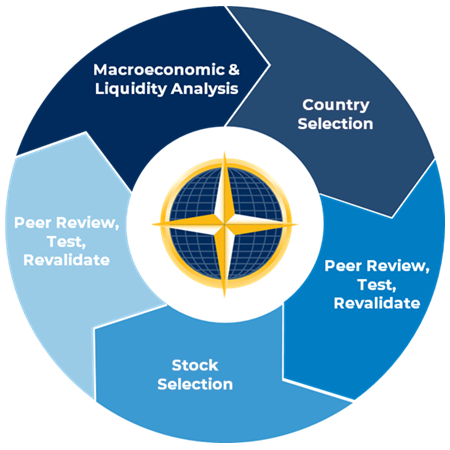
In last month’s commentary, we discussed our approach to forecasting and portfolio management in times of market stress with reference to the OODA (Observe, Orient, Decide, Act) Loop below.
To quickly recap:
Through periods of high uncertainty and violent market moves like what we have currently, we lean heavily into this OODA Loop. This involves a constant testing and re-testing of our macro views and investment hypotheses, and tweaking of the portfolio as conditions change.
We thought this thematic would be worth unpacking further, as these markets provide a great illustration of how a robust process can help navigate periods of high volatility and uncertainty.
Sweating the capital
This approach helps us to remain disciplined, learn fast as new information arrives and make small, frequent adjustments to ensure there is tight alignment between evolving beliefs and portfolio risk.
We call this “sweating the capital,” with the aim being to:
- Limit the size and persistence of errors without dulling upside capture; and
- Maximise risk-adjusted returns over the long run.
In a volatile quarter, the portfolio outperformed thanks to a balance of investments in focused, volatile, risk-on names across niches in the AI supply chain in Taiwan and South Korea, alongside more defensive holdings including oil producers, Asian financials and Brazilian water utilities. The former outperformed through January and February, while the latter helped us hold on to relative gains through a risk-off period in March.
Achieving the right balance of risk across the portfolio is the output a rigorous process based on a set of long held beliefs (the impact of liquidity in driving prices, importance of macro sensitivity in EM and peer review to guard against behavioural error), all of which is all geared to matching the capital in the portfolio with the conviction of the team.
It sounds very simple, but it is a demanding process, requiring tight collaboration across a team of experienced and opinionated investors, as well as the discipline and energy to continually update beliefs, capital and conviction as conditions change.
That discipline is especially important for navigating times of high uncertainty and market volatility.
Process under pressure
The testing and re-testing of investment beliefs in our process takes place formally through weekly investment policy meetings, along with monthly country and stock meetings. This structure helps us orient ourselves and debate how best to move ahead while documenting everything as we go.
Gulf War III is a powerful example of how volatile markets expose habits and test investment beliefs. These periods throw so much information at investors that it can be paralysing to a team without well-established and repeatable decision-making routines.
For us, disciplined preparation, structured collaboration and strong behavioural standards are key tools for us to maintain emotional control and remain focused on execution.
Calm, clear and deliberate decision making
One example of how structure and routine help aid our decision making is through the team stock meeting. Here we discuss any portfolio companies whose stock has moved up or down by a certain threshold amount in relative terms. In either case, this involves the team re-testing the investment hypothesis for a given name to assess whether it remains intact.
We do not rely on static forecasts from the original stock research notes on companies to guide us through an uncertain period like this. Instead, the review trigger – a fairly modest relative stock move – forces us to re-underwrite our forecasts and adjust conviction accordingly.
The result is that we can quickly identify winning ideas and scale them up, as the meeting and team discussion help us cut through the market noise and identify improving fundamentals earlier, even when uncertainty is high. Equally, it allows us to cut losers faster when new information invalidates an investment thesis, helping to avoid thesis drift and subsequent drawdowns.
This process has been crucial for operating in whipsawing markets like this.
It has provided opportunities to tilt the portfolio towards areas where attractive long-term prospects remain intact, and are also more insulated from the energy shock. Below are two examples.
AI memory bottleneck
“High bandwidth memory is the single biggest bottleneck to scaling AI systems today.”
— Dylan Patel (SemiAnalysis), as discussed in an interview on the Dwarkesh podcast, March 2026
As we wrote back in early 2024, the difficulties in scaling up high bandwidth memory supply amid explosive demand to support AI GPU clusters is driving a cycle of unusually strong margins, cash generation and earnings visibility for DRAM giants SK Hynix and Samsung Electronics.
Historically significant – this cashflow is off the scale
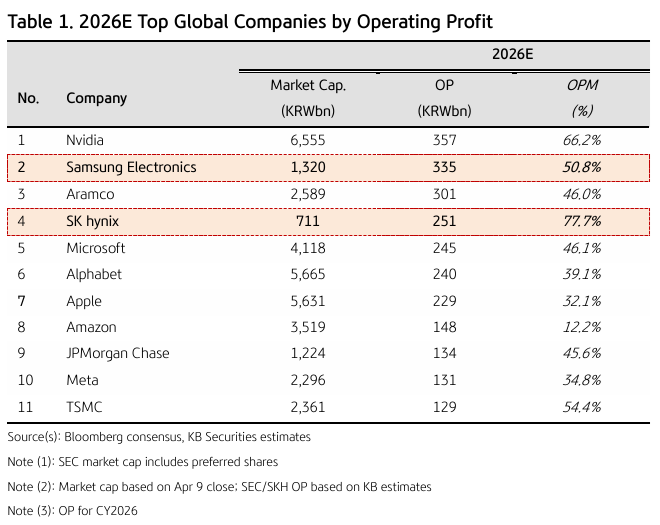
Source: KB Securities, March 2026
However, our level of exposure is tempered by caution over risks of US hyperscalers pulling back AI investment, the emergence of circular financing arrangements and increasing reliance on debt.
Necessity is the mother of invention – cheap energy is China’s answer to US compute edge
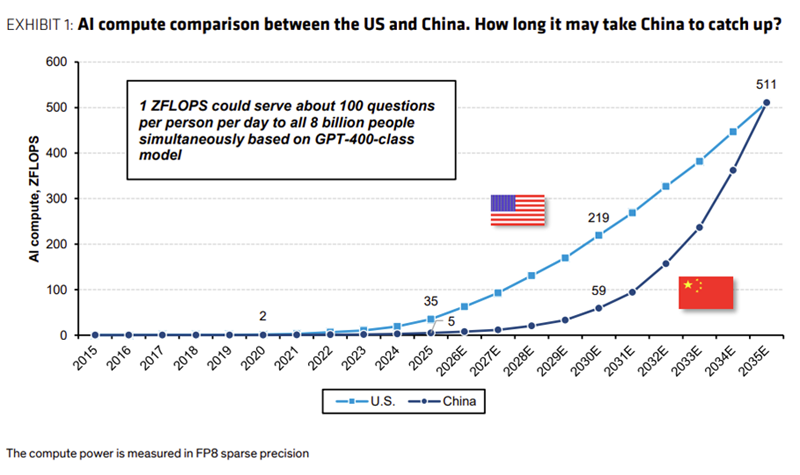
Source: Bernstein, March 2026
China playing catch-up through more (and less efficient) chips and bigger data centres
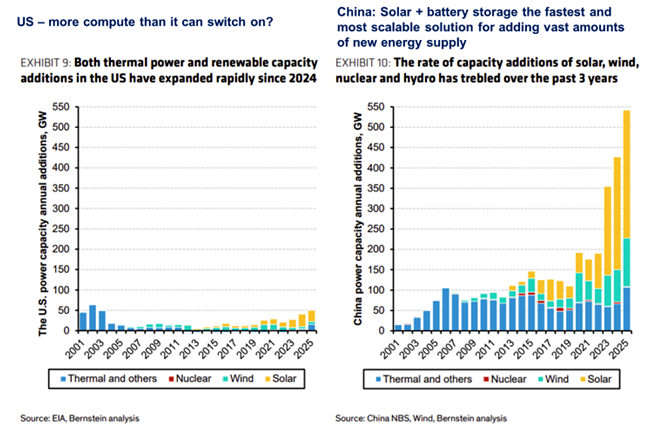
Source: Bernstein, March 2026
Last year, China added an enormous 500 GW of power capacity to its grid, more than the rest of the world combined. Much of this comes from rapid growth of solar energy, by some measures now cheaper than coal power in China.
The battery and power management technology supplied by portfolio company CATL is crucial to this revolution.