Les investisseurs sont depuis longtemps attirés par les actions des marchés émergents en raison de leur potentiel de croissance et des occasions uniques de placement qu’elles offrent. Toutefois, cette prise en compte est moins courante lorsqu’il s’agit des occasions de placement dans des titres à revenu fixe des marchés émergents. Vous pourriez être surpris par les arguments en faveur des titres de créance des marchés émergents et par la façon dont ils pourraient contribuer à la diversification de votre portefeuille et à l’amélioration des rendements, comme le décrit le présent article.
Les titres de créance des marchés émergents désignent les titres d’emprunt émis par des sociétés et des entités souveraines domiciliées dans des économies émergentes. La dette est libellée dans la monnaie locale de l’émetteur ou dans la monnaie d’un marché développé, comme le dollar américain, et est appelée titre de créance en monnaie externe ou en « monnaie forte ». À l’instar de leurs homologues des marchés développés, une note de crédit est attribuée pour faire la distinction entre les titres de créance de premier ordre et les titres de créance de qualité inférieure (à rendement élevé).
Voici quelques-unes des principales caractéristiques des marchés émergents :
- Catégorie d’actif importante et diversifiée : la valeur marchande combinée des émetteurs souverains et des sociétés des marchés émergents libellée en monnaies locales et externes est supérieure à celle du marché des obligations du Trésor américain.
- Rendements plus élevés : les marchés émergents peuvent offrir une prime de rendement par rapport aux titres comparables des marchés développés.
- Endettement moins élevé : les emprunteurs sont généralement moins endettés que les emprunteurs des marchés développés ayant une cote de crédit similaire.
- Taux de défaillance inférieur : le taux de défaillance est inférieur à celui des titres comparables des marchés développés.
- Avantages de la diversification : la faible corrélation avec les titres de créance des marchés développés, due aux différences de cycles économiques et de conjoncture par rapport aux marchés développés, procure des avantages sur le plan de la diversification.
Taille du marché
Le volume des émissions de titres de créance des marchés émergents pourrait surprendre de nombreux investisseurs, surtout si l’on tient compte du marché des obligations souveraines et des obligations de sociétés libellées en monnaies locales et externes, dont la valeur marchande est supérieure à celle des obligations du Trésor américain (figure 1).
Figure 1 – Principaux marchés des titres à revenu fixe
| Principaux marchés des titres à revenu fixe |
Occasions de placement (G$) |
| Obligations du Trésor américain |
23 900 $ |
| Titres souverains des autres marchés développés |
14 700 $ |
| Titres souverains des marchés émergents libellés en monnaies locales |
11 100 $ |
| Obligations de sociétés des marchés émergents libellées en monnaies locales |
10 700 $ |
| Titres adossés à des créances hypothécaires émis par des organismes des États‑Unis |
8 400 $ |
| Titres de créance de premier ordre des États‑Unis |
7 800 $ |
| Obligations de sociétés des marchés émergents libellées en monnaies externes |
2 500 $ |
| Titres souverains des marchés émergents libellés en monnaies externes |
1 500 $ |
| Obligations américaines à rendement élevé |
1 400 $ |
|
Source : JP Morgan
Les obligations souveraines et de sociétés des marchés émergents libellées en monnaies locales présentent la plus forte valeur marchande. Du point de vue de l’emprunteur, l’émission de titres de créance libellés en monnaies locales signifie que si un pays est fortement endetté, par exemple en dollars américains, et que sa monnaie chute par rapport au dollar américain, le remboursement de la dette deviendra plus coûteux. Cependant, l’émission de titres de créance libellés en monnaies externes peut aider à diversifier les sources de financement en permettant aux pays émergents de profiter des marchés financiers internationaux.
Du point de vue du gestionnaire d’actifs, l’avantage supplémentaire d’investir dans des titres de créance des marchés émergents libellés en monnaies externes, tant d’entités souveraines que de sociétés, est que cela peut aider à gérer les risques associés aux fluctuations des taux de change locaux. De plus, les titres de créance des marchés émergents en monnaies externes sont généralement régis par le droit de New York ou du Royaume-Uni, tandis que les titres de créance des marchés émergents libellés en monnaies locales sont assujettis aux lois spécifiques du pays émetteur. Les titres de créance des marchés émergents libellés en monnaies externes offrent également un univers plus diversifié d’occasions de placement. Le reste du présent article portera donc sur les titres de créance des marchés émergents libellés en monnaies externes.
Transformation du contexte de placement
Le marché des titres de créance des marchés émergents a subi une importante transformation. Au début des années 1990, les indices se composaient de seulement 10 pays et privilégiaient fortement les économies d’Amérique latine. Aujourd’hui, l’univers des pays est beaucoup plus sain et, contrairement aux indices boursiers dont la capitalisation boursière est dominée par un petit nombre de pays, les indices des obligations souveraines et de sociétés sont beaucoup plus diversifiés sur le plan des pays (figure 2).
Figure 2 – Indice des obligations souveraines et de sociétés des marchés émergents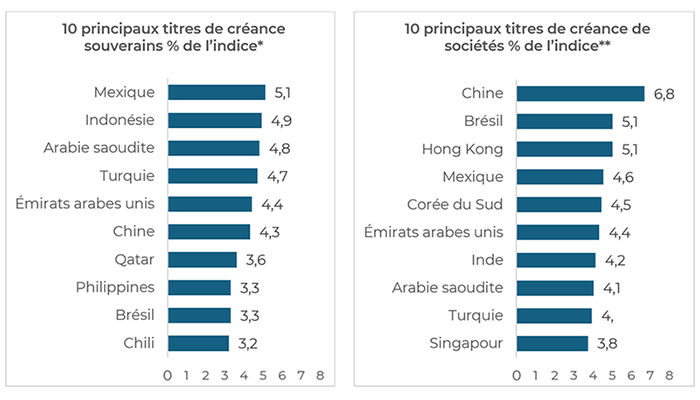 *Indice JP Morgan EMBI Global Diversified **Indice JP Morgan CEMBI Broad Diversified
Source : JP Morgan, Bloomberg
Le volume annuel des titres de créance émis par les marchés émergents a également été vigoureux, les émissions de titres de créance de sociétés ayant tendance à être plus importantes que celles des titres de créance souverains (figure 3).
Figure 3 – Émission des titres de créance des marches émergents
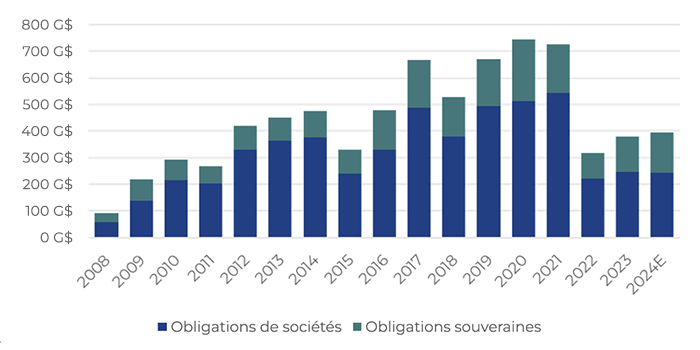 Source : JP Morgan & FortWood Capital
Principaux avantages des titres de créance des marchés émergents
Rendement plus élevé : le marché des titres de créance des marchés émergents offre une prime de rendement par rapport aux marchés développés comparables en raison des risques plus élevés perçus. À l’heure actuelle, les marchés émergents offrent certains des taux les plus élevés depuis la crise financière mondiale (figure 4).
Figure 4 – Rendement des titres de créance des marchés émergents par rapport aux obligations du Trésor américain à 10 ans
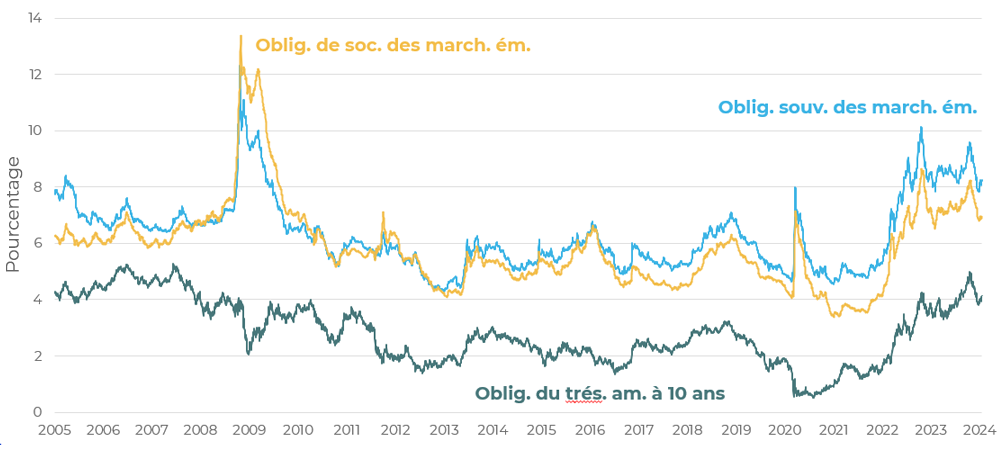 Remarque : Indice des obligations souveraines des marchés émergents – EMBI Global Diversified, indice des obligations de sociétés des marchés émergents – CEMBI Broad Diversified
Source : JP Morgan, Bloomberg
Les marchés émergents sont souvent sensibles à la volatilité politique et économique. Les changements de gouvernement et de politique ainsi que les tensions géopolitiques peuvent avoir une incidence sur la solvabilité des émetteurs. Les titres de créance souverains ont aussi tendance à avoir une durée plus longue (sensibilité aux fluctuations des taux d’intérêt) et, lorsqu’ils sont combinés, ces facteurs font que les titres de créance souverains des marchés émergents offrent généralement des rendements plus élevés que les titres de créance de sociétés des marchés émergents.
Endettement moins élevé : le risque perçu lié aux titres de créance des marchés émergents n’est pas toujours justifié, malgré les taux de rendement plus élevés. Par exemple, les émetteurs d’obligations de sociétés des marchés émergents, qu’ils soient de premier ordre ou à rendement élevé, sont moins endettés par rapport à leur capacité de générer des flux de trésorerie pour rembourser cette dette et sont moins endettés que les emprunteurs des marchés développés ayant la même cote de crédit (figure 5). Malgré un endettement moindre, les obligations des marchés émergents ont généralement procuré aux investisseurs des taux de rendement plus élevés pour la même cote de crédit.
Figure 5 – Comparaison de l’endettement net
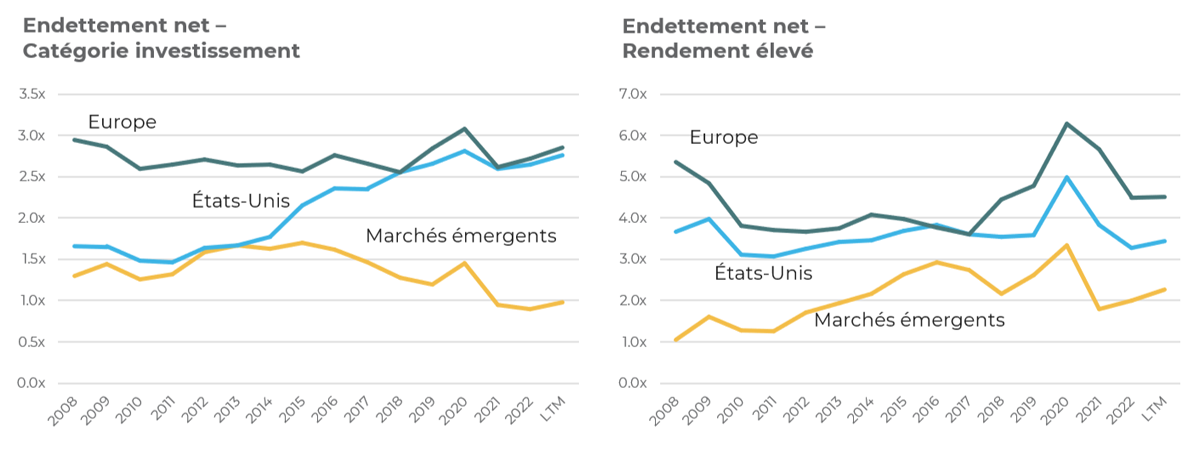 Source : JP Morgan (en date de 2023) et FortWood Capital
Taux de défaillance inférieur : le taux de défaillance des émetteurs des marchés émergents est historiquement plus bas que celui de leurs homologues des marchés développés possédant une cote comparable (figure 6). De nombreux marchés émergents affichent une solide croissance économique qui peut soutenir la solvabilité des émetteurs. Par exemple, une croissance économique plus forte peut accroître les revenus des sociétés, facilitant ainsi le remboursement de la dette.
Figure 6 – Le taux de défaillance des sociétés des marchés émergents est inférieur à celui des sociétés des marchés développés
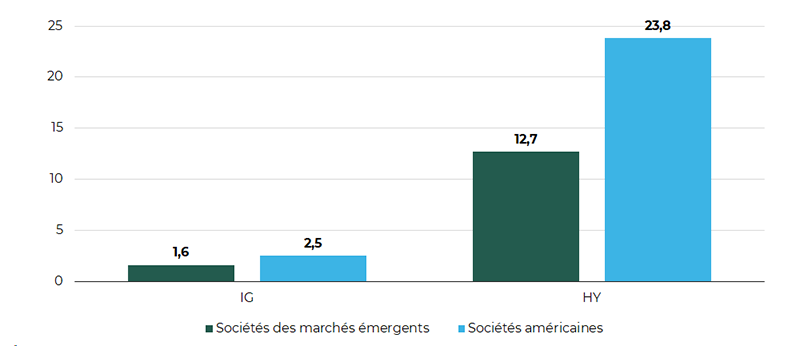 Source : S&P Global Ratings Research et FortWood Capital
Avantages de la diversification : les cycles économiques et les conjonctures des marchés émergents diffèrent souvent de ceux des marchés développés. Cette expérience différente réduit la corrélation, offrant ainsi une source de diversification du portefeuille. Investir dans différents pays, secteurs et émetteurs peut réduire l’incidence des problèmes locaux et améliorer la résilience globale du portefeuille.
Facteurs à prendre en compte lors de la construction du portefeuille
Gestion des devises : pour permettre aux investisseurs canadiens de gérer toute incidence défavorable des fluctuations de change entre les titres de créance des marchés émergents libellés en dollars américains et le dollar canadien ($ CA), le portefeuille est habituellement couvert en dollars canadiens, ce qui procure des rendements plus prévisibles. Le gestionnaire de placement de la stratégie peut obtenir cette couverture de façon rentable en ayant recours à des contrats à terme sur le change ou à d’autres instruments de change.
Liquidité : les titres de créance des marchés émergents sont généralement une catégorie d’actifs liquides. Par exemple, la liquidité des obligations de sociétés des marchés émergents est généralement comparable à celle des obligations de sociétés des marchés développés dans des conditions normales de marché.
Gestion active : il existe de nombreux cycles économiques et politiques idiosyncrasiques dans les différents pays, qui peuvent contribuer à des occasions de valeur ajoutée pour les gestionnaires actifs. De plus, comme pour les actions des marchés émergents, le nombre de spécialistes de la recherche sur les titres de créance des marchés émergents est moins élevé que celui des titres de créance des marchés développés, ce qui crée des occasions de recherche indépendante. Les gestionnaires actifs compétents peuvent déceler les nuances du marché, repérer des occasions intéressantes et ajuster les placements en fonction de l’évolution des conditions.
Investissement responsable : malgré les problèmes politiques et sociaux liés aux pays émergents, les gouvernements et les sociétés reconnaissent de plus en plus l’importance des facteurs environnementaux, sociaux et de gouvernance (ESG).
Une occasion à saisir
Les titres de créance des marchés émergents offrent des occasions de placement intéressantes, avec un potentiel de taux plus élevés, des avantages sur le plan de la diversification et une exposition à des économies à forte croissance. Les titres de créance des marchés émergents peuvent constituer un ajout précieux à un portefeuille de placement bien équilibré.


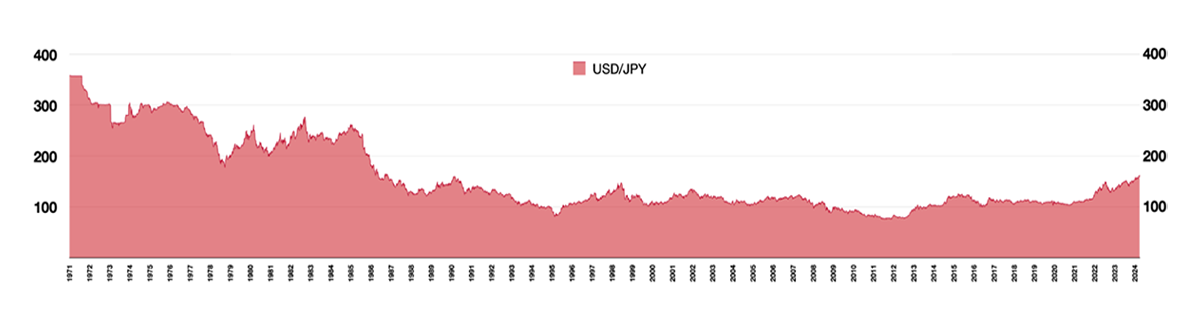 Source: Bank of Japan
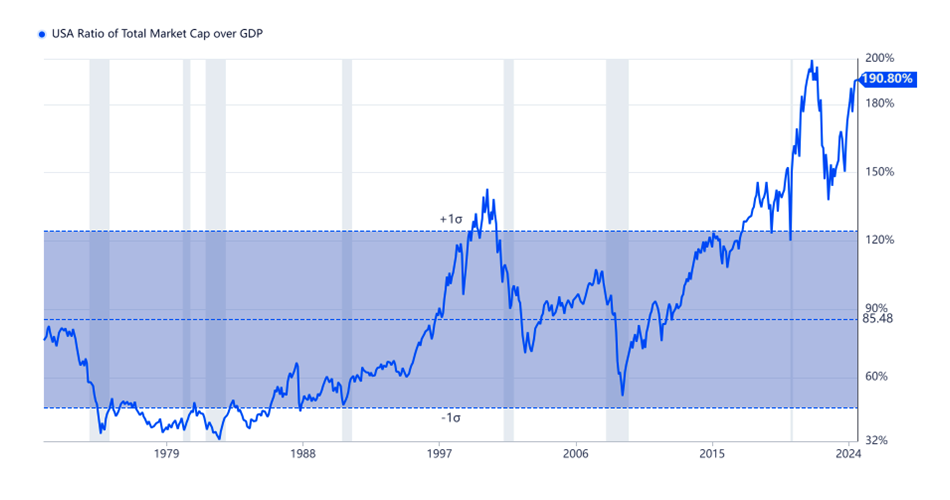 Source: public
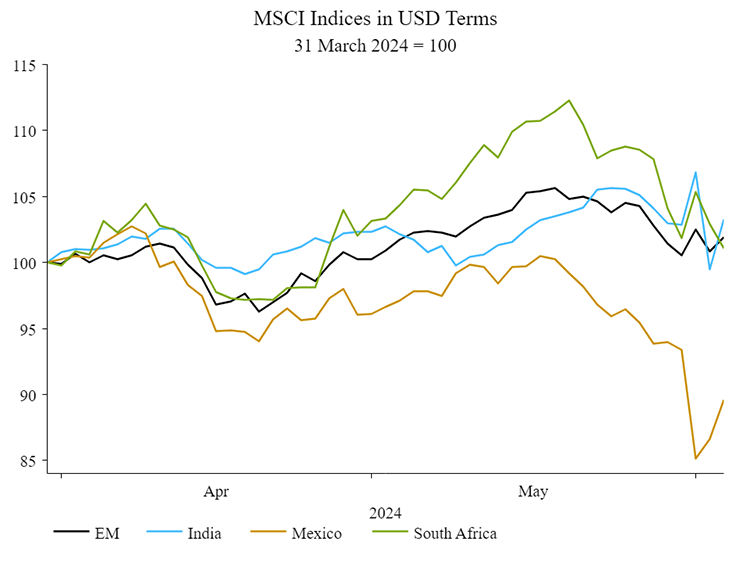
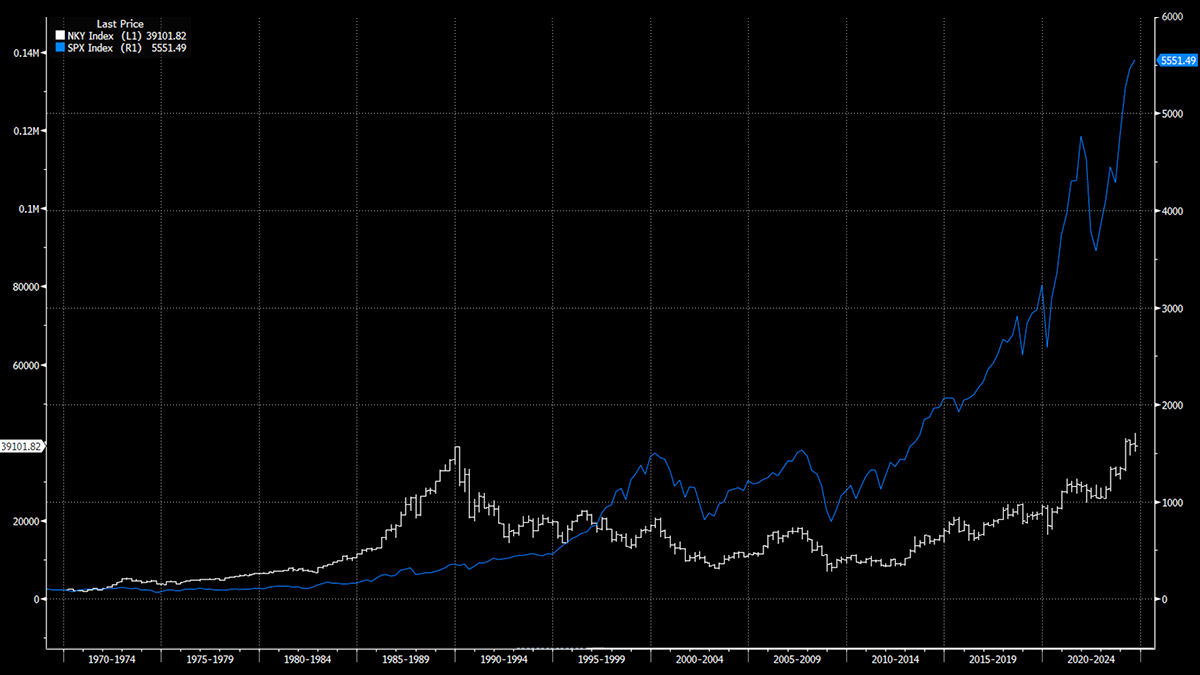
 Source: public


 Source: NS Partners.
 Source: NS Partners.
 Source: NS Partners.
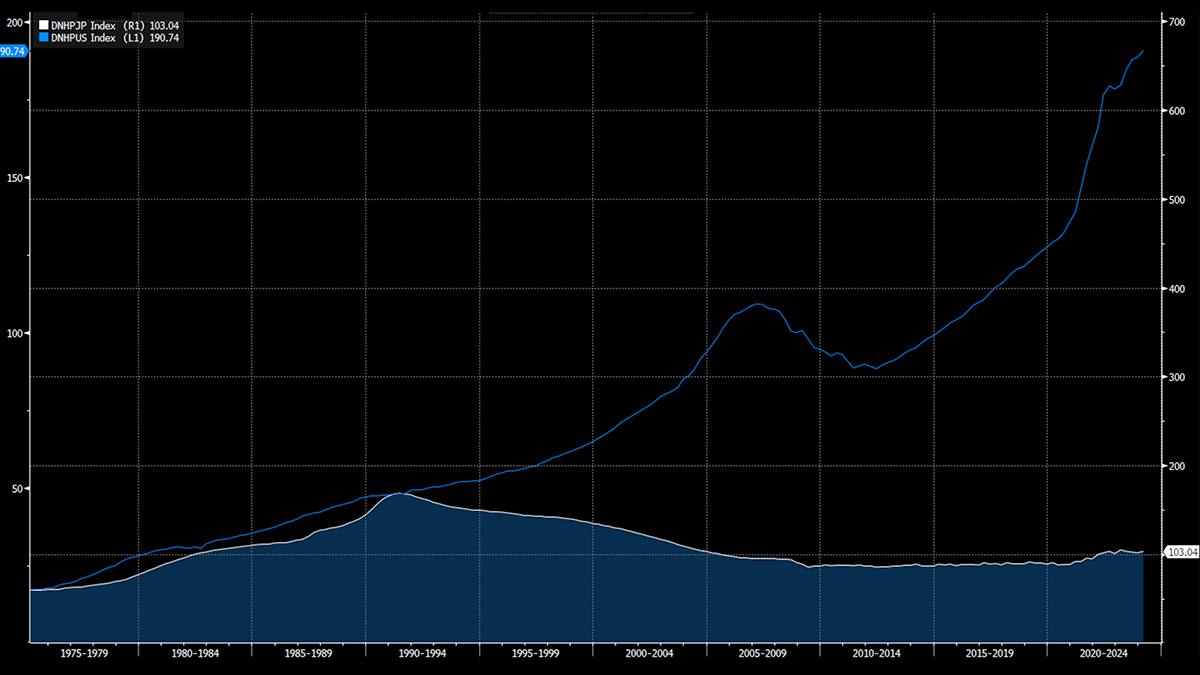
 Source: NS Partners and LSEG Datastream.
 Source: NS Partners and LSEG Datastream.
 Source: NS Partners and LSEG Datastream.
 Source: NS Partners and LSEG Datastream.
 Source: NS Partners and LSEG Datastream.