The strategy focuses on investing in frontier and emerging market companies that our team expects will benefit from demographic trends, changing consumer behaviour, policy and regulatory reform and technological advancements.
Below, we explore several key factors that influenced returns during the second quarter of 2025 and share observations on the portfolio and the markets.
Internet and technology portfolio
The portfolio’s returns in the second quarter and throughout the first half of the year was primarily driven by the internet and technology sector. Key contributors included Fawry for Banking Technology & Payments S.A.E. (FWRY EG), Baltic Classifieds Group PLC (BCG LN) and Allegro.EU SA (ALE PW) which have been discussed in detail in previous letters. It is worth mentioning that Allegro shares benefited from a very strong Polish equity market backdrop this year with the WIG20 Index up ~30% in zloty terms as of end of June 2025. Fortunately, fundamentals have also been very supportive; expectations are for mid-teens EBITDA growth in 2025 and the company has allocated 4% of market capitalisation in share buybacks. The company’s decision to diversify its last-mile logistics (primarily parcel lockers) and reduce reliance on the dominant provider InPost can generate operational efficiencies and support margins if executed properly (for context, Allegro’s shares have outperformed InPost’s by 45% in constant currency since the announcement of Allegro’s new strategy in March this year). We also finally see a path to a clearing of the multi-year share overhang from private equity ownership as share sales are absorbed well by the markets, aided by passive index trackers which systematically react to increases in free float market capitalisation.
One drag in the internet and technology portfolio that is worth mentioning is Talabat Holding Plc (TALABAT AE), the leading food delivery and quick commerce company in the Middle East and Africa region. While we have reservations on the quality of food delivery business models, we found Talabat’s market penetration, diverse geographical dominance and valuation appealing. The company’s monetisation model impressed us; it generates 3.5% of gross merchandise value in advertising income (AdTech) and has built a healthy but competitive take-rate model from restaurant partners and consumers. Additionally, Talabat’s grocery offering (quick commerce) is the most developed we’ve seen among food delivery companies in the region with ~25% revenue contribution. We believe the market is overly concerned with competitive risks arising from the entry of Keeta (a Meituan company) into key Talabat markets like the UAE, Kuwait and Qatar. This has resulted in a fading of Talabat’s forward P/E ratio from ~18x at IPO last year to under 12x. This is a significant discount to domestic and global peers that are inferior on almost every metric. Talabat is a small position for the strategy and we acknowledge that the multiple is likely to be supressed until there is visibility on Keeta’s capabilities in its key markets. That said, we see a favourable risk-reward set up for the shares on the view that Talabat’s margins will exhibit resilience (relative to market expectations) in the next 12-18 months as Keeta enters the market.
Industrials portfolio
The industrials portfolio was a bright spot for the strategy with solid outperformance in the shares of Malaysian companies Westports Holdings Bhd (WPRTS KL) and Kelington Group Bhd (KGB KL).
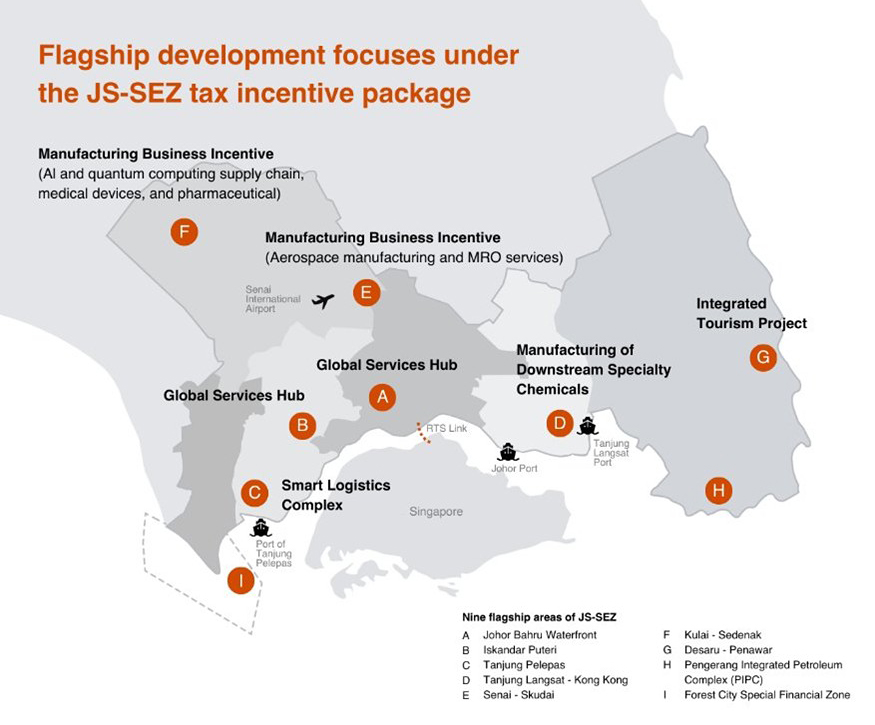
Westports is a leading Malaysian port operator based in Port Klang, strategically located along the Straits of Malacca. It serves as a major gateway for container and conventional cargo for central Peninsular Malaysia and is one of the region’s key transshipment hubs, competing with the likes of Port of Tanjung Pelepas (PTP) and Port of Singapore. We acquired shares in Westports in the quarter as they came under pressure from concerns on slowing global trade from tariffs. Our thesis on Westports was that the volumes it handles will be relatively resilient given low exposure to Asia-US trade flow and relatively high exposure to gateway traffic (~50% of 2024 revenue are on containers destined to Malaysia as an end market). We also saw option value in the shares as the market was not pricing in a potential regulatory rate hike. Much to our delight, this was gazetted soon after we invested in the company and led to a significant upward revision of earnings across the street that supported the rally in the shares.
Kelington is a founder-led engineering solutions provider with a core competency in Ultra-High Purity (UHP) gas and chemical delivery systems for semiconductor, flat-panel display, solar and LED manufacturers. We purchased Kelington shares in the fourth quarter of 2024 and continued to build a position in the company as we got more familiar with the management team and the business model. We like Kelington for its UHP solutions business in particular; UHP systems are engineered networks that transport and regulate gases and chemicals used in semiconductor fabrication. These systems must maintain purity levels of 99.9999% (6N) or higher, as even microscopic contaminants can ruin wafers or reduce yield. We expect Kelington to be a major beneficiary of the “semiconductor sovereignty” theme and are bullish on its ability to capture that growth over the next few years.
The strategy experienced some underperformance (relative to the performance of the industrial portfolio) from TAV Havalimanlari Holding AS (TAVHL IS). TAV is a Turkish-listed airport operator and services company with a portfolio of 77 airports in 19 countries which it manages directly or through co-management agreements with industry partners. TAV shares came under pressure following the escalation in the Middle East in June as concerns over air travel and tourism mounted. We saw an opportunity to add to the shares after the US-mediated ceasefire was reached. We are relatively early in our ownership of TAV but are impressed with its track record and exposure to unique airport assets in regions that will experience long-term growth in air travel.
Healthcare and education portfolio
The healthcare and education portfolio had a good quarter led by Benefit Systems SA (BFT WA). BFT provides non-payroll employee benefit solutions with a strong focus on fitness, wellness and lifestyle service in its home market of Poland and several regional markets including Czechia, Slovakia, Bulgaria, Croatia and Türkiye. BFT is a play on the growth in wellness and corporate HR budgets. It dominates the Polish B2B wellness market with a base of ~1.7 million cards (~70% of the market). In addition to being a key customer acquisition channel for third-party fitness clubs, BFT operates its own network of over 240 clubs which helps it maintain healthy site utilisation, good user experience and a strong bargaining position vis-à-vis third-party clubs. BFT’s management has been vocal about its regional ambitions and followed that through this year with a ~USD430 million acquisition of Türkiye’s leading fitness club operator MACFit. BFT is betting that it can leverage MACFit’s 121 club network in Türkiye to build a B2B wellness card business that is similar to the one it built in Poland. While it is early days, the MACFit asset is highly profitable and allows the company time to thoughtfully develop its B2B business in the country. There was some corporate activity on the share registry of BFT in the quarter with the founder (who is no longer involved in the business) exiting his remaining ~14% stake in the company to a very healthy book of mainly local institutional investors. This resulted in improved liquidity on the shares with daily average traded value increasing to over USD3 million a day since the transaction was completed in March from the 2024 average of USD1.4 million.
Outlook
The investment environment continues to be volatile. Erratic policy making, a shifting geopolitical landscape and mixed signals about the health of the global economy still carry a lot of future uncertainty with them. On the other hand, corporate earnings appear healthy.
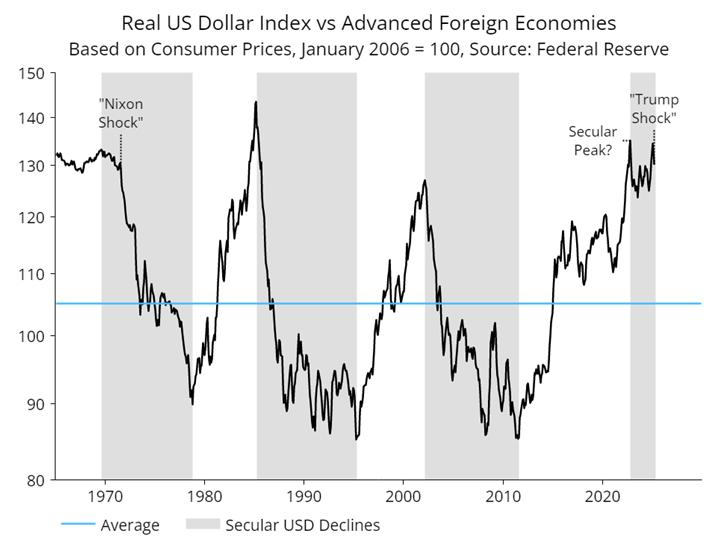
With the artificial intelligence theme firmly in play, fiscal spending is on the rise across much of the Western world and valuations are buoyed by a weak US dollar and expectations of monetary easing from whoever will be running the US Fed in the next 12 months.
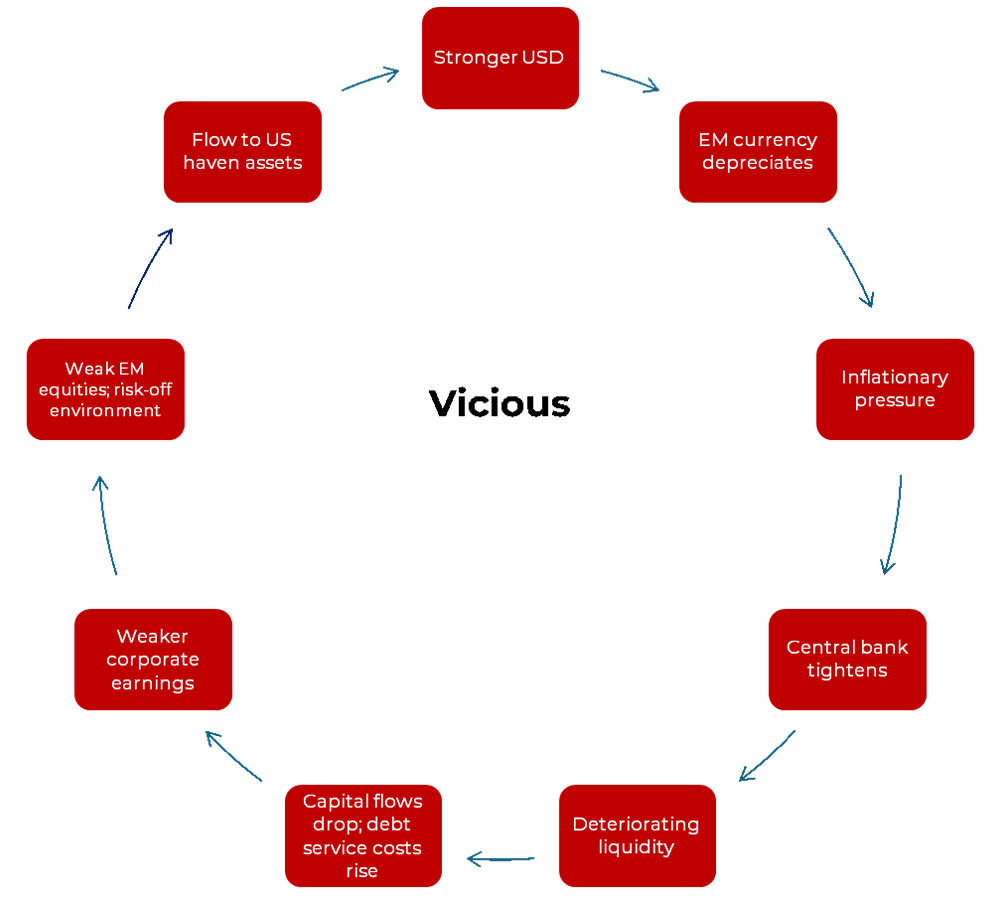
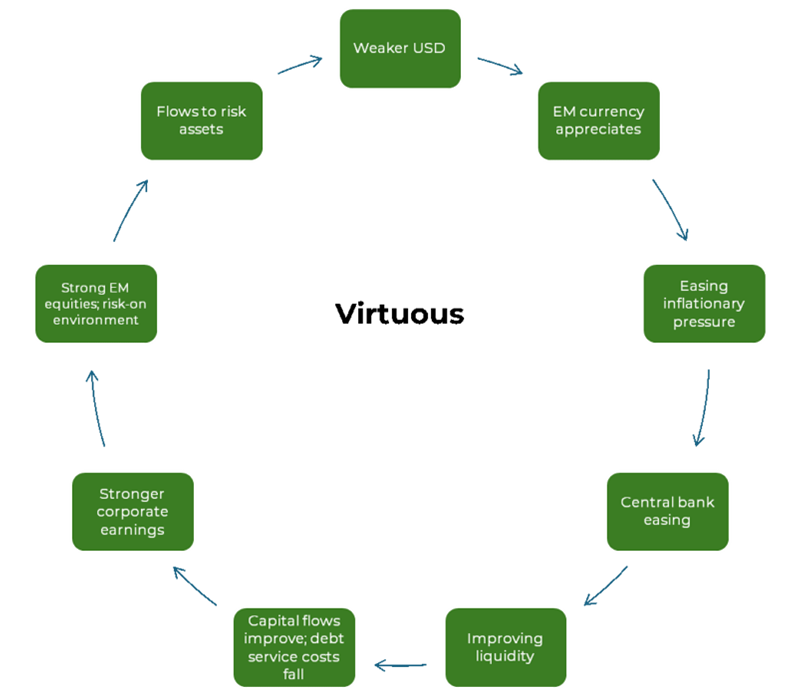
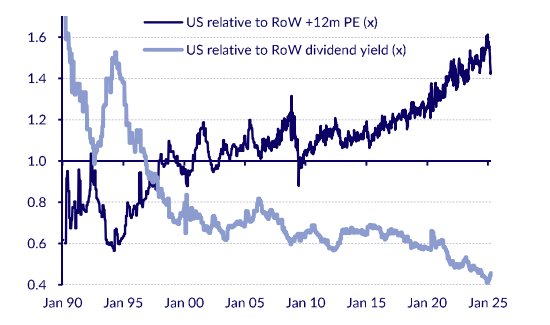
As discussed in our last outlook, a weak US dollar is a net positive for most of our markets as it creates breathing room for central banks to cut rates without importing inflation through currency depreciation. We see that theme intact for the time being and as such, expect a supportive environment for valuations and corporate earnings growth.
At a micro level, we continue to be encouraged by the strong pipeline of ideas that we are generating and believe that signals a healthy environment for the strategy. More importantly, and as demonstrated in some of the company examples we gave earlier, the portfolio comprises unique, high-growth companies that we believe are under-owned in an EM equity context and have the potential to generate significant capital appreciation over time.
We look forward to updating you on the strategy in the next letter.


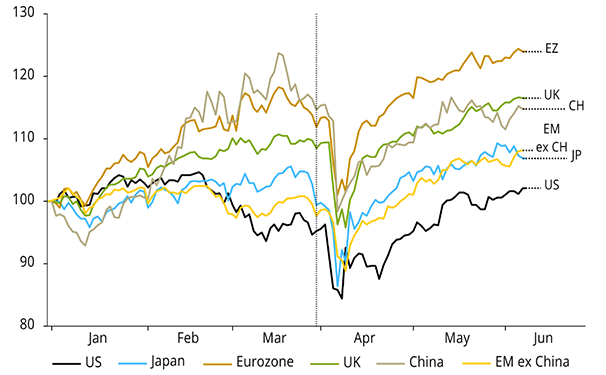


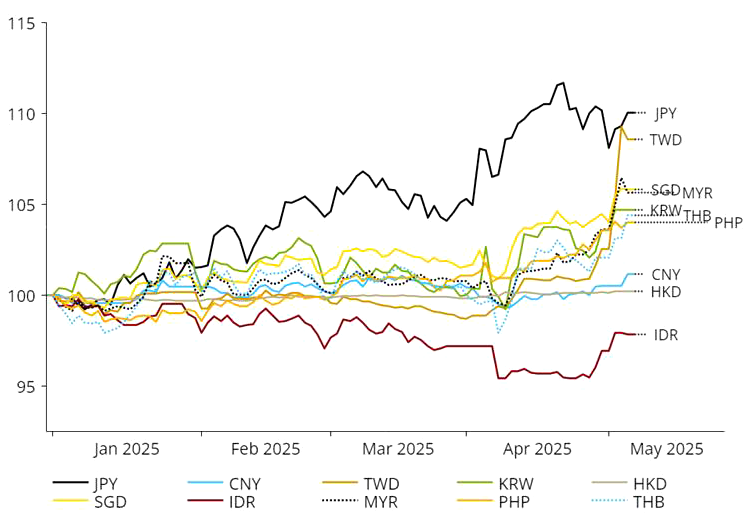 Source: NS Partners and LSEG (May 2025)
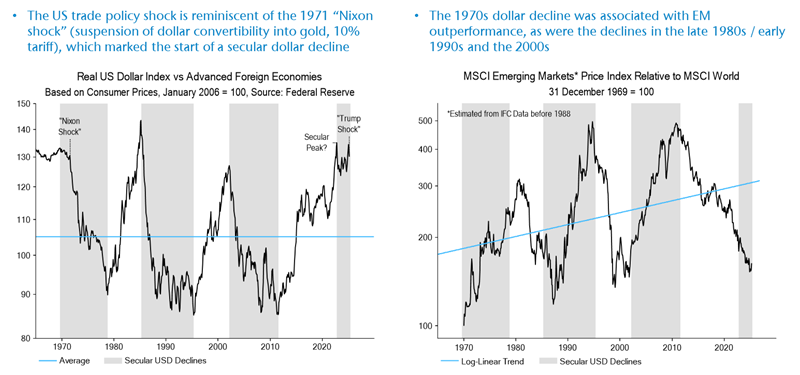 Source: LSEG Datastream
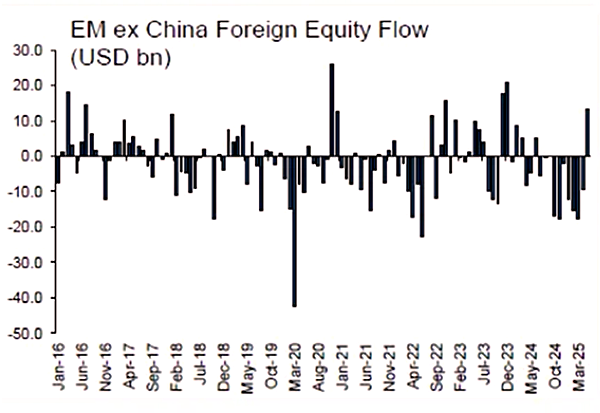