Aerial view of a Tractor fertilizing a cultivated agricultural field.

In 2013, the investment world was introduced to the term FANG by CNBC’s Mad Money host. Of course, we all know the tech giants represented by this acronym: Facebook, Amazon, Netflix, and Google.

Almost a decade later, the term FANG is back in the news. But this time around, the almighty tech companies have been dethroned by four of the most traditional, old school industries in the world. We’re talking about Fuel, Agriculture, Natural Resources, and Gold.

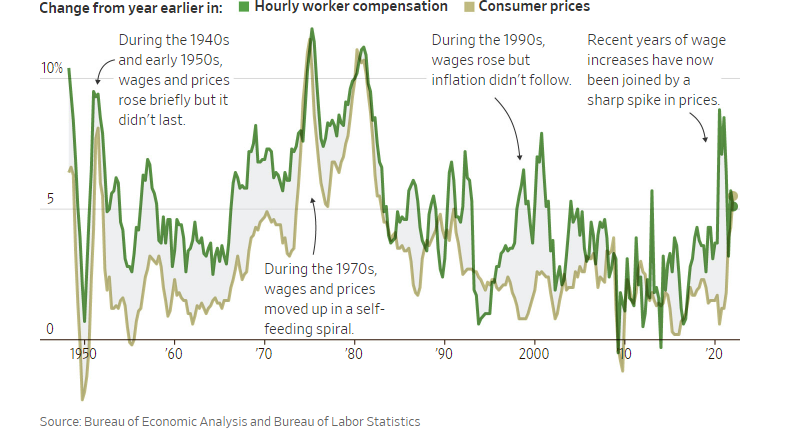
Historically every time this group took the lead in the last century (1939, 1972, 2000), we have seen inflation skyrocket for years to come, leading to political unrest around the world and major corrections in financial markets. We are set to see history repeat itself once again.

In today’s weekly we focus on agriculture, which is heading into a super cycle.

Time and time again, the agriculture industry has weathered economic uncertainty. No wonder it’s one of the oldest, most reliable asset classes. It is also one of the best inflation hedges as food prices are closely linked to inflationary trends.

How big is the agriculture industry?

American farms alone contributed $124 billion in United States (U.S.) gross domestic product in 2020. Farmland is still an unknown asset for many, and the largest farmland owner in the U.S. is not even a farmer. It’s Bill Gates, who currently owns 242,000 acres of land. Isn’t it ironic that one of the world’s biggest tech company founders sees more value in dirt? Clearly this is an indicator that land is about to get a lot more valuable.

Globally, agriculture is a large and growing industry worth over $10 trillion in 2020. It is expected to increase to $12 trillion in the coming years.

The drivers for this growth are simple:

  • an ever-expanding global population,
  • urbanization, and
  • transition towards regenerative sustainable farming.

Russia/Ukraine impact on global Agriculture

The war in Ukraine has delivered a shock to global energy markets. Now the planet is facing a deeper crisis: a shortage of food. Since the invasion last month, wheat, barley and fertilizers have seen prices increase over 20 percent.

With a cultivation of about 32 million hectares of land, Russia and Ukraine supply a quarter of the world’s wheat and half of its sunflower products.

Ukraine is known as the “breadbasket of Europe” thanks to its perfect climate and ideal geology for agriculture. Over 70 percent of the landscape consists of fertile plains with deep rich soils. Ukraine has warm summers, cold winters, and plenty of rain, providing excellent conditions for plant growth, and disease and pest prevention.

An unstable Ukraine = Another Arab Spring?

Ukraine is the world’s fifth-largest producer of corn (maize), and the eighth-largest producer of wheat. Approximately 12% of Ukrainian corn is sold to Egypt. It accounts for 80% of Lebanon’s and 25% of Egypt’s wheat imports, and is a leading supplier for countries like Somalia, Syria and Libya. It should come as no surprise that the current conflict will push up commodity prices even further.

Most Middle East countries use the Black Sea for trade. However, due to the war in Ukraine agriculture supplies (and all other products) have to travel a different route – which given current fuel prices will only increase the freight cost. Supply shortage and an expensive freight will further compound price inflation in the Middle East.

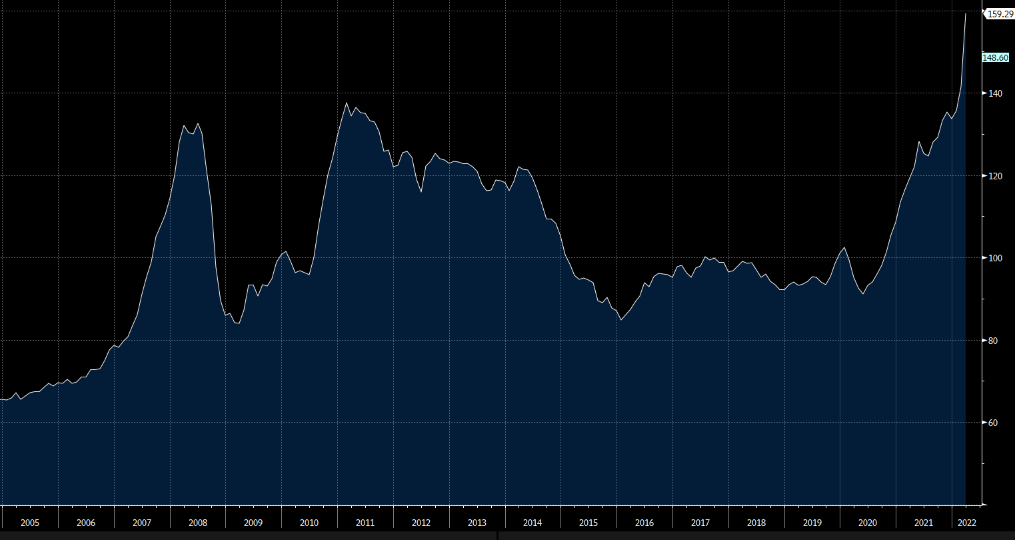
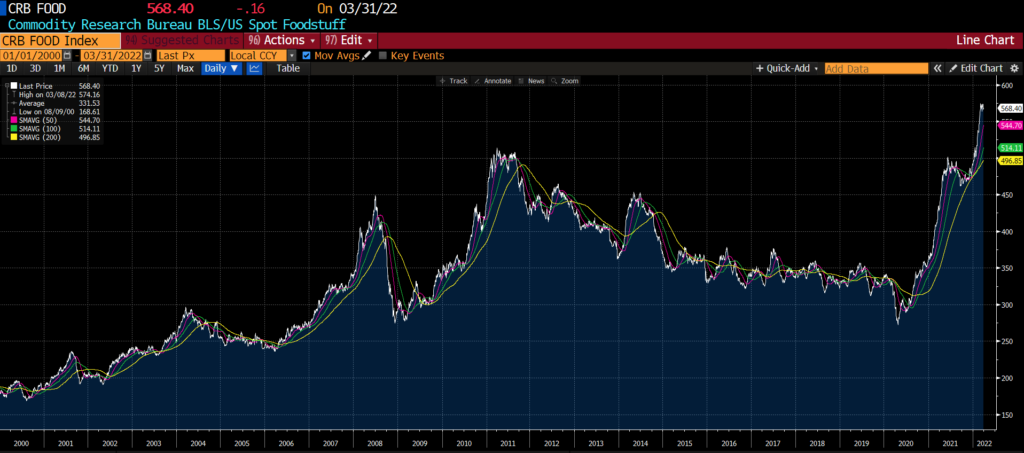
When we look back to 2009/10, food prices were one of the main triggers of the Arab Spring uprisings in the Middle East. Back then, social unrest started in Tunisia, which saw its authoritarian government fall in less than two weeks. Then the crisis hit countries like Egypt, Yemen, Libya, Syria, and Saudi Arabia. In the chart below we can see that food prices have already exceeded levels last seen in 2011. We could be looking at another round of instability in the middle east.

Source: Bloomberg

Portfolio impact

Our portfolio is extremely well positioned to benefit from both high inflation and opportunities in the fast growing agriculture industry. 

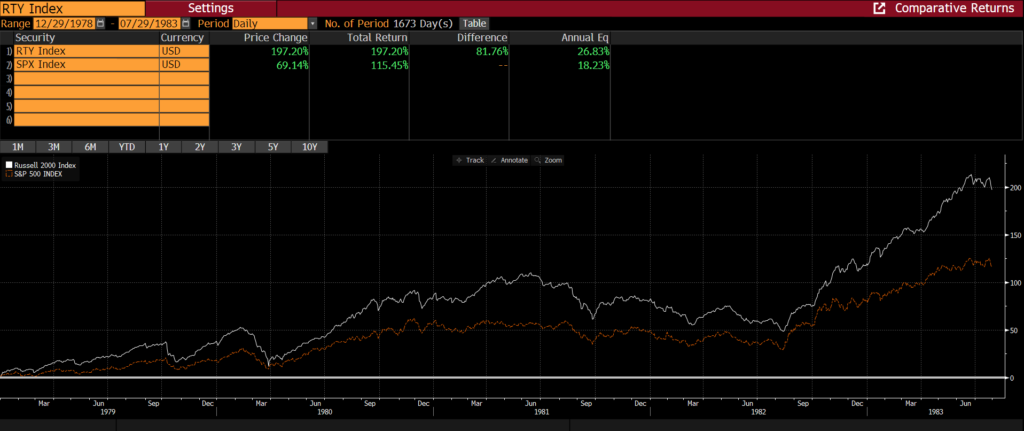
When it comes to inflation, smaller companies generally outperform their larger peers. From January 1979 to July 1983, the Russell 2000 Index outperformed the S&P 500 Index by 81% (see chart below). During this time, inflation rose to as high as 13% and the economy suffered a double-dip recession in 1980 and 1981-82, before staging an extremely strong recovery in 1983 with growth rates as high as 8.5%.

Source: Bloomberg

In the agriculture industry, we own the following names which we believe will grow faster than the industry and deliver superior earnings.

Limoneira (LMNR)

Founded in Ventura County, California in 1893, Limoneira is one of the largest growers and marketers of lemons in the U.S. It is also the largest grower of avocados in the U.S. Besides the steadily growing agribusiness, Limoneira’s strategy is to unlock the value of over 10,000 acres of agricultural land, real estate development opportunities and water rights mainly in Southern California.

Titan Machinery (TITN)

Titan Machinery is the largest Case New Holland dealer in the U.S. with 75 stores, mainly in the Midwest, and some in Eastern Europe. According to the U.S. Department of Agriculture (USDA), net farm income is 26% higher than the 10-year average. Farm income is forecasted to reach its highest level since 2013. This bodes well for equipment upgrade cycles in general. Also, drought in South America is causing a shortage of soybeans and corn. U.S. farmers are now focusing on these crops and should see higher incomes well into 2023.

Lindsay Corporation (LNN)

Based in Omaha, from its humble beginnings as a small operation in rural American Midwest, Lindsay has become a global leader in irrigation and infrastructure. Their irrigation and water management solution should see strong take rates by farmers.

Farmland Partners (FPI)

Farmland Partners is a real estate company that owns approximately 160,000 acres of high-quality farmland in 17 states. Their land is being farmed by over 100 tenants who grow 26 major commercial crops. Farmland should benefit not only from increased rent, but also some profit share agreements on certain properties.

Bucher Industries AG (BUCN) 

Bucher is an internationally operating Swiss engineering group. Bucher’s divisions are focused on specialized agricultural machinery, municipal vehicles, hydraulic components, manufacturing equipment for the glass container industry, as well as equipment for processing of beverages.

Sakata Seed (1377)

Based in Yokohama, Sakata is a leading seed company in Japan. Sakata ranks in the top three for vegetable and flower seeds in Japan, and number six in the world. They have a product lineup of 1700 flower varieties of 100 species and 400 vegetable varieties (mainly broccoli, cabbage, carrot).

Meanwhile, Global Alpha is back on the road again. In less than a month, we will be visiting holdings like Limoneira and Farmland Partners to evaluate their operations and performance. We have also begun visiting trade shows and have recently returned from the 43rd Annual Institutional Investors Raymond James conference in Orlando. We look forward to keeping you posted on new trends, opportunities, and ways we are generating alpha for our clients.

Dark forex chart backdrop with candlestick graph.

On July 8, 2021, our commentary addressed inflation and the debate about whether it was transitory or secular. At the time, the consensus of Central Bankers and most economists, was that it was transitory.

In this week’s commentary, we predict that a 2% inflation goal in the U.S. is not achievable for many years to come. The new long-term inflation rate will be more around 3%, and possibly higher. How central banks will adjust their policy to this new reality remains to be seen.

Inflation targeting: a history

Since 1996, the United States (U.S.) Fed has used monetary policy with the aim of keeping inflation at 2%. In 2012, Ben Bernanke, then chair of the Fed, made it explicit. Japan, Sweden, the European Central Bank (ECB), Canada, the Bank of England and many others have all since been using this 2% target. 

Why 2%?

In the inflationary period of the late 70s and early 80s, inflation was high and central banks around the world tried to ensure stable prices using different methods (currency rates, growth of money supply, interest rates) all with the goal to bring down inflation, above 10% at the time. When inflation finally started to come down, inflation targeting became the norm, first specified by New Zealand in 1988. That meant normal interest rates would be around 4 to 5% and would be cut to no less than 2% in a recession to have the desired effect to boost the economy.

Unfortunately, central bankers did not respect their framework and cut rates to zero. This unleashed the inflation we are seeing today.

To justify their move to zero, Fed Chair Jerome Powell made a significant change to the 2% framework on August 27, 2020. The statement replaced the 2% commitment by a 2% average over time. They also added a goal of maximum employment.

What happened since and what will happen in the next few years will be material for future economic theses.

Here is an update of different prices since last summer. Remember, prices were supposed to go down in 2022.[1]

Price of (in U.S.$)June 28,
2019
June 30,
2020
June 30,
2021
April 8,
2022
% increase
over 2019
Oil (Bbl)58.4739.2773.9096.2365%
Natural gas (Mcf)2.311.753.656.39276%
Gasoline (gallon)1.771.262.263.0572%
Corn (Bushel)41437358576585%
Pork (lb)0.870.751.040.9914%
CRB food index34829048856863%
Copper (MT)5993601593351031272%
Aluminium (MT)182016202552338586%
Lumber (MBF)379436718893235%
CRB index40836055763355%
Baltic freight sea shipping1381179934182778201%

Although major equity and bond markets have had a difficult start of the year in 2022, here is the performance of benchmarks since June 28, 2019.1

IndicesPerformance between June 28, 2019 and April 8, 2022
(in U.S.$)
S&P50059.5%
Nasdaq77.8%
MSCI World46.3%
MSCI emerging markets14.2%
MSCI global small cap34.5%
Bloomberg U.S. Aggregate Bond Index0.42%

Looking at the above returns would signal that bond and emerging market investors, who both have a deeper perspective on the risks of inflation, have a gloomier assessment of long-term inflation risks.

But let us come back to our 3% long-term inflation rate. Why will future inflation be higher than what we experienced in the last 30 or so years?

The consumer price index (CPI), which is the main measure of inflation, is organized into dozens of categories; the most important are:

  • Shelter (32.4%)
  • Food (14%)
  • Transportation (14%, excluding motor fuel)
  • Energy (7.5%)
  • Medical care services (7%)
  • Education and communication services (6%)

Another measure of inflation is wage growth. In the last year, wages were up 5.7%, below inflation at 7.3%. We argue that, going forward, wage growth will be above 3%, not dissimilar to the wage-price spiral of the 70s, whether it is deglobalization and reshoring, the millennials entering the work force, baby-boomers retiring, and wages going up.

Source: Bureau of Economic Analysis and Bureau of Labor Statistics.

We can see from the CPI categories that shelter is the largest component. With the rise in home prices, rents have not been far behind. 

National real estate brokerage Redfin showed January’s average asking rents for housing went up 15.2% from last year. There is a lag between when rent increases occur and when they show up in the index, which is typically 18 months. This means that shelter inflation will be much higher in the months ahead.

The second largest component is food. Typically more volatile, and excluded from the core CPI number, we believe that food prices will be higher in the future than they were in the past. From the decline in arable land, to more extreme weather events, to rising input costs, we can expect higher food prices. The last spike in 2011 brought extreme unrest around the World (Arab Spring).

Costly Food

Source: Food and Agriculture Organization of the United Nations

What do we think today? How do we position one’s portfolio? How will equity markets react to these higher inflation numbers and higher interest rates?

Past episodes have shown that long-duration assets, such as long-term bonds and high growth stocks, will be most affected.

U.S. large cap, particularly technology companies, are selling at important premiums to other markets. They will be most vulnerable.

Japan and Europe do not have the same inflation pressures. So inflation there may be more contained. Smaller companies have generally outperformed in periods of inflation.

From January 1979 to July 1983, the Russell 2000 outperformed the S&P 500 by 77%. During this time, inflation rose to as high as 13% and the economy suffered a double-dip recession in 1980 and 1981-82, before staging an extremely strong recovery in 1983 with growth rates as high as 8.5%.

Our portfolio is well positioned for a strong recovery, accompanied by higher inflation.


[1] Bloomberg

Assemblee Nationale (Palais Bourbon) - the French Parliament, Paris

On April 10, people in France will go to the polling booths for the first round of national voting. Assuming there is no majority, the two candidates with the most votes will proceed to a run-off two weeks later with the winner being declared President.

According to opinion polls, incumbent President Emmanuel Macron favored to win the upcoming election and be re-elected. Macron’s had a bit of a rollercoaster over this term, pushing through some reforms, such as facilitating the process for companies to fire workers, cutting corporate taxes and introducing new security laws to tackle terrorism. On the other hand, a proposed fuel tax in 2018 was abandoned after protests by the “gilets jaunes”, and the Covid-19 pandemic hampered a pledge to reduce the unemployment rate to 7% by 2022. Russia’s invasion of Ukraine has increased Macron’s popularity, placing him in a prominent role as a liaison to Vladimir Putin and boosting his image as a statesman who represents France well internationally – one of his key strengths compared to his rivals. 

Marine Le Pen, who was runner-up in the last election, has once again emerged as the closest rival in the first round. While the family name is associated with the far-right in France, Le Pen is no longer considered the extreme right vote with the emergence of Eric Zemmour. This will dilute her votes somewhat. Le Pen continues to campaign on a consistent anti-immigration message, proposing a referendum on restricting immigration. Once an admirer of Russia’s Putin, Le Pen has condemned the invasion of Ukraine. 

Of the other prominent candidates, the far left is represented by Jean-Luc Mélenchon. He is a staunch critic of Macron and has some opposing views, such as lowering the retirement age by two years to 60 and promising a big rise in the minimum wage. His support has declined over the past month due to a more lenient stance on President Putin and a desire to leave NATO. Valérie Pécresse, a centre-right candidate, was once seen as the strongest opposition to Macron but has fallen away as the campaign advanced. On the far-right, and eating into Le Pen’s votes, is Éric Zemmour. His campaign is built on a more hard-line nationalism than Le Pen, having previously blamed his perceived decline of France on immigration and Islam. His popularity has declined as he unveiled some severe proposals, such as deporting 100,000 immigrants each year, particularly those from North Africa.

If we look at Macron and Le Pen as the two most likely to advance to the second round, the largest differences are in immigration rather than economic policy. However, pension reform is one area where they disagree. Macron wants to increase the retirement age, while Le Pen opposes. Macron may get the benefit of the doubt here as some of his reforms are starting to bear fruit, and the potential growth of France is now above Germany’s.

France has also fared relatively well during Covid and the recovery, with the country’s real GDP above that of the larger Eurozone. One of the reasons for the outperformance, especially against Germany, is the lower exposure to manufacturing and the impact of a challenging supply chain dampening German growth. The French economy should also be less impacted by the Russia/Ukraine war as it relies more on nuclear power compared to Germany’s dependence on gas and, in particular, Russian imports.

One area where Macron and Le Pen (and most of the leading candidates) are in agreement is the expansion of nuclear power. The percentage of energy derived from nuclear is already significantly higher in France than elsewhere in Europe, and the direction being taken until recent events was to reduce this. However, Macron is considering building eight more nuclear reactors in addition to the six announced recently. Another point in common is an increase in military spending. Public spending will come under some scrutiny, as French public debt has risen well above 100% of the GDP. There are potential savings from further reductions in public employment and raising the retirement age, both of which Le Pen opposes.

Macron has implemented some measures to mitigate surging energy prices, but increasing purchasing power for households will be a hot topic. Macron wants to raise the threshold for bonuses paid to low-paid workers to be tax-free, while Le Pen prefers to slash social security contributions and increase financial aid for families.

In June, once the presidential situation is resolved, French voters return to the polls to elect a new parliament, which means a new prime minister. The prime minister is appointed by the president but has to reflect the majority in parliament, so the key question is: will the president and the majority of members in parliament come from the same party? If so, it is easier for the president to execute their policy agenda more easily. If not, a situation called cohabitation comes into effect, limiting the ability of the president to implement their agenda. Cohabitation has happened three times.

While there has been no consistent market reaction over recent election outcomes, one would think that given the recent relative outperformance of the French economy, some stability would be welcome from investors. Global Alpha currently has three French holdings in our International and Global strategies. 

Rothschild (ROTH.FP)

Rothschild is one of the world’s largest independent financial advisory groups. The company is a global leader in M&A advisory, especially in Europe, but is strategically diversifying by building wealth management and merchant banking franchises to give more recurring earnings. Some companies don’t have the internal expertise when considering M&A strategy or some form of restructuring so they reach out to Rothschild, who give an independent opinion, which is an important differentiating factor. Rothschild helps clients choose how best to approach a potential sale/ issuance/ restructuring, and may help them to select other banks (that have more developed equity and debt capital markets capabilities) to handle the transaction mechanics. The wealth and asset management franchise is mostly a European business, focusing on high net worth individuals (>€1 million in France and >€5 million elsewhere). The merchant banking franchise is present in both; Europe and the United States (U.S.), focusing on private equity and private debt with a specialization in health care and technology.

Sopra Steria (SOP.FP)

Sopra Steria is a leading European IT services company offering consulting, digital services and software development. The company aims to help its clients in their digital transformation journey by speeding up changes in client business models, internal processes and information systems. In 2021, spending on digital services reached $318 billion, with the market expected to grow over 5% through 2025. Most of Sopra’s revenues come from consulting and systems integration. The government and public sector account for the largest share of revenues at 26%.

Lisi (FII.FP)

Lisi is an industrial company specializing in the manufacture of components for the aerospace, automotive and medical sectors. For aerospace, which accounts for 48% of group revenues, Lisi manufactures fasteners, assembly and structural components for the largest players in the sector. The division has been deeply affected by the pandemic but appears to be entering a new growth cycle as the production of single aircraft, in particular, seems to be ramping up. For automotive, Lisi provides metallic and plastic assembly solutions and safety-mechanical components for global OEMs and Tier 1 suppliers. The division has recovered well from the 2020 lows but continues to be challenged by supply chain constraints. For medical, Lisi manufactures implants and other instruments. Minimally invasive surgery that was delayed during the pandemic is resuming in hospitals.

At the time of writing, the most recent opinion polls have seen the gap between Macron and Le Pen narrow. Some of them even to within the margin of error. This has seen French equities underperform as the risk of a Le Pen victory increases. So if Macron does succeed in being re-elected, as the polls still suggest he would win in a second round against Le Pen, we could see a small catch-up rally in French equities.

The monetary indicators followed here continue to give a negative signal for the global economy and risk assets. The indicators have been depressed by an inflation squeeze on real money balances and this drag is probably peaking. Any relief, however, may be offset by a further slowdown in nominal money growth due to over-aggressive withdrawal of stimulus by belatedly hawkish central banks.

Global equities relinquished all of their Q4 gain in early 2022 and fell to new lows following Russia’s invasion of Ukraine. As is often the case with responses to “news”, the latter move was subsequently reversed fully, with markets recovering strongly into late March. The monetary backdrop is not conducive to an extension of this rally.

Two measures of global “excess” money are tracked here – the differential between six-month growth rates of real narrow money and industrial output and the deviation of 12-month real money growth from a slow moving average. A previous post in this series at the start of the year noted that the second measure had turned negative and the first was likely to follow (confirmed in January). Historically, global equities underperformed cash on average when either measure was negative, with the weakest returns under “double-negative” regimes.

Could the measures return to positive territory soon? Chart 1 shows the components of the first gauge. The low level of global six-month real narrow money growth mainly reflects current high consumer price momentum – nominal money growth is only slightly below its 2010-19 average. CPI momentum may be peaking with commodity prices but the relationship in chart 2 suggests no significant relief until H2.

Chart 1

Chart 1 showing G7 + E7 Industrial Output & Real Narrow Money (% 6m)

Chart 2

Chart 2 showing G7 + E7 Consumer Prices & Commodity Prices (% 6m)

The negative gap between real money and industrial output growth also reflects a recent rebound in the latter as production constraints have eased and firms have rebuilt inventories. This will likely reverse – the real money slowdown suggests economic weakness and the stockbuilding cycle is scheduled to turn down. Again, however, a sufficient fall in output momentum may be delayed until H2.

The second excess money measure – the deviation of 12-month real narrow money growth from a moving average – is likely to remain negative for longer than the first, with 12-month inflation relief delayed until late 2022.

Chart 3

Chart 3 showing G7 + E7 Real Narrow Money (% yoy) & Slow Moving Average

Both measures, moreover, could be depressed by a further slowdown in nominal money growth in response to recent and prospective central bank tightening – chart 4.

Chart 4

Chart 4 showing G7 Broad Money (% yoy) & G4 Central Bank Securities Purchases ($ trn, 12m sum)

As well as performing poorly on average, equity markets have historically displayed distinct sector and style trends under double-negative excess money signals. Specifically, tech and other cyclical sectors (as defined by MSCI) underperformed on average, while energy and other defensive sectors outperformed. This pattern was evident during Q1.

Style-wise, high dividend yield and quality have outperformed on average under double-negative signals. The shift to an unfavourable environment has also often been associated with a set-back for momentum. So far, yield has outperformed but quality has lagged. This may reflect higher-than-usual exposure to tech and momentum in the quality basket, as well as the negative correlation of the style with long-term bond yields.

The Q1 surge in yields had not been expected here and occurred mostly after Russia’s invasion of Ukraine – the 30-year Treasury yield had remained below its March 2021 peak until the shock. The key drivers appear to have been stronger commodity prices – and an associated rise in inflation expectations – and a surprisingly aggressive hawkish policy shift by the Fed, mirrored to a lesser degree by other central banks.

The expected downswing in the stockbuilding cycle will weaken demand for commodities, offsetting the Russia / Ukraine supply shock and probably allowing price momentum to slow, if not turn negative. Central banks, meanwhile, usually abandon policy tightening plans as the downswing unfolds. The rise in Treasury yields, therefore, is judged unlikely to extend and may reverse, in turn suggesting that quality will resume its usual defensive status in negative monetary environments.

Medium-term interest rate prospects, of course, hinge on the issue of whether current inflation will prove “transitory”. “Monetarist” economists warned that the 2020 surge in global nominal money growth would feed through to a major inflation pick-up in 2021-22. Current money trends, however, are reassuring: G7 annual broad money growth has fallen significantly and the rate of increase in the latest three months was close to the pre-covid average – chart 5.

Chart 5

Chart 5 showing G7 Broad Money

Will money growth rebound? It seems unlikely unless central banks completely abandon tightening plans and revert to zero rates and quantitative easing (QE). If quantitative tightening (QT) goes ahead, maintenance of even the recent slower pace of money growth will require solid expansion of bank lending. G7 monthly loan growth picked up into late 2021 but this is judged partly to reflect temporary inventory financing. Central bank lending surveys suggest moderate demand and were conducted before recent yield rises.

Regional / country money trends suggest particularly weak economic prospects in the Eurozone and UK, where six-month changes in real narrow money are negative – chart 6. The US could follow in March as CPI momentum rises further. Relative strength in Japan / China is due to a smaller inflation drag. Australia is a rare case of money trends still giving a positive economic signal.

Chart 6

Chart 6 showing Real Narrow Money (% 6m)

A revival in Chinese real money growth from mid-2021 was, as expected, reflected in stronger activity data in early 2022. The economic recovery, however, has been stalled by renewed covid outbreaks and exports are at risk from global weakness. The hope here was that policy easing would lead to a more significant pick-up in nominal money growth by now. A reversal of food price weakness, meanwhile, suggests a rising inflation drag on real money growth.

A harbor in Japan with colorful containers

Mobility is essential to our daily life and economic growth, yet moving people or goods from place to place has a great impact on the environment. In the United States (U.S.), the transportation sector is the largest emitter of greenhouse gas (GHG), accounting for 27% of total emissions in 2020, with the largest contributors being passenger vehicles (41%), followed by freight trucks (26%), and light-duty trucks (17%).

Globally, the transportation sector accounts for around a quarter of CO2 emissions, with road transportation, including cars, trucks, buses and motorbikes alone accounting for nearly 18%.[1] From 1990 to 2019, emissions increased by 20.9%. Although emissions declined 13.7% from 2019 to 2020 due to less travel caused by the COVID-19 pandemic,[2] it has rebounded almost to 2019 levels in 2021.

Transport demand is expected to continue to grow across the world in the coming decades as the global population grows and travel demand increases. In the Energy Technology Perspective report[3], the International Energy Agency (IEA) predicts that global transport demand will double, car ownership rates will increase by 60%, and demand for passenger and freight aviation will triple by 2070. This is expected to result in a significant increase in transport emissions. To achieve carbon neutrality by 2050[4], technological innovations are needed to offset this rise in carbon footprint.

Road freight contributes about a quarter of the transportation sector emissions, and heavy-duty trucks emit 20 times the amount of emissions in comparison to passenger cars. Companies are tackling the problem by modifying their fleet of vehicles. Renewable Natural Gas (RNG) is currently one of the most economical and impactful ways to achieve this objective. It is the only available renewable energy source that is carbon negative. GHG emissions from the production and use of RNG are 90% less than diesel.  

Clean Energy Fuel (CLNE US)

Clean Energy Fuel, a holding in our portfolios, is a leading renewable energy company focused on the procurement and distribution of RNG and conventional natural gas. Of its natural gas sold, 74% is from renewable sources. The company has been in the alternative vehicle fuels industry for over 20 years and is the largest U.S. provider of RNG for commercial transportation. Sales of its RNG has increased from 13 million gasoline gallon equivalents in 2013 to 153 million in 2020. In 2020, the company provided fuels to over 4,000 heavy-duty trucks in the U.S. and provided 45% of the RNG used for transportation fuel in the country. The importance of RNG is being recognized by big players in the energy and logistics industries, and Clean Energy Fuel has secured multiple partnerships, including with Amazon.

Hexagon Composites (HEX NO)

Another holding in our  portfolio, Hexagon Composites is a global leading provider of natural (renewable) gas vehicle fuel systems and gas transport modules, with an 80% market share in North America and 50% market share in Europe. The company also owns 75% of Hexagon Purus (HPUR NO), a world-leading provider of Type 4 high-pressure hydrogen cylinders, battery packs and drivetrains for fuel cell electric and battery electric vehicles. In 2020, Hexagon’s solutions avoided the release of 730,000 metric tons of CO2 equivalent. To put that in perspective, it equates to removing 158,000 petroleum cars from the road for a year or planting 960,000 acres of forest.[5]

Passenger vehicles account for over 40% of emissions in the transportation sector, so it’s no wonder the automotive industry has been under pressure from governments and societies to pursue more sustainable growth. Electric vehicles (EV) have emerged as a key area to boost the sustainability efforts of automakers. Volkswagen targets half of its sales to be electric by 2030. Ford aims for 40%-50% of its sales to be electric by the end of the decade. The EV market has been growing rapidly, though from a small base. In 2019, 2.2 million electric cars were sold, representing 2.5% of global car sales. In 2020, electric car sales rose to 3 million, representing 4.1% of total car sales. In 2021, electric car sales more than doubled to 6.6 million, close to 9% of the global car market.[6]

Except for electrification, many other solutions help reduce the emissions of the automotive industry.

Motorcar Part of America (MPAA US)

Motorcar Part of America, a holding in our portfolios, remanufactures and distributes aftermarket automotive parts by reusing and reconditioning previously used core units that would otherwise end up recycled or disposed. With the potential to cut material and energy consumption by up to 95%, remanufacturing is the most efficient and sustainable process for producing aftermarket replacement parts. MPAA sells over 36,000 stock-keeping units (SKUs) in over 25,000 retail outlets in the U.S. and Canada. The current population of light-duty vehicles in the U.S. is approximately 281 million. The average age of these vehicles is around 12 years and is expected to continue to grow, in particular during recession years. The aged vehicle population provides favourable opportunities for MPAA.

Although the sustainability focus is primarily on fuel and exterior components, the interior cannot be neglected either.

Seiren (3569 JP)

Seiren, another holding in our portfolios, manufactures advanced materials mainly for automotive, electronics, high fashion, building and medical industries. It is the global leader of car seat materials, with a 17% market share. Synthetic leather car seat materials have been taking market share from genuine leather, as consumers and carmakers favour cruelty-free materials. Seiren’s superior synthetic leather product, Quole, feels like leather, but is only one-third or half the price of genuine leather; it is also 50% lighter, reducing the weight of a car by around 2kg. Production of the materials cuts CO2 emission by two-thirds, and the material is four times more durable than genuine leather. Thus, it has been increasingly adopted by automakers, especially electric car manufacturers.

At Global Alpha, meeting companies and on the ground research are important parts of our investment process. Being conscious of the environmental impact, we have started offsetting our own carbon footprint from corporate travels since late last year. We will provide more details in future updates.


[1] https://www.bbc.com/future/article/20200317-climate-change-cut-carbon-emissions-from-your-commute

[2] Inventory of U.S. Greenhouse Gas Emissions and Sinks: 1990-2020

[3] Energy Technology Perspective 2020, IEA

[4] https://www.un.org/sg/en/content/sg/articles/2020-12-11/carbon-neutrality-2050-the-world’s-most-urgent-mission

[5] Hexagon Composites Annual Report 2020

[6]https://www.iea.org/commentaries/electric-cars-fend-off-supply-challenges-to-more-than-double-global-sales?utm_source=SendGrid&utm_medium=Email&utm_campaign=IEA+newsletters

Futuristic earth map technology abstract background

The most recent Intergovernmental Panel on Climate Change (IPCC) report outlines the stark reality in which significant resource preservation, namely land and sea, is needed to protect our species and biodiversity.

It is estimated that up to 3 billion people worldwide could face water scarcity as a result of global warming. Demand for water will exceed supply in 30% of the world by 2050 if no action is taken. Already, half of the world is presently faced with water scarcity for at least one month out of the year. Issues facing communities include poor access to water, which may be a result of a lack of freshwater sources or the lack of infrastructure due to economic conditions. Another key variable to consider is water quality. With increased industrial and human activity, water quality has been deteriorating in many parts of the world. This can be seen through effects such as ocean acidification, increasing temperatures, and increased run-off of pollutants. Hence, the importance of monitoring water quality. Regular monitoring allows for the early identification of problems and changes in quality over time.

Access to clean, running water is critical to support the health, well-being and livelihoods of societies. Most recently, discussions have been focused on land preservation and restoration to halt devastating deforestation practices happening all over the world. However, water is central to so many day-to-day activities, such as agriculture, energy production and overall economic productivity. Everyone has a common interest in responding to this problem. In fact, the water-related risk is one of the more prevailing issues in The Sustainability Accounting Standards Board (SASB) Materiality Framework, making an appearance in 25 out of the 77 industry groups.

There are ways to mitigate water scarcity and improve water quality. One of the most impactful ways that can contribute to water conservation is through changing personal habits, particularly with respect to food consumption. Some of the industries which consume the most water include fruit and vegetable farming (wheat, corn, rice, and sugarcane rank highest), garment and textile production, meat production and the beverage industry. So, by making small changes in daily consumption habits, such as reducing grain and red meat intake, it can all add up to water savings.

On the industry side, there are many possible solutions. For instance, relying on wastewater recycling, reuse, and reclamation allows corporations to return fresh and clean water for use in either a closed or open loop system. Changing current distribution systems and updating existing infrastructure would help with quick detection and more efficient use of resources. On many occasions, it is a leak that can create contamination within the water supply,  therefore monitoring changes in water dynamics would help to promptly contain the problem. Continuing to improve filtration systems will play an important role, especially in developing nations. Making water safe to drink could increase the overall water supply and reduce the amount of scarcity. More specifically, for the agricultural sector, where 70% of the world’s freshwater resources go to farming and irrigation. Technological developments are particularly in need in this sector, and solutions such as sustainable agriculture and vertical farming can help reduce the amount of water needed for food production.

Water has rarely been a trendy investment theme, especially given the current spotlight on the energy transition sectors. The lack of metrics surrounding water has made it difficult to incorporate, let alone measure, risk and opportunity within this sector. Global Alpha currently has exposure to two companies involved in water management, which provide solutions to the aforementioned problems.

Daiseki

Daiseki is the largest Japanese processor of liquid industrial waste. The company is currently the number one player in Japan, holding about 10% of the market share. In 2018, they released their Vision 2030 plans, which included an ambitious goal of becoming the number one recycling company in Asia and making a positive impact on the United Nations’ Sustainable Development Goals. Recently, an increasing amount of customers are relying on Daiseki to treat their wastewater, with demand mainly driven by carbon neutrality and circularity goals. Their wastewater processing involves separating the water from the contaminants, at which point the water is treated and released back into the river or the local sewage system. Due to growing interest in water treatment services, the company has plans to expand its water treatment capacity at their Kansai Facility. We not only see this as a positive for the company’s bottom line, but also in terms of contribution to the Sustainable Development Goals.

Primo Water

Primo Water distributes bottled water and filtration solutions to customers all over the U.S. and Europe. They are also the leading provider of self-service refill drinking water and water dispensers in Canada and the U.S. The company is focused on giving access to high-quality, purified water to its customers. Having clean and reliable water is of great importance to their customers, and Primo is able to cater to their needs with its numerous distributions solutions.  Environmental stewardship is one of the company’s key pillars; in fact, they are committed to ensuring that their water is sourced responsibly. This is demonstrated through their commitment to receiving certification from the Alliance for Water Stewardship (AWS) for all their key spring sources by 2025. Some of the objectives of the AWS are to promote better water governance, ensure good water quality and provide access to water, sanitation and hygiene for all.

As more opportunities become available in this specific sector, we will continue to evaluate attractive companies that positively contribute to tackling this issue.

Close up of a male's hand paying bill with credit card contactless payment on smartphone in a cafe, scanning on a card machine.

When you think about banking in emerging markets, it may conjure images of long lines outside banks under the tropical sun. Surprisingly, it has been a rather short road from the long lines of yesterday to the super apps of today. For example, it’s not uncommon now to see street side hawkers in China and India accepting payments via apps as deftly as they handle their cast iron woks. Unburdened by the shackles of high cost legacy financial infrastructure, emerging markets have been faster, leaner, and more efficient in building the new age pipes that move money from point A to B.

There are three key reasons for this lightning pace of technology adoption.

  • Firstly, in the absence of a traditional brick and mortar banking network, the pace of adoption has been exponential. EM consumers have leapfrogged credit cards and traditional bank-to-bank payments to mobile-based transactions.
  • Secondly, emerging markets themselves have been open to collaborating with each other when it comes to sharing infrastructure and regulatory best practices via fintech bridges that connect fintech hubs like Dubai, Nairobi, and Singapore.
  • Finally, emerging markets offer the size and scale of the population required to encourage fintech startups to innovate and roll out new products.

The result of this fintech innovation and rapid penetration of mobile internet has been the rise of digital payment platforms, such as Paytm in India, GoPay in Indonesia, and M-Pesa in Kenya. Similarly, we have seen the rise of digital banks, like WeBank in China, Next Bank in Taiwan, and Kakao Bank in South Korea. Another differentiating factor in emerging markets has been the proactive intervention of governments in building the infrastructure that makes payments low cost and frictionless. In Brazil for example, there is PIX, an instant payment and open banking infrastructure. In India, we have the Unified Payments Interface (UPI), which is a real time, identity-based payment infrastructure.

A great result of this blistering adoption of fintech is the tradition of gifting red packets or envelopes called “Hongbaos” during the Chinese New Year as a blessing of good luck.According to WeChat, in 2019, a staggering 820 million digital Hongbaos were exchanged during the New Year. At Global Alpha, we are both excited by and aware of the disruption that is being caused by fintech to traditional financial incumbents in banking, payment processing, insurance, and investments.

In identifying investment opportunities, it is particularly relevant for us to understand how traditional banking incumbents are adapting to competition in digital banking.3 Let us take emerging markets in the Asia Pacific as an example where the share of consumers using digital banking has risen from 54% in 2017 to 88% in 2021 according to a McKinsey report. That’s a growth of 1.4x over 5 years.

Similarly, while over 70% of consumers in these countries are interested in using digital channels to access banking services, only 20-30% of them have actually made a purchase via these channels. This is a huge untapped opportunity for traditional banks to reach consumers in the comfort of their homes while offering them their full suite of products and services.

In this rapidly shifting landscape, we evaluate how traditional banks are shifting to an omnichannel approach by leveraging digital channels for everything from transactions, customer acquisition and retention, and cross-selling to improve the productivity of existing branch infrastructure. On the other end of the spectrum, we also look at new digital-only banks and how they are leveraging technology to offer a different value proposition to consumers.

We ask the following questions while evaluating opportunities in this space:

  • Do they have a unique proposition to make banking services more accessible and affordable? It’s not just about a sleeker interface and new branding. The rubber meets the road in seamless onboarding, friction-free purchasing experiences and high-quality customer service.
  • Do they offer the full suite of products and services that traditional banks offer?
  • Are they catering to underserved segments ignored by big banks? These segments offer the critical mass necessary for quick scalability.
  • Do they have experienced leadership with a plan towards a clear path to profitability? An experienced team knows how to leverage data for accurate targeting and product pricing while still deploying a robust risk management framework.

Banco Regional (RA MM)

One of our holdings that is looking to leverage opportunities in this space is Banco Regional in Mexico. Banco Regional focuses on banking for the small and medium enterprises (SME) segment. Banco Regional made a successful foray into the consumer segment by targeting the high net worth segment and more recently, it has decided to target the mid/low-end consumer with a fully digital offering called Hey Bank. With over 500 programmers on their payroll, Hey Bank has built an offering that is easy to use and full of convenient functionalities. Their mobile app allows customers to open an account in just five minutes. We like the fact that Hey Bank pursues profitable clients and is expected to break even by 2022. At Global Alpha, we continue to look for opportunities at the intersection of finance and technology that tap into the growing financialization of emerging economies.

The ECB under former President Jean-Claude Trichet twice raised interest rates into oncoming recessions (in 2008 and 2011). The current ECB hasn’t raised rates yet but is scaling back QE much faster than was expected late last year.

The six-month rate of change of Eurozone real narrow money had turned negative before the 2008 / 2011 rate rises and subsequent recessions. It is about to do so again now.

In an eerie replay, M. Trichet yesterday gave an interview in which he opined that the Eurozone was “far from recession territory”.

The current ECB seems equally complacent. The staff forecast for GDP growth in 2022 was yesterday lowered from 4.2% to 3.7% but still incorporates quarterly increases of 1.0% in Q2 and Q3, i.e. a combined 2.0% or 4% annualised.

The “best” monetary leading indicator of Eurozone GDP, according to the ECB’s own research, is real non-financial M1, i.e. holdings of currency and overnight deposits by households and non-financial corporations deflated by consumer prices.

The six-month change in real non-financial M1 fell to zero in January and is likely to have been negative in February, based on a further increase in six-month consumer price momentum – see chart 1.

Chart 1

Chart showing Eurozone Narrow Money & Consumer Prices.

The six-month real narrow money change was negative in 18% of months between 1970 and 2019. The average change in GDP in the subsequent two quarters combined was zero. The average since the inception of the euro in 1999 was -0.8%.

Business surveys could be about to crater: the March Sentix survey of financial analysts is ominous – chart 2. The ECB and consensus may portray weakness as a temporary response to Russia’s invasion of Ukraine, drawing a parallel with past geopolitical events that had little lasting economic impact. Monetary trends suggest that a slowdown to stall speed was already in prospect and the Ukraine shock may tip the economy over into recession.

Chart 2

Chart showing Germany Ifo & Sentix / ZEW Surveys.

The ECB is in a policy bind of its own making. The view here is that it is too late to tighten and the only option is to ride out the current inflation storm. The worry for policy-makers is that inflation expectations will become “unanchored”. Fake hawkish rhetoric backed by fantasy GDP forecasts may be their attempted escape route.

Shanghai skyscrapers

The Chinese economy has undergone major changes over the past year, aimed at stabilizing the long-term sustainability of its economy. We discussed many of these changes in our commentary, Navigating through current China uncertainties (and opportunities). Looking ahead, we will continue to carefully analyze the movement of Beijing’s policies, which provide key insights into the economy and financial markets this year.

Based on our analysis and interactions with companies, we anticipate a better second half of the year, and history has shown us similar behavior.

Regarding the property sector, in the first two months of 2022, sales in the top 30 cities declined 29% year-over-year (YoY), making it the second worst year since the start of the decade. Sales for 200 developers in lower tier cities dropped 43% YoY.[1] Falling property prices are often an indicator of a drop in land values, which directly affects local governments, as it is an important source of revenue. 

If we recall the last property down cycles in 2011-12 and 2014-15, they lasted around 9 months. As the current down cycle started in September-October, best case scenario would be improvements starting in the second half of 2022. During the first half, most indicators will continue to look very bad, and developers may face problems.

What can the government do then to improve sentiment?

Real estate and credit growth have always been key metrics for GDP expansion in China. Further, previous down cycles could guide government action. For example, the government could turn to a more easing mode, similar to actions taken in 2012 and 2015. As a result, we could see growth of new housing starts to bottom. That said, we don’t expect a massive easing in the property market, unless situation spreads very widely.

In the second half of 2012, Chinese policy makers released a set of stimulus measures. While each of these measures differ, it is similar to what’s been happening in 2022. In 2012 policy makers were reluctant to loosen measures and reiterated the idle land policy: a 20% penalty if idled for one year and forfeiture if idled for two years. The policy makers wanted to test the market and see results with gradual easing.

In March of 2015, minimum down payment was reduced to from 60% to 40% for second time home buyers who have still not paid the first mortgage. For first time buyers the down payment was reduced from 30% to 20%. State Council meeting was held on Dec 14th and analyzed the urban planning for 2016. Key focus was to reduce real estate inventory deepening urbanization.

 In 2022, we think policy makers have the tools to do similar easing, although, considering last year’s common prosperity, the willingness to do so is likely a little more difficult.

Many cities are easing mortgage lending (e.g., Guangzhou), lowering down payment rates (e.g., Heze, a third-tier city in Shandong province), or relaxing home purchase restrictions (e.g., Zhengzhou). China will also make it easier for state-owned enterprises (SoE) to buy distressed assets for private peers in order to avoid a credit crunch in the sector. For example, SoEs acquiring distressed assets will not be majorly subject to the three red lines policies. Likewise, some developers are being allowed to issue bonds in onshore markets.

The last Politburo meeting in December had a clear message: policy makers would shift from regulatory tightening to supporting growth. We believe China will defend around 5.5% growth (announced last week in NPC meeting) and considering mounting growth pressures, the current property tightening mode should shift to a gradual easing, similar to 2012 and 2015. Top leaders have declared their intention to double the Chinese economy from 2020 to 2035, which implies a minimum 4.7% CAGR growth.

The main pillar of this relaxation cycle was understanding the change of policy makers from December 2020 (regulatory tightening) to 2021 (stability). What policy makers state at the beginning of the year is the most important message for understanding further actions. The latter meant that most probably regulation in many sectors has peaked. Chinese policy makers are extremely careful in making the best they can in order to fulfil their guidelines.

Together with property initial reactions, credit impulse is has also seemed bottoming up.  In January, credit figures came in better than expected. Total Social Financing was RMB 6.2 trillion (consensus 5.4 trillion) and credit growth expanded from 10.3% YoY) to 10.5% YoY.[2] This is part of the initiation of a more deep easing cycle.

Is it time to leverage the economy again?

It could be, if you consider the messages out of the yearly Politburo meetings. In 2019 it was all about deleveraging. Why? Because GDP growth was not an issue. In 2022, stability is the main concern, which implies that GDP growth is a target. Government bond issuance and short term corporate lending have picked up substantially (especially the latter) in January. 

In addition, on January 20th, China lowered its benchmark loan rate, or Loan Prime Rate (LPR), from 3.8% to 3.7%. Meanwhile, the 5-year LPR was also lowered by 5bps to 4.6% in December (a small move but this rate is linked to the property sector). On Monday of the same week the one year Medium Lending Facility (MLF) rate was lowered 10 bps. Again, not a relevant move but the importance was the signal considering it was the first move since April 2020. The MLF cutting cycle is also the 5th decrease since the global financing crisis. China will also enter in a divergence driven by its easing and the tightening on the FED. The latter could make some pressure over the Yuan over time which can eventually anticipate some further easing measures.

Another factor that can boost China’s economy this year is Infrastructure investment, which could accelerate in 2022, considering fiscal policy has ample room to turn from contraction to expansion. Fiscal deficit was solely 4.5% of GDP (vs 6.5% expected at the beginning of the year) rolling over more than 3 trillion for 2022 spending, although policymakers should lose the controls on local government debt.

Regarding consumption, the disposable income from Chinese families has been affected by current economy slowdown, however the greatest negative impact from consumption is Zero Covid policy. As long as this measure doesn’t change it will be very difficult for consumption metrics to improve. History has shown us that consumption growth has been quite stable in the past, with low volatility. This implies that any change in Zero Covid, can bump consumption in a great extent. Most likely it will be gradually changed to more targeted measures (not locking down entire cities), nevertheless we don’t expect the complete elimination of the policy until at least the National Congress of the Chinese Communist Party this fall.

China’s top scientist Zeng Guang recently declared that China and Covid could coexist.[3] This is an important signal for an eventual turning point of Beijing to open the door to more discussions in following periods.

Despite the sluggish current economy we are overweight in China our emerging markets (EM) Small Cap Portfolio. Our approach is to invest in companies/sectors that are subject to less regulation and more likely to benefit from the new trends that we see emerging in the future.

Zhou Hei Ya (1458 HK)

We have recently initiated a position in Zhou Hei Ya (ZHY) in our Global Alpha Emerging Markets Small Cap Strategy. Our global and international small cap strategy do not invest in this country. ZHY is a leading braised food company in China and their main products include packaged duck products, such as duck necks and wings.

The brand is originally from Wuhan and is particularly strong among many cities in the country. ZHY is the first company in China to introduce MAP, which makes it possible to store braised food for up to seven days in a chilled environment. In the past, braised food products had to be unpackaged and consumed within the same day, hence it could only serve dining demand. MAP technology makes it much easier for people to consume braised foods on a variety of occasions.

China’s casual braised food industry reached a market size of RMB 109 billion in retail sales as of 2020, growing at a 16% CAGR over 2015-20. According to Frost & Sullivan they should continue increasing at similar pace, reaching RMB 205 billion in 2025. The main reasons for this increase are: increasing repurchases, a recovery in traffic post Covid-19, growing all-day snacking demand, and a convergence of consumer behavior in low-tier cities vs. top-tier cities.

ZHY has a highly standardized and scalable operating model. In 2019 it installed a franchisee model that will very likely speed up growth. ZHY has superior store unit economics (self-operating and franchisee stores take two to three months to breakeven), distinctive brand positioning, high stickiness, and are popular among the younger population It has been severely affected by Covid, but store openings are intact. We see strong potential for store expansions throughout China, fostering earnings and margins growth. Post Covid-19, we believe consumers will prefer more quality, healthier products. ZHY’s packaged products are perceived as safe and cleaner products vs. unpackaged ones. In summary, after a very tough 2021 and a difficult first half of 2022, we are starting to see some light at the end of the tunnel. The messages from policy makers have been key to understanding the direction of the Chinese economy during the year. Although every year has its own particular characteristics, we see some historical patterns that are showing similar signals in 2021- 2022. As Mark Twain stated, History Doesn’t Repeat Itself but it often Rhymes. The current Russia/Ukraine conflict and its implications on the Chinese economy are risks we are closely monitoring.


[1] Source : Macquaire

[2] Source: Bloomberg and Macquaire

[3] China Should Eventually « Co-Exist » With Covid, Says Top Scientist (ndtv.com)

Australian fifty dollar bill

On February 21st, Australia finally reopened its border to international travellers after two years of being fully closed. One of the strictest travel bans of the COVID era, at one point more than 30,000 Australians were unable to access the country due to the limited amount of people allowed to return home every month.[1] The Australian government was not afraid to make a public example out of a certain tennis player to show how no exceptions would be made. Nonetheless, it slowly started showing signs in 2022 that it would shift from its strict zero-COVID strategy and instead hinted that it would follow the steps taken by the UK and other western countries to figure out how to live with the virus.

One of the biggest casualties of its zero-COVID strategy will be the end of its streak as the longest period of economic growth in modern history. Australia was able to navigate the Asian financial crisis, the dot-com bubble, the great recession of 2008, and a once-in-a-generation mining boom that ended in 2014 without experiencing a recession. Even after 30 years of continued growth, it took an almost complete shutdown of international trade to pull the Australian economy back into a recession. For the record, it was still a less severe downturn than almost every single country in the world except China experienced.[2]

Despite the end of this streak, Australia retains most of the growth drivers of the last 30 years. The strength of its consumers remains in solid shape thanks to government support, upward wage pressure due to a labour shortage, significant household savings, and the safety of the strong pension benefits. Australia’s geographic location places them in a unique position to benefit from the growth in Asian consumer spending power. Its abundant natural resources, especially its mining industry, are resilient and should benefit from an inflationary environment, and what many expect to be the start of a commodity super cycle.[3]

People more pessimistic about the Australian economy will usually point to its dependence on China as a trading partner. The trade war between the two nations was escalated to the World Trade Organization (WTO) in 2021 over tariffs that China implemented in 2020 on Australian products such as barley, coal, cotton, logs, meat and wine. This was the result of Australia’s previous criticism of China’s human rights record and the decision to ban Huawei from the country, in addition to other grievances formulated toward the Chinese government. While it is true that China always represents a risk to the Australian economy, representing roughly 40% of their good exports, this misses the dependence China has on some Australian commodities. Unsurprisingly, their largest export, iron ore, was not part of the tariffs China imposed on Australia. The Chinese government knew very well how difficult it is to find other sources of the same scale as Australia. Furthermore, as China was facing a coal shortage in October, it resumed letting Australian coal ships access their port after being banned since December 2020.[4] Although, strong political rhetoric between the two countries is expected to continue, it is unlikely that economic relations will get much worse in the short term.

It is also worth noting that the country’s reputation as being an economy dependent on natural resources is often exaggerated. Like Canada, Australia’s stock markets tend to move along with commodity prices. But the reality is that much like other developed markets, Australia’s economy is dominated by the service sector. Representing more than 70% of GDP, almost 80% of its labour force and 40% of its export earnings, its expertise range from energy and mining-related services to banking and fintech.[5] Outside of the tourism industry, the impact of the travel ban and other COVID measures had a limited economic impact as evidenced by the unemployment rate increasing only 1.45% between 2019 and 2020.[6]

Global Alpha enjoys the exposure to various names in the Australian services industry.

ALS Ltd (ALQ AU)

Based in Brisbane, ALS is one of the world’s largest testing providers of laboratory analysis services, offering assessment, inspection, certification and verification. They operate out of 350 sites across 65 countries and across three segments: life sciences, commodities and industrials. The new management is in the process of solving many business inefficiencies to improve margins and their growth profile to be more sustainable. ALS should be a clear winner from the exploding demand for commodities and the new project development that will result from it.

Bravura Solutions Ltd. (BVS AU)

Bravura Solutions provides web-based software products and SaaS to the wealth management and funds administration industries, primarily in the Asia-Pacific and European regions. With over 70 bluechip clients and $2.3t trillion in assets managed through its systems, it is a market leader with a sticky product that participates in an industry with increasing regulation and the need for outsourcing.

Smartgroup Corp Ltd. (SIQ AU)

Founded in 2001, Smartgroup is a leading provider of salary packaging, fleet management, share plan administration and payroll services based in Sydney. Quite popular in Australia, the concept of salary packaging involves an arrangement between employer and employees where certain items or benefits can be paid for out of your pre-tax salary, reducing taxable income and therefore tax payable. Their business model involves charging employers an admin fee for outsourcing this for an average of AUD$200 per employee every year. Their client base mostly includes entities that benefit from not having to manage this internally, such as not-for-profit, hospitals, governments, and universities.

Australia is a relatively small weight within our developed market benchmarks but a mix of its exposure to the Asian consumer, strong expected consumer and corporate demand, and a Federal election in May that could lead to more deficit expanding policies, should result in outsized growth in the years ahead. We are quite satisfied with the varied exposure we currently have there.


[1] Australia is ending its zero-covid strategy | The Economist

[2] Just four countries fared better than Australia (afr.com)

[3] June 10th 2021 GA commentary – Hot commodity

[4] China accepts stranded Australian coal as shortages bite, but unofficial ban on new orders remains (afr.com)

[5] The importance of services trade to Australia | Australian Government Department of Foreign Affairs and Trade (dfat.gov.au)

[6] Australia Unemployment Rate 1991-2022 | MacroTrends