A hand holding a computer microchip with a motherboard in the background.

China’s semiconductor ambitions returned to the spotlight following the recent meeting between President Trump and President Xi. While the US administration reportedly signaled willingness to permit exports of certain downgraded or older-generation AI GPUs into China, the more notable takeaway may have been China’s relatively muted reaction. Rather than relying on controlled access to foreign technology, China appears increasingly focused on accelerating the development of its own semiconductor ecosystem.

While the AI cycle continues to demonstrate remarkable strength, China’s push toward semiconductor self-reliance increasingly appears to represent an additional structural driver for the industry – one that could persist largely independent of the pace or duration of the current AI infrastructure cycle.

A focus on a domestic opportunity for self-reliance

The scale of the opportunity remains significant. China is already the world’s largest semiconductor consumption market, representing well over USD200 billion of annual chip demand and likely continuing to grow meaningfully over the coming decade. Yet domestic self-sufficiency across many semiconductor categories remains relatively low, leaving substantial room for domestic substitution over time. Even within analog and power semiconductors – categories generally viewed as more achievable for domestic suppliers – the opportunity remains large. Industry estimates suggest China’s power management semiconductor demand alone already represents a multi-billion-dollar market, while domestic suppliers still account for a relatively modest share. If China materially increases domestic semiconductor content over the coming years, tens of billions of dollars of annual value could gradually shift toward Chinese suppliers.

China still faces important technological bottlenecks. Advanced EUV lithography remains effectively inaccessible, while gaps persist across certain leading-edge manufacturing equipment, inspection and metrology tools and advanced materials. However, recent developments suggest China continues to make incremental progress across multiple parts of the semiconductor stack despite these restrictions. Domestic memory players have advanced meaningfully in NAND and DRAM, while progress in high-bandwidth memory (HBM), advanced packaging and other areas continues to evolve. More broadly, as the saying goes, necessity is often the mother of invention, and technological constraints themselves can become catalysts for accelerated domestic innovation.

Lessons from solar, batteries and EVs

Importantly, China has already demonstrated an ability to achieve global scale and competitiveness in industries once dominated by foreign incumbents. The country now holds leading positions across solar panels, batteries and electric vehicles, while also becoming increasingly competitive in industrial automation and advanced manufacturing more broadly. Regardless of one’s geopolitical perspective, China’s long-term willingness to commit capital, engineering talent and policy support toward strategic industries should not be underestimated.

As the AI infrastructure cycle evolves, bottlenecks have gradually expanded beyond AI accelerators and memory into broader areas of the semiconductor supply chain. More recently, power management integrated circuits (PMICs) have emerged as an area experiencing tighter supply-demand dynamics, driven by rising demand from data centres and AI infrastructure. AI servers require increasingly sophisticated power architectures, translating into higher semiconductor content and more advanced PMIC requirements. These products typically command higher pricing and more attractive margins, while stronger AI-related demand may also help stabilize pricing conditions across broader analog semiconductor markets.

Against this backdrop, we believe companies positioned within China’s domestic semiconductor ecosystem could benefit from these longer-term trends. One example within our Emerging Markets portfolio is Silergy Corp. (6415 TT), a China-based analog semiconductor company and one of China’s leading domestic suppliers of PMICs.

Why PMICs are important

PMICs are semiconductors responsible for regulating and distributing electrical power within electronic systems, helping ensure that processors, servers, vehicles and industrial equipment receive power efficiently, reliably and safely. Unlike leading-edge AI accelerators, analog and power management semiconductors are embedded across a broad range of everyday electronic applications.

Headquartered in Hangzhou, Silergy designs analog and mixed-signal semiconductors serving industrial, automotive, consumer electronics, computing and communications applications. While the company is gaining increasing exposure to AI servers and data-centre-related applications, its business remains diversified across multiple end markets, which in our view provides a more balanced way to participate in both semiconductor self-reliance and broader electronics content growth.

Silergy is already one of China’s leading domestic PMIC suppliers, yet its market share within China’s broader analog and power semiconductor market likely remains relatively small, suggesting a potentially long runway for continued share gains over time.

While market attention remains concentrated on the most visible AI beneficiaries, some of the more durable investment opportunities may emerge deeper within the semiconductor supply chain and away from the headlines. China’s semiconductor ambitions could ultimately prove to be one of the more important long-term trends still unfolding beneath the surface of today’s AI cycle.

Night view of Taichung, Taiwan.

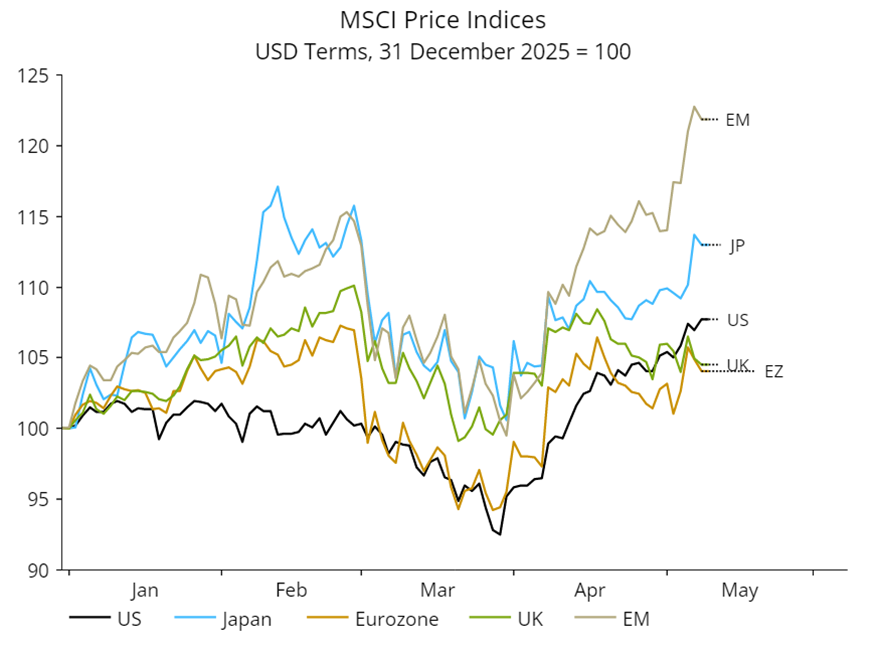
Emerging market equities have outperformed the rest of the world year to date.

Line graph illustrating the MSCI Price indices over the first 5 months of 2026, for the markets of US, Japan, Eurozone, UK and EM.
Source: NS Partners and LSEG Datastream

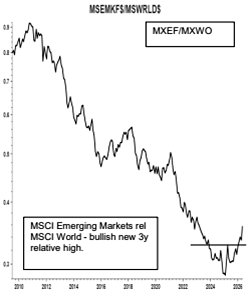
The asset class is decisively breaking out of a long-run trend of underperforming developed markets.

Line graph illustrating MSCI Emerging markets performance relative to the MSCI World since 2018.
Source: Bank of America, May 2026.

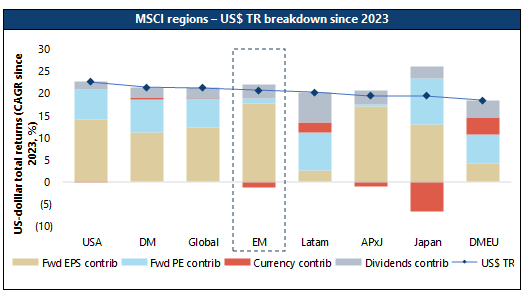
What is driving the turnaround? Looking at contributions to returns since 2023, earnings have been the clear driver for emerging market equities, with multiple expansion only a minor contributor.

Bar graph illustrating the total returns breakdown of different MSCI regions since 2023, highlighting EM.
Source: Jefferies quant research, April 2026.

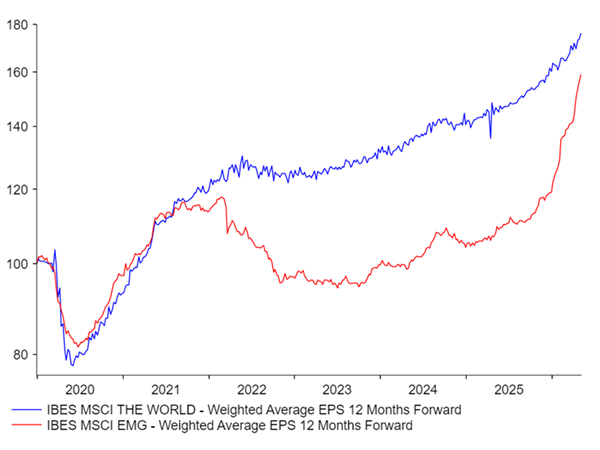
Earnings growth has been the key driver
A line graph comparing IBES MSCI The World weighted average EPS 12 months forward to IBES MSCI Emerging markets since 2020.
Source: NS Partners and LSEG Datastream.

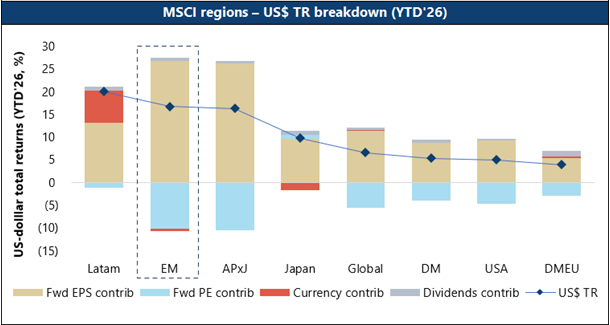
In fact, for the year to date as at the end of April, valuation compression has been a headwind for the asset class.

A bar graph illustrating the total returns breakdown of MSCI regions, highlighting EM with the highest forward EPS contribution.
Source: Jefferies quant research, April 2026.

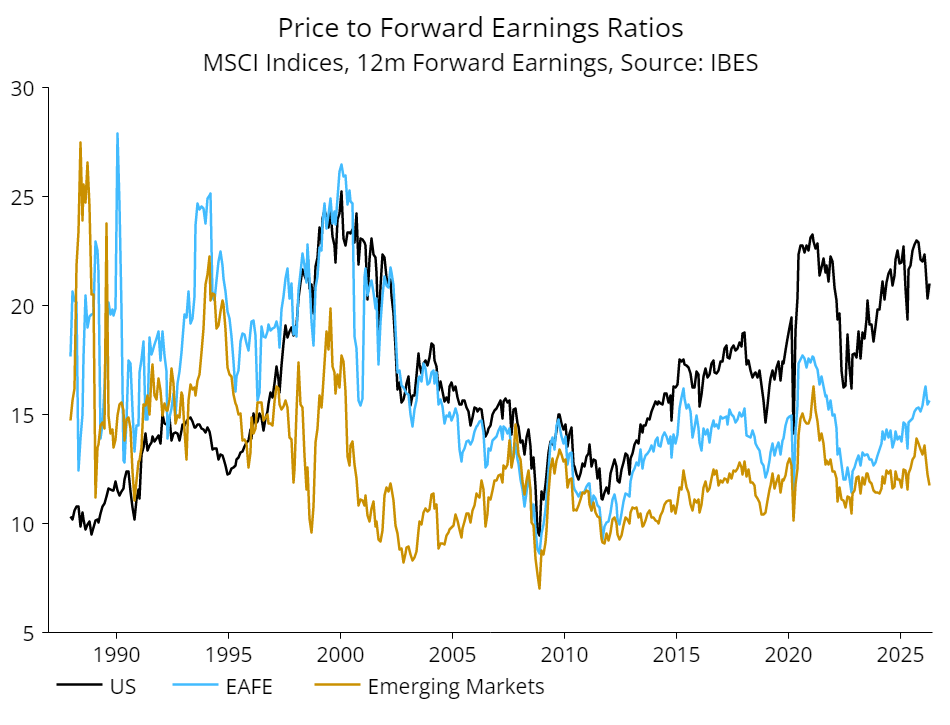
EM equities are now cheaper than they were in beginning of 2025 despite strong returns.

A line graph comparing the price to forward earnings ratios of US, EAFE and emerging markets MSCI Indices since 1990.
Source: NS Partners and LSEG Datastream.

We flagged in previous pieces that the signals we track suggested emerging market equities were positioned to outperform their developed market counterparts. Based on the headline numbers it appears this call has been vindicated (albeit over a short period) with the welcome combination of cheaper valuations and a strengthening earnings outlook.

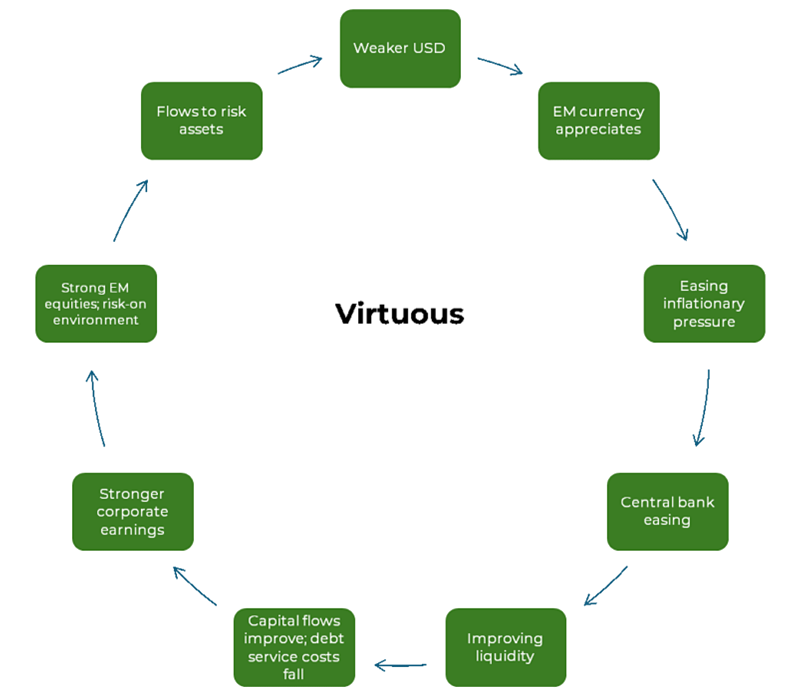
What got us particularly excited was the potential for a US dollar bear market driving a new virtuous circle, as illustrated below.

A image illustrating the stages of the virtuous circle: weaker USD, EM currency appreciates, easing inflationary pressure, central bank easing, Improving liquidity, capital flows improve; debt service costs fall, stronger corporate earnings, strong EM equities; risk-on environment, flows to risk assets.

We have had positive spurts in a number of markets which enjoyed easing currency pressure courtesy of a falling dollar and better liquidity. However, this has been overwhelmed by the US AI boom which is bleeding out into emerging markets with North Asia the clear winner.

It has been a narrow rally driven by US capex and the AI supply chain

This dramatic improvement in earnings and performance largely reflects a boom in South Korean and Taiwan tech companies. If you strip these markets out of EM, the return picture for the wider asset class is subdued.

YTD outperformance of EM equities has been entirely due to Korea/Taiwan, with the rest of the asset class lagging DM
Line graph comparing the MSCI Price Indices of US, Japan, Eurozone, UK, EM, EM ex Korea & Taiwan, and China since December 31, 2025.
Source: NS Partners and LSEG Datastream

The demand boom for key technologies that underpin the infrastructure needed to meet a massive build out of AI technologies and the flow through to earnings growth is swamping interest in other positive stories across the asset class.

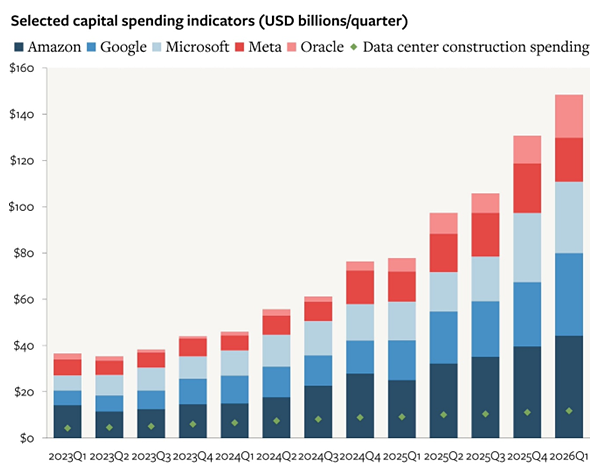
We are modestly overweight AI supply chain leaders in South Korea and Taiwan, who control key supply bottlenecks across memory and logic chips, thermal cooling, signals and switching, electrification and data centre assembly. Earnings growth and margins for these companies are downstream of rising investment from US hyperscalers seeking vast amounts of compute power to develop cutting-edge large language models.

A bar graph showing that quarterly capital spending indicators are increasing, considering the spending by Amazon, Google, Microsoft, Meta, Oracle and data centre construction.
Source: Koyfin, April 2026.

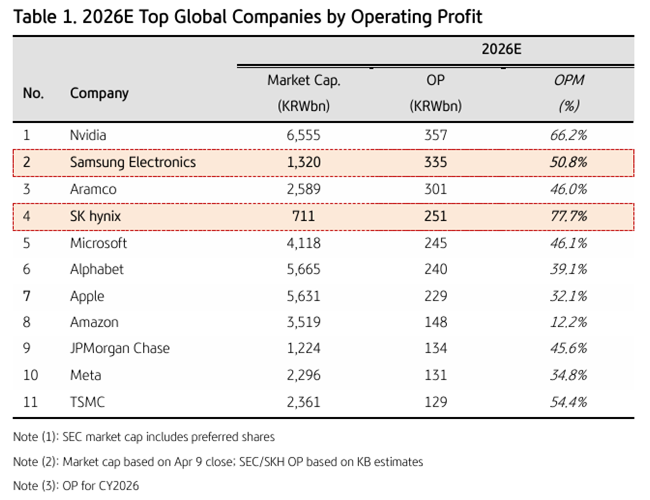
Portfolio names in these areas have posted outstanding gains over the last 12 months. While we have been quick to trim positions when stock valuations exceed what we think is reasonable, we have not run away from the rally and have maintained the overweight as we can see the fundamentals accelerating. For example, the supply-demand mismatch for high bandwidth memory is so great that memory giants SK Hynix and Samsung Electronics are now among the most profitable companies in the world.

A table showing the estimated 2026 top global companies by operating profit, highlighting Samsung Electronics at number 2, and SK hynix at number 4.
Source: Jefferies March 2026.

Earnings growth in South Korea has been so strong that valuations still look modest despite the market doubling

Samsung Electronics, Hynix and Micron are the only three companies in the world capable of producing HBM chips that are crucial components in Nvidia GPU clusters. And yet, Samsung and Hynix trade at a price to earnings multiples of less than 5x.

Two bar graphs. The first showing Next twelve months price-to-earnings ratio of KOSPI, MSCI AC Asia ex Japan, STOXX 600, S&P 500. The second graph shows next twelve months price-to-book ratio of those same indices.
Source: Deutsche Bank 2026.

Optically, cheap valuations reflect a market view that these remain deeply cyclical businesses in an industry with a history of violent booms and busts and thus lack the durability in the earnings growth to award a higher multiple.
Looking at the table above, there may be a good argument that the DRAM giants are over-earning and will attract competitors. On the other hand, we are mindful that AI innovation represents a major technological shift and the possibility that this could structurally alter demand dynamics in an oligopolistic industry controlling essential and hard to replicate technologies.

Maintaining conviction with tight risk management

While the pace of capex spending by the US hyperscalers and the cash flows going to hardware suppliers is extraordinary, the parabolic stock moves in a number of the names that we hold naturally make us twitchy. Major uncertainty remains over how LLM technologies will evolve and be monetised, whether competitor frameworks will gain dominance, and if real-world bottlenecks in memory and energy may ultimately slow the pace of development.

We have been careful to trim winners and recycle profits elsewhere in emerging markets where we are seeing other opportunities that excite us. Equally, relatively modest valuations and earnings visibility on our time horizon represent a significant upside risk which leaves us happy to maintain our overweight to the AI supply chain.

A silhouette of high voltage power lines against a colorful sky at sunrise.
Earnings remain resilient, but growth is concentrated, macro risks are building and selectivity is becoming critical.

Resilience in a tense environment

The Q1 reporting season underscores a growing divergence in global earnings. While US earnings growth remains robust, it is increasingly concentrated in AI-related industries. In contrast, Europe remains in a low-growth, late-cycle environment, while Japan continues to benefit from structural tailwinds. At the same time, a gap is emerging between the AI narrative and broader earnings. While AI-related sectors are seeing strong growth, the benefits have yet to spread across the wider economy.

The conflict in Iran has driven a sharp rise in oil prices and renewed volatility across equities and bonds, reflecting concerns around inflation and energy supply disruptions. It has also led markets to reassess the path of interest rates, with higher energy costs reducing the likelihood of near-term policy easing. This could test the resilience of corporate earnings through 2026.

So far, corporate earnings in developed markets have been more resilient than expected, despite successive macro shocks. Part of this resilience reflects lessons learned over the past five years. The pandemic period, in particular, has led to improved inventory management, stronger cost discipline and a greater willingness to implement cost optimization programs. More broadly, companies appear better equipped to manage their cost base, and in some cases, have demonstrated persistent pricing power. This has been particularly evident in industrials and technology, where contract structures and product differentiation have enabled effective price pass-through. These factors have helped preserve margins even as demand has plateaued or softened.

However, without a swift resolution to the conflict in Iran, global growth could decelerate further, exposing more vulnerable areas of the market. Discretionary spending, manufacturing and energy-intensive sectors such as transportation and logistics are likely to be most at risk. Rate-sensitive sectors, including residential real estate and REITs, could also face valuation pressure.

Looking at the broad small-cap market, balance sheets are structurally more fragile today than they were a decade ago when companies were deleveraging following the Global Financial Crisis. In the current environment, smaller companies are more exposed to rising interest costs and refinancing risk, particularly at the lower end of the quality spectrum.

Positioning for resilience

In this environment, a quality-focused approach centred on sustainable EPS growth remains critical. Our strategy continues to prioritize companies with strong balance sheets and high returns on equity.

As illustrated by our portfolio characteristics, our Global and International Small Cap strategies exhibit the following attributes:

End of March 2026 Global Small Cap vs. Index International Small Cap vs. Index
Leverage (Net debt/EBITDA) Leverage is ~74% lower than the benchmark Leverage is ~83% lower than the benchmark
Operating margin +558 bps above the benchmark +937 bps above the benchmark
Return on equity + 451bps above the benchmark +407 bps above the benchmark
Forward EPS growth +793 bps above the benchmark +750bps above the benchmark

Source: IDA, Bloomberg, MSCI

The lower leverage of these strategies points to less balance-sheet risk and better ability to navigate higher-for-longer rates. At the same time, the higher operating margins and stronger ROE, alongside faster forward EPS growth, are indicative of higher-quality businesses with more durable profitability and earnings power than the benchmark.

In addition, we continue to focus on companies exposed to structural growth drivers. Themes such as electrification, automation, health-care innovation, defence and reshoring offer improved visibility over the medium term. These areas can provide both defensive characteristics in a slowdown and operating leverage in a recovery.

Old water pipes joined with new blue valves and new blue joint members.

Driven by years of underinvestment, rapid urbanization and the need to adapt to a power-driven, technology-led world, infrastructure spending is a key tool governments use to stimulate economic growth. Regardless of what drives the allocation, civil infrastructure – the systems that underpin essential societal functions – remains a foundational focus of government spending.

The US government’s current focus on infrastructure

The 2021 Infrastructure Investment and Jobs Act (IIJA) is in full swing and will last until 2030 and beyond. The approximately USD1.2 trillion US expenditure bill is allocated to roads, bridges, transport safety, transit, freight, chargers, power and broadband.

Spending on US highways and streets is currently at historic highs, reaching a seasonally adjusted annual rate of approximately $149.5 billion in January 2026. This sector remains a primary driver of public infrastructure growth, bolstered by long-term federal funding. But despite high spending, the American Society of Civil Engineers (ASCE) estimates a $684 billion funding gap for roads over the next decade (2025–2035).

The business cycle is such that architecture and engineering firms gain from the bulk of the work at the onset, executing on planning and design. Then come the bids and proposals on work and equipment, which ultimately fill the backlogs of suppliers and contractors.

The right tools for the job

Based in Downers Grove, Illinois, Federal Signal Corporation (FSS US) manufactures specialized equipment for infrastructure maintenance, public safety and environmental cleaning. The company operates between 24 to 27 principal manufacturing facilities worldwide and directly manages over 40 service centres. Already within our portfolio, the company is one that may be positioned to benefit from infrastructure spending by providing the necessary equipment and technology to support civil infrastructure projects.

Federal Signal’s diversified business groups offer products that serve multiple infrastructure subsectors. The Environmental Solutions Group is the largest manufacturer of dump trucks in the United States. They also manufacture street sweepers, sewer cleaners and industrial vacuum loaders, safe-digging and road-marking equipment. The Safety and Security Systems Group provides technology and systems used by first responders and industrial facilities to protect lives and property.

Federal Signal delivers a comprehensive suite of equipment designed to support a wide range of IIJA-funded project areas, as highlighted in the table below.

IIJA allocation (in USD) Area of infrastructure investment Federal Signal equipment
$10 billion Roads and bridges Street sweepers, vacuum excavators
$55 billion Water and sewers Sewer cleaners
$65 billion Broadband Safe-digging trucks
$73 billion Electrical grid modernization Safe-digging trucks
$11 billion Transportation safety programs Public warning systems, emergency vehicle equipment


Cementing a provider of construction materials

Large scale infrastructure projects such as bridges and transit require longer planning and often are fully realized toward the tail end of the spending period. Global Alpha is positioned through Eagle Materials Inc. (EXP US), an important producer of cement, to strategically capture the roughly USD550 billion allocated for new construction materials.

Eagle Materials possesses regional market dominance: The company’s 70+ facilities are concentrated in the US Heartland, Sun Belt and Mountain West. These inland markets are protected by high transportation costs, which limit competition from cheaper foreign imports.

Between 2024–2025, Eagle invested heavily in modernizing plants like the Laramie, Wyoming facility, increasing cement output by 50% specifically to meet the rise in IIJA-funded municipal projects. Within the same time frame, Eagle converted nearly 100% of its cement capacity to Portland Limestone Cement (or PLC). This low-carbon product is increasingly required for government-funded projects that prioritize environmental sustainability.

Strategically, the company shifted its sales mix toward non-residential and public infrastructure, sectors projected to grow by roughly 5% in 2026, to offset recent softening in the residential housing market.

Global phenomena

Civil infrastructure is being accelerated on a global basis; China spent USD550 billion on transport infrastructure in 2025 alone. Japan just began a USD140 billion mid-term plan for the implementation of national resilience. Global Alpha is exposed to global civil infrastructure buildout through Sany Heavy Equipment International Holdings Co. Ltd. (631 HK).

Hong Kong-listed Sany is the world’s third-largest heavy equipment manufacturer. Their equipment is designed with a focus on being « easy to own, easy to operate and easy to service, » prioritizing essential functionality over excessive technical complexity. The company is also a global leader in concrete machinery, especially after acquiring the legendary German brand Putzmeister. Products include truck-mounted pumps, stationary pumps and concrete mixers. Large-scale engineering contractors account for approximately 45% of Sany’s revenue.

That demand is increasingly coming from outside China: overseas markets now contribute 64% of revenue, led by Africa, where sales surged 55% on the back of infrastructure buildouts. To capitalize on this momentum, Sany has shifted its mix toward infrastructure-heavy “civil works” applications, helping drive a 41% increase in net profit in 2025.

Keeping assets clean, clear and operational

Global Alpha also holds Bucher Industries AG (BUCN SW), a Swiss industrial group that provides specialized machinery and components for essential infrastructure, specifically through its Bucher Municipal and Bucher Hydraulics divisions. Unlike heavy civil construction firms, Bucher focuses on the maintenance, cleaning and operational safety of existing civil assets.

Bucher’s connection to civil infrastructure is primarily functional, ensuring that public and commercial traffic areas remain operational and safe. For sewer and drainage infrastructure, Bucher produces specialized sewer cleaning and water recycling units essential for managing urban water networks and preventing flash flooding on major roadways. Bucher also provides construction site support through its heavy-duty sweepers, specifically engineered to handle the abrasive materials (e.g., aggregate, spoil) found on large-scale infrastructure construction sites.

Civil infrastructure is more than a standalone spending category – it is the operating backbone that enables other critical buildouts, from power and water management to digital connectivity. For Global Alpha, this creates diversified, real-economy exposure to long-duration public investment, spanning both new construction and the ongoing maintenance that keeps cities functioning.

View of downtown Gangnam Square in Seoul, South Korea.
 

Positive for emerging markets
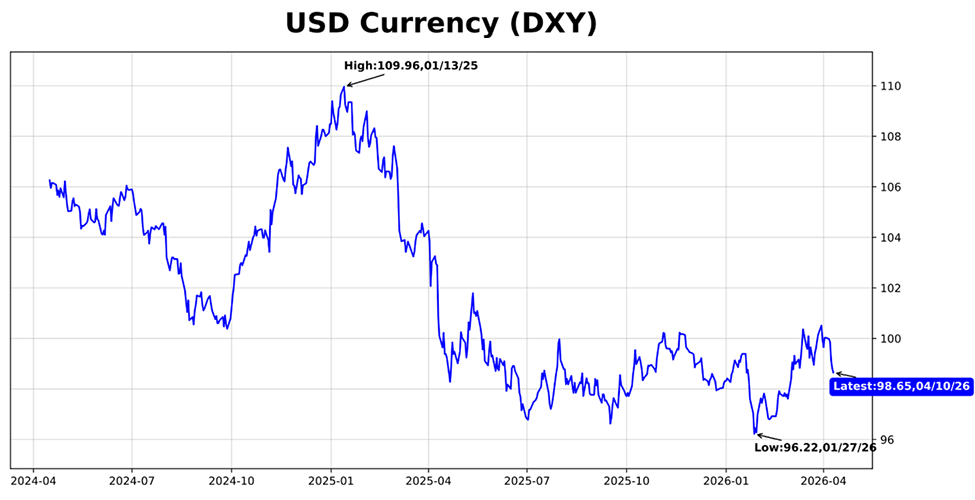
A line chart illustrating the US dollar index over time.
Source: Bloomberg, as at April 10, 2026


Learn fast and adjust

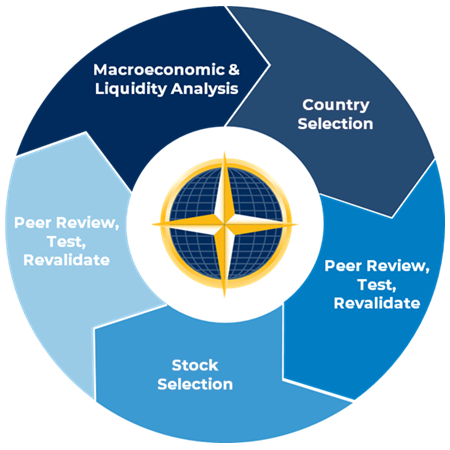
In last month’s commentary, we discussed our approach to forecasting and portfolio management in times of market stress with reference to the OODA (Observe, Orient, Decide, Act) Loop below.

Illustration of an "OODA loop." A forecasting approach that includes probabilistic estimates, calibration, learning and frequent belief updates.

To quickly recap:

Through periods of high uncertainty and violent market moves like what we have currently, we lean heavily into this OODA Loop. This involves a constant testing and re-testing of our macro views and investment hypotheses, and tweaking of the portfolio as conditions change.

We thought this thematic would be worth unpacking further, as these markets provide a great illustration of how a robust process can help navigate periods of high volatility and uncertainty.
 

Sweating the capital

This approach helps us to remain disciplined, learn fast as new information arrives and make small, frequent adjustments to ensure there is tight alignment between evolving beliefs and portfolio risk.

We call this “sweating the capital,” with the aim being to:

  1. Limit the size and persistence of errors without dulling upside capture; and
  2. Maximise risk-adjusted returns over the long run.

In a volatile quarter, the portfolio outperformed thanks to a balance of investments in focused, volatile, risk-on names across niches in the AI supply chain in Taiwan and South Korea, alongside more defensive holdings including oil producers, Asian financials and Brazilian water utilities. The former outperformed through January and February, while the latter helped us hold on to relative gains through a risk-off period in March.

Achieving the right balance of risk across the portfolio is the output a rigorous process based on a set of long held beliefs (the impact of liquidity in driving prices, importance of macro sensitivity in EM and peer review to guard against behavioural error), all of which is all geared to matching the capital in the portfolio with the conviction of the team.

It sounds very simple, but it is a demanding process, requiring tight collaboration across a team of experienced and opinionated investors, as well as the discipline and energy to continually update beliefs, capital and conviction as conditions change.

That discipline is especially important for navigating times of high uncertainty and market volatility.
 

Process under pressure

The testing and re-testing of investment beliefs in our process takes place formally through weekly investment policy meetings, along with monthly country and stock meetings. This structure helps us orient ourselves and debate how best to move ahead while documenting everything as we go.

Gulf War III is a powerful example of how volatile markets expose habits and test investment beliefs. These periods throw so much information at investors that it can be paralysing to a team without well-established and repeatable decision-making routines.

For us, disciplined preparation, structured collaboration and strong behavioural standards are key tools for us to maintain emotional control and remain focused on execution.
 

Calm, clear and deliberate decision making

One example of how structure and routine help aid our decision making is through the team stock meeting. Here we discuss any portfolio companies whose stock has moved up or down by a certain threshold amount in relative terms. In either case, this involves the team re-testing the investment hypothesis for a given name to assess whether it remains intact.

We do not rely on static forecasts from the original stock research notes on companies to guide us through an uncertain period like this. Instead, the review trigger – a fairly modest relative stock move – forces us to re-underwrite our forecasts and adjust conviction accordingly.

The result is that we can quickly identify winning ideas and scale them up, as the meeting and team discussion help us cut through the market noise and identify improving fundamentals earlier, even when uncertainty is high. Equally, it allows us to cut losers faster when new information invalidates an investment thesis, helping to avoid thesis drift and subsequent drawdowns.

This process has been crucial for operating in whipsawing markets like this.

It has provided opportunities to tilt the portfolio towards areas where attractive long-term prospects remain intact, and are also more insulated from the energy shock. Below are two examples.
 

AI memory bottleneck

“High bandwidth memory is the single biggest bottleneck to scaling AI systems today.”
— Dylan Patel (SemiAnalysis), as discussed in an interview on the Dwarkesh podcast, March 2026

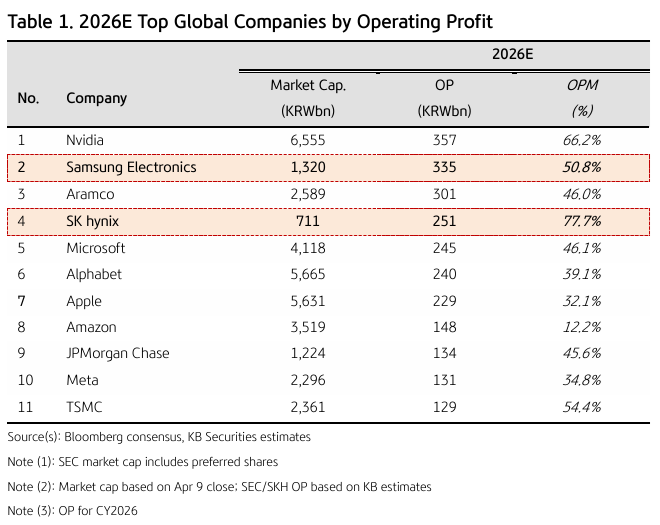
As we wrote back in early 2024, the difficulties in scaling up high bandwidth memory supply amid explosive demand to support AI GPU clusters is driving a cycle of unusually strong margins, cash generation and earnings visibility for DRAM giants SK Hynix and Samsung Electronics.
 

Historically significant – this cashflow is off the scale
Table illustrating the top 11 global companies by operating profit, with Samsung Electronics in the second position, and SK hynix in the fourth position.
Source: KB Securities, March 2026

 
However, our level of exposure is tempered by caution over risks of US hyperscalers pulling back AI investment, the emergence of circular financing arrangements and increasing reliance on debt.
 

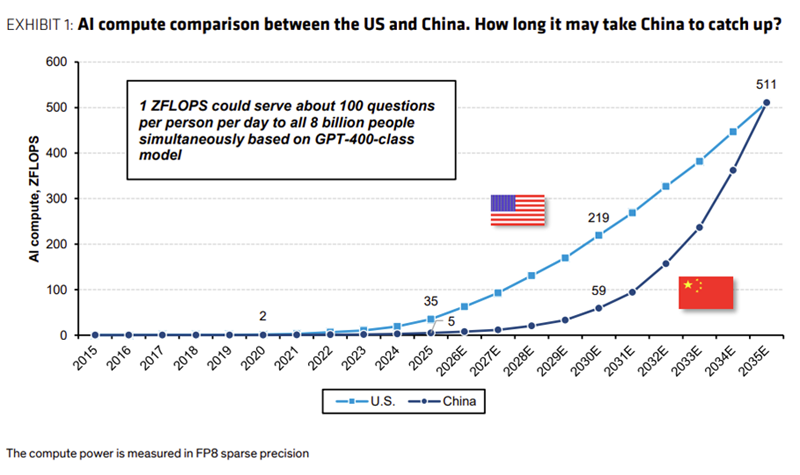
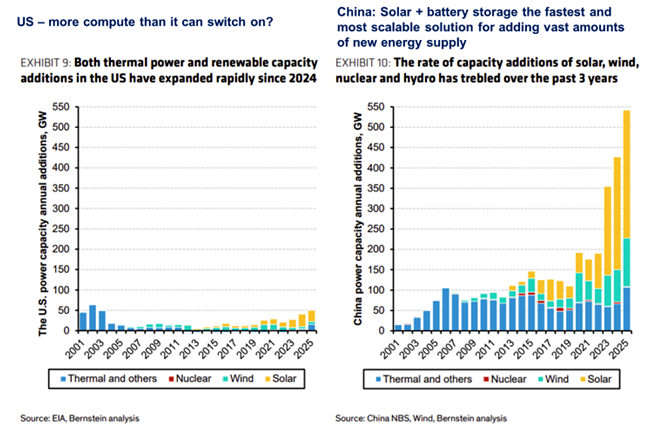
Necessity is the mother of invention – cheap energy is China’s answer to US compute edge
A line graph illustrating the trending AI compute power of the United States and of China to the year 2035.
Source: Bernstein, March 2026


China playing catch-up through more (and less efficient) chips and bigger data centres
 
Two bar graphs side by side. The first graph shows how much power capacity that the United States has added annually, and the second graphs shows how much power capacity China has added annually, with China outpacing the United States in additions.
Source: Bernstein, March 2026

 
Last year, China added an enormous 500 GW of power capacity to its grid, more than the rest of the world combined. Much of this comes from rapid growth of solar energy, by some measures now cheaper than coal power in China.

The battery and power management technology supplied by portfolio company CATL is crucial to this revolution.

The limestone quarry in Faxe, Denmark’s largest man-made excavation.

Lime and limestone are materials that have shaped human civilization for thousands of years. Limestone is a common sedimentary rock formed mostly from calcium carbonate. It develops over millions of years from either marine organisms (shells, coral, plankton, etc.) or chemical precipitation in oceans and lakes.

Limestone is converted into lime by burning (calcining) it in a kiln at 1000ºC. Lime can then be mixed with water (hydrated) to form hydrated lime. Finished lime then absorbs CO2 and slowly transforms back to calcium carbonate (i.e., limestone). The lime cycle is one of the oldest known chemical cycles used by humans

Limestone been used as building material for centuries, from pyramids to great cathedrals of Europe, including Notre Dame, Westminster Abbey and St Peter’s Basilica. More commonly it is used as an ingredient in cement and concrete, and in building roads. It is also a widely used industrial mineral, either unprocessed or transformed into a lime derivative.

Limestone is estimated to account for 15% of surface rock on Earth, but high-purity limestone valued in industrial, construction, environmental and agricultural applications is much rarer as are deposits of scale that can be commercially exploited.

Applications across industries

SigmaRoc PLC (SRC LN), a recent addition to the portfolio, is a lime and minerals group targeting quarried materials assets in the UK and Northern Europe. The business is asset backed with over 2.7 billion tonnes of mineral reserves and resources, the equivalent of over 100 years of resources.

SigmaRoc has exposure to the construction, industrial and environmental end markets with applications such as:

Construction

  • Quarried limestone and granite materials are used in both infrastructure and residential applications such as the construction of roads, railways, bridges, ports, airports and buildings. The main products include aggregates, asphalt, ready mix concrete, pre-cast concrete and dimension stone.

Industrial

  • Lime is used as a flux in steel and copper production to remove impurities and control melt chemistry.
  • Quicklime is involved in pulp and paper production.
  • Limestone powder is used as a filler in paints and adhesives.

Environmental

  • Quicklime, slaked lime and limestone powder remove acidic compounds from flue gas.
  • Lime treats drinking water by raising pH, and wastewater by reducing toxicity.
  • In soil treatment, lime raises soil pH.

Quarries and their locations

SigmaRoc has an advantage in that it owns quarries. In countries where it does not own quarries (the UK and Poland), it has on-site kilns and long-term supply agreements with the quarry owner. Owning the quarry means fixed costs are manageable and ensures both the quantity and quality of supply.

Having quarries located close to customers has key logistical advantages. Firstly, the weight of the product means it is not feasible to ship long distances. Lime products are dangerous to transport due to lime’s high chemical reactivity. It is classified as corrosive under transport regulations and producers need regulatory compliance to ship. Quicklime degrades over time, meaning shipping long distances is unfeasible, reducing the threat of imports.

Integration, growth and megatrends

The three main lime producers in Europe are SigmaRoc and two privately owned Belgian companies. After those, the market is fragmented and the SigmaRoc has a “buy-and-build” growth model. The strategy is to acquire assets (quarries, lime and limestone businesses, related infrastructure) in fragmented local markets, then integrate them to extract synergies, scale and efficiency.

SigmaRoc has cyclical recovery potential and is poised to benefit from megatrends that support long-term growth. If macro conditions improve – supported by infrastructure spending, lower rates and renewed housing policy – SigmaRoc’s scale and flexibility could drive outperformance. Its diversified presence across geographies also helps smooth region-specific cycles.

Future growth is also supported by the ongoing electrification of economy. This creates a huge increase in demand for batteries, and lime is required in the mining and refining of lithium. European steel – and especially green steel – should also benefit from electrification, so long as the industry is protected from high carbon inputs, potentially reduced import quotas and higher tariffs. Beyond electrification, flue gas scrubbing creates an environmental market for lime, a process that addresses shipping emissions.

Limestone and lime are attractive markets due to high barriers to entry, the irreplaceable nature of product and the lack of material import flow into Europe. With an M&A track record as the foundation for future growth, we believe that makes SigmaRoc a compelling investment in the materials sector.

Trinity College, Université de Toronto – Toronto, Ont., Canada.

Il n’y a pas si longtemps, les placements alternatifs ne jouaient qu’un rôle marginal dans les portefeuilles de fonds de dotation des universités canadiennes. L’exposition à des actifs comme l’immobilier commercial, les infrastructures, le capitalinvestissement, le crédit privé et les fonds de couverture était limitée pour des raisons pratiques, et non pas en raison de la philosophie de placement. Souvent, les fonds de dotation plus modestes ne disposaient pas de l’envergure nécessaire pour respecter les engagements minimaux ni des ressources internes nécessaires pour gérer la complexité opérationnelle accrue.

Ce contexte a changé. Selon le dernier sondage sur les placements de l’Association canadienne du personnel administratif universitaire (ACPAU), les fonds de dotation canadiens ont eu de plus en plus recours à des stratégies alternatives au cours des dernières années.

Qu’est-ce qui explique ce changement?

Les fonds de dotation de petite et moyenne taille ont maintenant accès à des plateformes conçues avec soin par des gestionnaires et consultants en placement. Ces solutions réduisent les engagements minimaux, rationalisent les opérations et permettent aux fonds de dotation de constituer des portefeuilles diversifiés qui ressemblent de plus en plus à ceux de leurs homologues institutionnels beaucoup plus importants.

Changement marqué dans la répartition des solutions de placements alternatifs

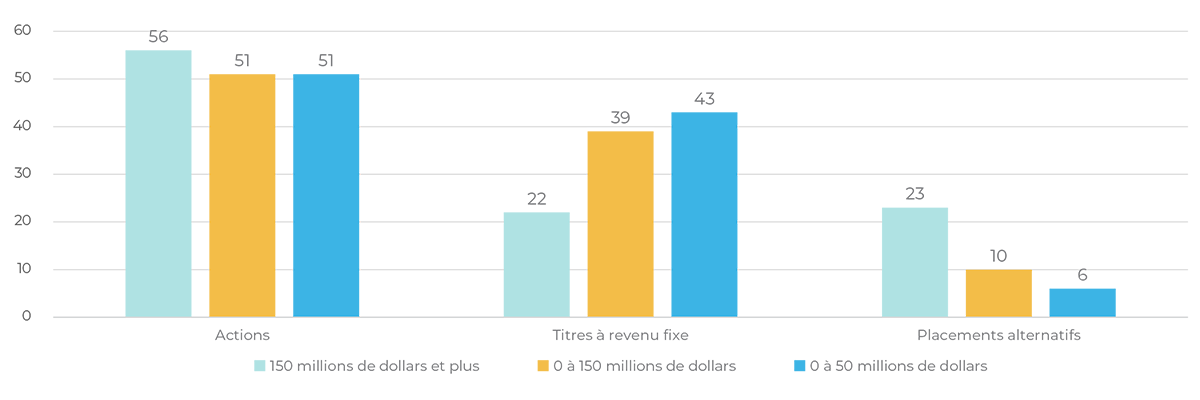
Les grands fonds de dotation canadiens, soit ceux dont l’actif dépasse 150 millions de dollars, ont depuis longtemps intégré des placements non traditionnels dans leurs portefeuilles. En revanche, la répartition moyenne des fonds de dotation de plus petite taille est nettement inférieure, comme le démontre la figure 1.

Figure 1 : Répartition moyenne de l’actif de l’ACPAU (fin 2024)
Graphique à barres illustrant la répartition moyenne des actifs des fonds de dotation des universités canadiennes en 2024, en fonction de la taille des fonds, les fonds de dotation les plus importants présentant une part plus importante d'actifs alternatifs. Source : enquête sur les investissements du CAUBO.
Source : Sondage sur les placements de l’Association canadienne du personnel administratif universitaire.

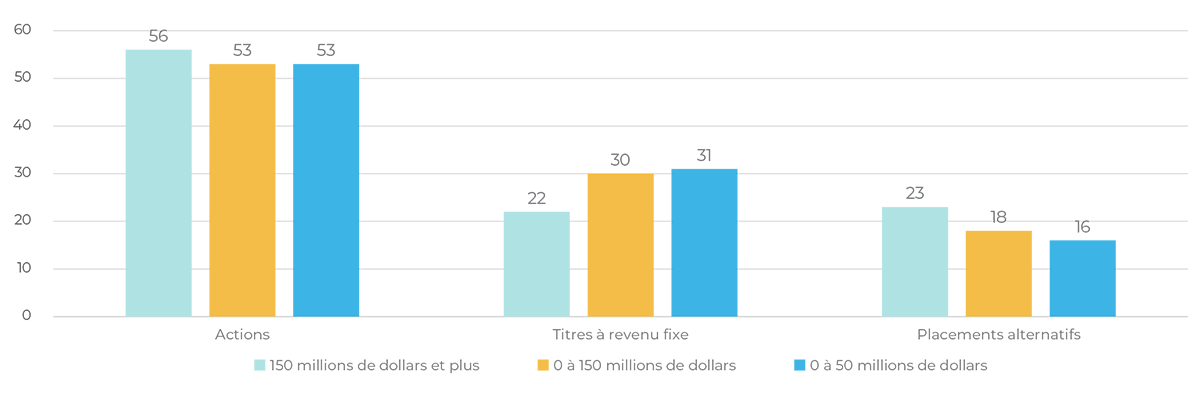
Fait important, les moyennes globales sous-estiment l’ampleur de cette évolution. Pour les fonds de dotation disposant d’actifs inférieurs à 150 millions de dollars, les données agrégées incluent un nombre significatif de fonds ne présentant aucune allocation aux placements alternatifs. Lorsque l’analyse se limite aux fonds de dotation qui investissent effectivement dans ces actifs, un portrait différent se dessine : les allocations moyennes augmentent sensiblement, passant de 10 % à 18 % pour les fonds de moins de 150 millions de dollars, et de 6 % à 16 % pour ceux de moins de 50 millions de dollars (figure 2).

Figure 2 : Répartition moyenne de l’actif de l’ACPAU (fin 2024) – seulement si l’actif est investi
Graphique à barres illustrant la répartition moyenne des actifs des fonds de dotation des universités canadiennes en 2024, par taille de fonds, en ne tenant compte que des fonds investis dans des placements alternatifs. Source : Enquête sur les investissements du CAUBO.
Source : Sondage sur les placements de l’Association canadienne du personnel administratif universitaire.

Pourquoi investir dans les placements alternatifs?

La pondération croissante des placements alternatifs reflète un ensemble d’avantages structurels qui s’harmonisent bien avec les objectifs de dotation à long terme. Les placements alternatifs peuvent accroître le potentiel de rendement, améliorer la diversification, protéger contre l’inflation et améliorer la résilience globale des portefeuilles.

Les actifs privés ne sont pas évalués quotidiennement, ce qui réduit la volatilité déclarée et peut être utile pour les investisseurs à long terme en favorisant des résultats de portefeuille plus harmonieux et des politiques de dépenses plus stables. De plus, les stratégies de placements alternatifs présentent souvent une corrélation faible, voire négative, avec les marchés traditionnels des actions et des obligations, ce qui aide à améliorer l’efficacité du portefeuille et les rendements ajustés au risque.

Bien que certains fonds de dotation continuent de compter principalement sur les actions et les titres à revenu fixe et qu’ils ont profité de la solide performance du marché boursier au cours des dernières années, le contexte actuel souligne l’importance de revoir la diversification totale des portefeuilles. L’adoption de solutions de placements alternatifs peut aider à établir un profil de risque et de rendement plus résilient, particulièrement à mesure que les conditions du marché évoluent.

Photo de Josh Borys.

Le Groupe financier Connor, Clark & Lunn (Groupe financier CC&L) est heureux d’annoncer que Josh Borys se joint à son équipe de direction à titre de directeur général le 1er avril 2026. Il sera responsable des sociétés affiliées du marché privé.

Josh possède une vaste expérience de la dette privée, ayant occupé des postes à Sagard Credit Partners et à l’Office d’investissement du RPC dans cette catégorie d’actif. Il est titulaire d’un baccalauréat spécialisé de la Richard Ivey School of Business de l’Université Western.

« Josh renforce notre groupe de directeurs généraux en ajoutant une capacité spécialisée dans les marchés privés, un domaine qui représente une part importante de nos activités actuelles et qui sera un facteur clé de croissance future, tant pour les sociétés affiliées existantes que pour les nouvelles sociétés affiliées au fil du temps », a déclaré Michael Walsh, président et directeur général du Groupe financier CC&L.

Josh travaillera à Toronto.

Reflet de gratte-ciel panoramique sur le bord de la rivière False Creek à Vancouver, en Colombie-Britannique, au Canada.

Au cœur de notre organisation se trouvent l’engagement et le désir d’offrir un rendement et un service supérieurs à nos clients. Notre principal objectif est de répondre aux attentes de nos clients tout en nous assurant que notre équipe est très motivée et enthousiaste. Pour y arriver, nous nous concentrons sur ce que nous faisons de mieux tout en cherchant à demeurer à l’avant-garde de la recherche et du développement sur les marchés des capitaux.

Le statu quo n’est pas une option

Chaque année, nous profitons de l’occasion pour fournir à nos clients une revue annuelle de l’entreprise, décrivant comment nous orientons nos efforts au sein de Gestion de placements Connor, Clark & Lunn (CC&L) pour respecter notre engagement à offrir un bon rendement des placements et un service à la clientèle supérieur.

Nos activités ont toujours été caractérisées par un réinvestissement continu et l’innovation; le statu quo n’est pas une option. Alors que nous composons avec un contexte financier et politique volatil, nous avons concentré nos efforts sur trois domaines de base qui sont essentiels à la vigueur et à la durabilité à long terme de notre société : notre personnel, nos capacités technologiques et notre infrastructure physique.

Notre investissement le plus important est dans notre équipe. En 2025, nous avons accueilli 28 nouveaux collègues au sein de la société et nous prévoyons en ajouter environ le même nombre en 2026. Ces ajouts touchent les fonctions de placement et du service à la clientèle, ce qui renforce à la fois nos capacités actuelles et le développement de notre relève. Cette croissance reflète notre engagement à bâtir une entreprise durable d’une génération à l’autre. En investissant dans le perfectionnement des talents, la planification de la relève et l’accompagnement de notre prochaine génération, nous veillons à ce que nos clients continuent de profiter d’une organisation solide, stable et tournée vers l’avenir.

La technologie est le deuxième pilier de notre stratégie de réinvestissement. Nous procédons à la modernisation des systèmes dans l’ensemble de nos fonctions de soutien et des opérations intermédiaires afin de renforcer la résilience opérationnelle, d’améliorer l’intégration des données et d’élargir nos capacités de production de rapports. Ces améliorations renforcent l’infrastructure qui soutient nos processus de placement et la prestation du service à la clientèle. Parallèlement, nous élaborons une approche rigoureuse en matière d’intelligence artificielle (IA). Notre stratégie vise à permettre à chaque secteur de nos activités de tirer parti des outils et de la technologie d’IA pour améliorer les processus de placement et d’affaires. L’introduction d’outils d’IA exige une surveillance adéquate et délibérée. Peu importe la complexité et le niveau de sophistication de l’intégration de l’IA, nos employés restent chargés de garantir la qualité et la pertinence des résultats et assument la responsabilité finale de chaque fonction.

Enfin, nous effectuons des investissements importants dans nos bureaux à Vancouver et à Toronto. Ces améliorations visent à créer des environnements qui favorisent la collaboration, la créativité et la connexion. Nos espaces remaniés soutiennent le travail d’équipe, le dialogue interfonctionnel et un engagement plus fort au sein des équipes de placement, des solutions clients et des opérations. L’objectif est de créer des conditions qui permettront de remettre en question, de peaufiner et de mettre en œuvre les idées de façon efficace, ce qui profitera à nos clients. Nous avons hâte d’accueillir les clients dans nos nouveaux bureaux en 2026 et de partager ces espaces actualisés en personne.

En terminant, je tiens à remercier sincèrement nos clients de leur confiance et de leur partenariat soutenu.

Sincères salutations,

Photo de Martin Gerber
Martin Gerber
Président et chef des placements

Notre équipe

En 2025, notre société a continué de croître, accueillant 28 nouveaux employés et portant notre effectif à 150 personnes. Nos activités profitent également de l’ensemble du Groupe financier Connor, Clark & Lunn, qui emploie plus de 500 professionnels soutenant la gestion des affaires, l’exploitation, le marketing et la distribution.

La stabilité et les spécialisations de notre société demeurent les principaux moteurs de nos activités. La planification de la relève et le perfectionnement professionnel sont au cœur de notre approche, assurant la continuité et la réussite à long terme.

Nous sommes heureux d’annoncer que plusieurs employés ont été promus au poste de directeur principal depuis le 1er janvier 2026, en reconnaissance de leur contribution importante et croissante à notre société.

Photos de Lewis Arnold, James Burns, Sonny Cervienka, Jasmine Chen, Nick Earle, Calen Falconer-Bayard, Artem Kornev, Hien Lee, Jessica Quinn, Jian Wang et Alice Zhou.

Le conseil d’administration de CC&L est également heureux d’annoncer la promotion de nouveaux actionnaires depuis le 1er janvier 2026, en reconnaissance de leur leadership et de leur influence dans leurs fonctions.

Photo de Tim Elliott  Photo de Sandy McArthur

Titres à revenu fixe

Au cours de la dernière décennie, l’équipe des titres à revenu fixe a investi considérablement dans l’élaboration d’un cadre quantitatif visant à repérer et à récolter des primes intéressantes sur les marchés des titres à revenu fixe, d’abord dans le cadre de stratégies relatives à un indice de référence, puis dans des mandats à rendement absolu. Comme ces flux de rendement systématiques se sont révélés à la fois attrayants et diversifiés, la demande des clients pour des solutions spécialisées a commencé à croître. En réponse, l’équipe fait évoluer ces capacités vers des stratégies quantitatives spécialisées, pouvant être mises en œuvre soit comme solutions de rendement total, soit comme source d’alpha portable venant s’ajouter à une gamme complète de sources de rendement de marché. Nous continuons d’investir dans la recherche, les infrastructures et les talents pour approfondir ces capacités et soutenir l’intérêt croissant des clients pour des sources de rendement résilientes et diversifiées dans différentes conjonctures de marché.

Sandy McArthur s’est joint à l’équipe des titres à revenu fixe en mai 2025 et est rapidement devenu un moteur central des initiatives stratégiques à l’échelle de la plateforme. Il allie une solide expérience du marché à une grande maîtrise technique, ce qui permet à l’équipe d’agir plus rapidement et de mener ses activités avec davantage de rigueur. Sa ténacité, ses compétences interfonctionnelles et sa volonté de prendre en charge des dossiers complexes ont déjà eu une incidence importante sur l’entreprise. Nous sommes heureux de l’accueillir à titre d’actionnaire en 2026.

Stratégies fondamentales d’actions

Après plus d’une décennie de surperformance des actions américaines, l’équipe estime que le marché boursier canadien est bien placé pour enregistrer des rendements supérieurs à moyen terme. Les valorisations intéressantes, la répartition sectorielle différenciée et une forte exposition à la hausse de la demande mondiale de produits de matières premières créent un contexte attrayant pour les actions canadiennes.

L’équipe des Stratégies fondamentales d’actions continue de soutenir les objectifs de placement des clients dans l’ensemble des mandats. Dans ce qui a été un contexte difficile pour les gestionnaires actifs en 2025, toutes les stratégies, y compris les actions canadiennes toutes capitalisations, les actions axées sur le revenu et les actions à petite capitalisation, ont produit un rendement dans le quartile supérieur par rapport à leurs pairs respectifs.

Pendant plusieurs années, l’équipe des Stratégies fondamentales d’actions met l’accent sur le développement de la prochaine génération de relève en placement. Au cours des 12 derniers mois, trois associés de recherche expérimentés se sont joints à l’équipe, renforçant davantage ses capacités de recherche. Ce réinvestissement délibéré souligne l’engagement de l’équipe à maintenir le rendement, à approfondir l’analyse et à maintenir un avantage concurrentiel par rapport à ses pairs à long terme. Parallèlement, l’équipe met activement en œuvre le plan de relève de Gary Baker. Le 1er janvier 2026, Michael McPhillips a été nommé co-chef des placements aux côtés de M. Baker. Ils se partagent ainsi la responsabilité de la stratégie d’actions, de la gestion des portefeuilles et de l’orientation globale des placements. En 2027, Michael occupera le poste de chef des placements, tandis que Gary passera à un rôle-conseil, assurant ainsi la continuité, le mentorat et une transition harmonieuse. Michael s’est joint au conseil d’administration de CC&L en 2026, succédant à Gary.

Photo de Michael McPhillips  Photo de Gary Baker

Stratégies quantitatives d’actions

L’année 2025 a été solide pour l’équipe des Stratégies quantitatives d’actions. L’équipe a atteint ou dépassé les objectifs de valeur ajoutée dans l’ensemble de ses stratégies clés, s’appuyant sur des antécédents de rendement à long terme éprouvés, avec une croissance soutenue de la clientèle et des actifs sous gestion. Pour soutenir cette croissance, l’équipe a continué d’accroître ses capacités, passant à 92 membres, avec 21 nouveaux employés en 2025. Des professionnels en placement ont été ajoutés à l’ensemble des sous-équipes au cours de l’année, et les investissements dans les ressources de leadership des sous-équipes se poursuivront à un rythme semblable cette année. La croissance soutenue de l’équipe témoigne de la nécessité d’élargir et de réinvestir continuellement dans nos capacités, puisque la taille et la portée des activités de gestion quantitative ont augmenté. Par ailleurs, l’accent est demeuré mis sur la mise en œuvre de points de vue différenciés, avec une mise à jour du modèle de placement qui a été déployée avec succès en novembre.

Afin de soutenir les clients sur les marchés internationaux, nous avons élargi la structure de nos fonds en gestion commune. Cela comprend notre plateforme de fonds OPCVM établie en Europe et destinée aux investisseurs non américains, une plateforme de fiducie de placement collectif (CIT) aux États-Unis destinée aux régimes de retraite réglementés par l’ERISA, une plateforme aux îles Caïmans pour les investisseurs américains et d’autres investisseurs mondiaux admissibles, et une plateforme de fonds de sociétés en commandite pour les investisseurs américains admissibles. Cet investissement nous permettra de servir une clientèle plus vaste.

Solutions clients

Conformément à la croissance de nos activités, l’équipe des Solutions clients a continué de croître. Tim Elliott s’est joint à l’équipe en juin. Il occupait auparavant le poste de président et chef de la direction de Fonds Connor, Clark & Lunn Inc., une filiale spécialisée dans la gestion de patrimoine pour les particuliers qu’il a fondée au sein du Groupe financier CC&L il y a 15 ans. Tim a immédiatement eu une incidence positive sur nos activités, en apportant ses analyses et son expertise des marchés des services aux particuliers et de la gestion de patrimoine, et en renforçant le leadership au sein de l’équipe. Il est devenu actionnaire en 2026.

Investissement responsable

L’année 2025 marquait le passage d’une décennie depuis la création du comité ESG de CC&L. Par conséquent, notre conseil d’administration a jugé approprié d’entreprendre un examen du mandat et de la structure de gouvernance du comité. Le résultat de cet engagement a permis de confirmer que nous conservons la structure et les ressources appropriées pour atteindre nos objectifs en matière d’investissement responsable et de conclure qu’aucun changement important n’était justifié.

Nouvelles de l’entreprise

Actif sous gestion

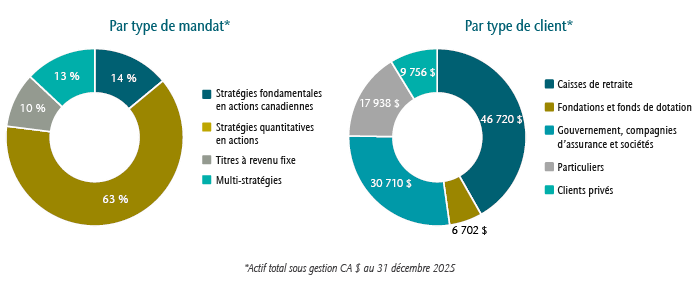
L’actif sous gestion de CC&L a augmenté de 35 milliards de dollars canadiens en 2025 pour s’établir à 112 milliards de dollars canadiens au 31 décembre 2025. Nous sommes heureux d’annoncer que notre activité s’est développée grâce aux mandats de nouveaux clients répartis dans toutes les équipes de placement. En 2025, CC&L a accueilli plus de 100 nouveaux clients et a obtenu 19 mandats supplémentaires de la part de clients existants. La plupart des nouveaux mandats visaient des stratégies quantitatives d’actions pour des investisseurs institutionnels mondiaux.

Image représentant deux diagrammes circulaires. Par type de mandat*. Actions fondamentales : 14 %. Actions quantitatives : 63 %. Titres à revenu fixe : 10 %. Stratégies multiples : 13 %. Par type de client*. Caisses de retraite : 46 720 $. Fondations et fonds de dotation : 6 702 $. Administrations publiques, compagnies d’assurance et entreprises : 30 710 $. Particuliers : 17 938 $. Clientèle privée : 9 756 $. *Total des actifs sous gestion en dollars canadiens au 31 décembre 2025.

Nous sommes fiers de recevoir le prix Coalition Greenwich 2025 : Meilleur gestionnaire d’actifs pour les investisseurs institutionnels au Canada*. Ce prix reflète l’excellence pour ce qui est du rendement des placements et du service à la clientèle, selon l’indice de qualité Greenwich.

Mot de la fin

Nous sommes sincèrement reconnaissants de la confiance et du soutien de nos clients et partenaires d’affaires. Nous avons hâte de continuer à vous aider à atteindre vos objectifs de placement au cours des prochaines années.

* Tout au long de 2025, Crisil Coalition Greenwich a mené des entrevues auprès de 147 des plus grands régimes de retraite privés et publics, institutions financières, fonds de dotation et fondations au Canada et dans d’autres régions du monde. On a demandé aux principaux spécialistes de fonds de fournir des évaluations détaillées de leurs gestionnaires de placement, des évaluations des gestionnaires qui sollicitent leurs affaires et des renseignements sur les tendances importantes du marché. Gestion de placements Connor, Clark & Lunn n’a versé aucune rémunération à Crisil Coalition Greenwich pour ce sondage.

Closeup of a person pumping gasoline fuel in their car at gas station.

In-depth macro analysis has always been a cornerstone of this process, based on an understanding that emerging markets are highly sensitive to macro shocks which can overwhelm ostensibly solid company fundamentals. The outbreak of conflict following US and Israeli strikes to take out the Iranian regime is one such event, and has sparked violent moves in markets. Our macroeconomic analysis and risk controls are crucial in helping to navigate a volatile environment.

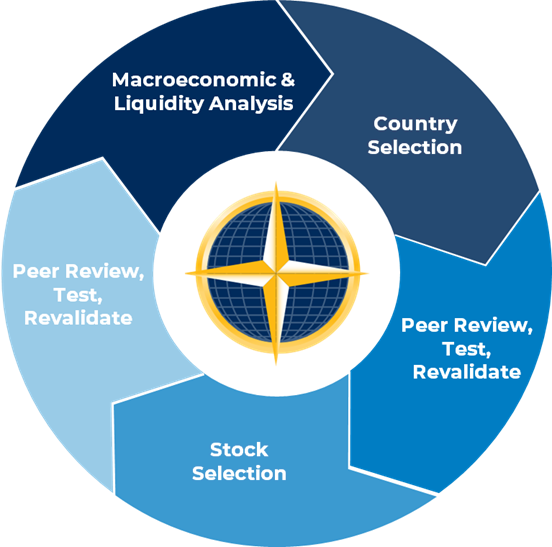
The approach to macroeconomic analysis here is disciplined and incremental, and does not involve the type of Hail Mary calls (i.e., speculating on President Trump’s war aims) that get market pundits invitations onto Bloomberg and CNBC. Our approach to forming a top-down view of our markets is to mark the direction of travel, whether it be our monetary indicators or more qualitative factors such as politics and institutional quality. We marshal all of these data points into one number which rates the level of conviction for a country with 1 being the highest level of conviction corresponding with a maximum overweight (key caveat: provided we can find the right stocks that fit our process), and 5 being lowest (meaning no exposure at all). As the data changes, we will tweak that level of conviction, which should be tightly aligned with adjustments made in the portfolio.

This work is designed to help us understand how the investment environment is changing through cycles, structural change and theme-driven liquidity. Through this context, we can get a sense of what types of businesses are likely to be rewarded in a given environment and adjust the portfolio accordingly.

Test and re-test

We are big subscribers to the insights of psychologist and writer, Phillip Tetlock, who is an expert on forecasting. His studies found that the best long-term forecasters are those who are able to make probabilistic estimates, calibrate, learn and update beliefs frequently. They make many small corrections to their analysis as fresh data arrives, which leads to better long-run accuracy than rigid “set and forget” predictions. This is the forecasting approach we adopt in both our macro and company analysis, illustrated in our process diagram below.

NSP_COMM_2026-03-11_Chart01

Through periods of high uncertainty and violent market moves like what we have currently, we lean heavily into this OODA (Observe, Orient, Decide, Act) Loop. This involves a constant testing and re-testing of our macro views and investment hypotheses, and tweaking of the portfolio as conditions change.

Example: lifting oil exposure

Moving from being zero weight in oil companies at the start of 2026 to equal weight (and with more beta to oil than the index) by the end of February is one example of how iterative tweaks in our macro analysis left the portfolio in a better position to weather the events of early March.

Towards the end of last year, one of the most debated topics of discussion in the team was our heavy underweight to the energy sector and, in particular, oil. Our only energy holding at the end of 2025 was uranium miner CGN.

While we remain structurally cautious about oil’s long-term investment prospects, from a portfolio risk perspective we became concerned that having no oil exposure had turned into a crowded consensus trade – especially as weak prices began to squeeze US shale production. This alongside news of a US naval build up in the Persian Gulf, Arabian Sea and Eastern Mediterranean early in the year suggested the portfolio was exposed to risk of a geopolitical shock in the region. Through January and February, we gradually lifted our oil exposure from zero to an equal weight of over 3.5%.

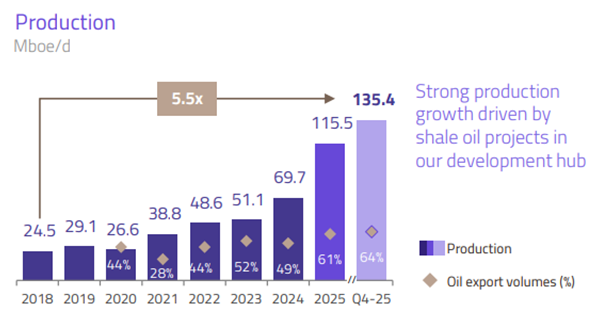
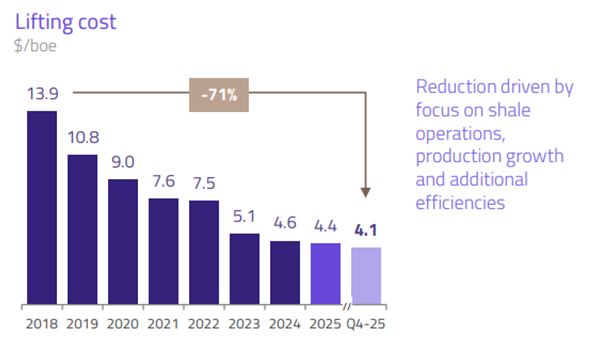
While our macro and risk analysis helped to identify a potential vulnerability, we could not know that conflict was about to break out in early March and drive such a dramatic hike in the price of oil. It was not a case of just adding oil beta to the portfolio. We added Argentinian shale oil producer Vista Energy and Petrochina based on their healthy returns on invested capital sustainable even through weak pricing environments, underpinned by growing production profiles, capital discipline and low lifting costs.

Vista Energy: Production growth and falling lifting costs driving earnings growth
NSP_COMM_2026-03-11_Chart02
NSP_COMM_2026-03-11_Chart03
NSP_COMM_2026-03-11_Chart04
Source: Vista Energy Investor Relations 2026

The lift to oil exposure was timely, helping to preserve relative gains made this year despite sharp drawdowns in other winning positions that had been hit by broad risk-off sentiment.

Where to from here?

We rated the global monetary backdrop as modestly supportive coming into this shock, largely reflecting favourable trends in EM. However, we have been expecting the global stockbuilding cycle to turn down during 2026, giving us a bias to increase defensive positioning at the margin, especially on any signs of monetary weakness.

The energy price spike, unless swiftly reversed, will push up inflation and squeeze real money growth. It is leading to a revision of expectations for central bank policies, which may dampen nominal money growth. Nominal money trends are also at risk from recent tightening in US private credit conditions, which the current shock may exacerbate.

We are cautious and do not expect the negative effects of this shock will be swift to reverse, so our inclination is to add to defensive positioning on any rally, rather than to view current market weakness as a buying opportunity.