After decades of offshoring, companies are increasingly building capacity closer to end markets. This nearshoring trend has triggered a surge in new factories, warehouses and intermodal terminals. The world is entering a new phase of industrial investment as countries rebuild supply chains, renew critical infrastructure and accelerate the shift to cleaner logistics. Manufacturing nearshoring, port electrification and large-scale public infrastructure programs are reshaping industrial demand.
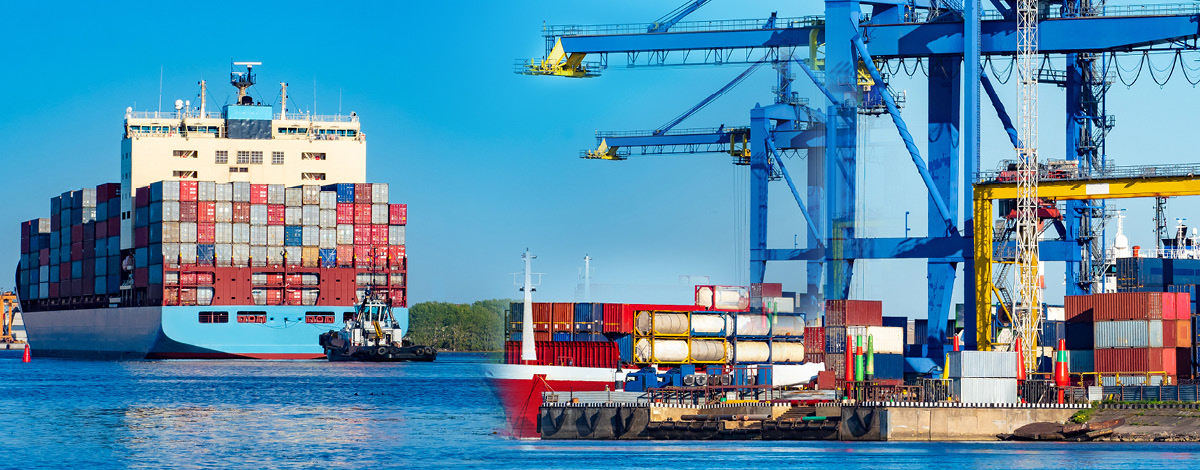
Governments are deploying significant stimulus toward infrastructure modernization. The U.S. Infrastructure Investment and Jobs Act, Europe’s Green Deal programs and national port renewal projects all call for automation and emissions reduction in logistics. Port operators, for example, are increasingly replacing diesel-powered cranes with hybrid or fully electric units, a market where Konecranes is already a technology leader.
Among the beneficiaries from that multi-year capex cycle stands Konecranes (KCR FH), the Finnish leader in lifting equipment and services, positioned at the crossroads of automation and reindustrialization. Konecranes is one of our holdings in our International Small Cap Strategy.
As one of the largest global players in its niche, Konecranes benefits from scale-driven pricing power, a broad installed base and a growing stream of recurring service revenue. Its service segment, representing about 40% of group sales, generates EBITA margins above 20% – roughly double those of new equipment – thanks to long-term maintenance contracts and critical spare-parts sales that are largely price inelastic. The company services more than 600,000 cranes worldwide, leveraging its digital platform for predictive maintenance and uptime analytics. This connectivity creates high customer switching costs and allows for value-based pricing rather than cost-based competition.
Scale also enhances resilience. Through years of acquisitions and regional integrations, Konecranes has consolidated a fragmented market, broadening its service reach across 120 countries and multiple industries. This global footprint enables it to spread R&D, logistics and data infrastructure over a larger customer base while improving service response times – a key differentiator versus smaller peers. Moreover, the company’s ability to bundle equipment, parts and digital services strengthens customer relationships and supports long-term contracts that are difficult for competitors to displace.
Equipment downtime can be very costly for customers. For Konecranes, this translates into pricing leverage and high renewal rates on service agreements. The inelastic nature of maintenance pricing, combined with the company’s deep integration into clients’ safety and compliance frameworks, provides durable margins and steady cash flow. Over time, Konecranes’ mix shift toward services and automation has driven operating margins from 7% to over 13% in five years, positioning it among the more profitable industrial equipment consolidators globally.
Konecranes combines a diversified portfolio with a clear strategy centred on electrification, automation and data-driven service. This balance provides resilience across economic cycles while capturing long-term secular growth from reindustrialization and infrastructure renewal. We believe Konecranes is well placed to capture these structural tailwinds. Its technological leadership, digital service model and exposure to automation-driven capital expenditure make it a key indirect beneficiary of the ongoing industrial transformation.