Monetary trends suggest that China’s economy is better placed to withstand tariff damage than Japan’s.

Chinese six-month real narrow money momentum rose further in March, reaching its highest level since August 2020. Japanese momentum moved deeper into contraction – see chart 1. (US March numbers will be released next week, with Eurozone / UK data the following week.)

Chart 1

Real narrow money (% 6m).

Inflation divergence has contributed to the wide gap but it mainly reflects nominal money trends: Japanese narrow money is contracting even in nominal terms.

The Japanese fall is partly explained by money-holders switching out of sight deposits (included in narrow money) into time deposits (excluded), which now pay modest interest. Still, broad money trends are also weak: M3 grew by just 0.5% at an annualised rate in the six months to March. Broad money expansion has been dragged down by BoJ QT and a fall in bank lending to non-bank financial corporations.

By contrast, six-month growth of Chinese broad money – on the preferred definition here excluding deposits held by financial institutions – was stable in March at a level close to the 2015-19 average. This pace was associated with solid nominal GDP expansion – chart 2.

Chart 2

China nominal GDP* (% 2q) & money / social financing* (% 6m). *Own seasonal adjustment.

Broad money trends have been supported by PBoC and state bank purchases of government bonds issued to finance fiscal stimulus measures. In addition, six-month growth of bank lending has revived recently, despite a drag from debt swap operations (under which funds raised through bond issuance are used to repay bank loans of government-related entities).

Previous posts suggested that Japanese monetary weakness would be reflected in downside economic and inflation surprises. The composite PMI output index fell sharply last month, to well below levels in the US, Eurozone, UK and China.

Annual growth of scheduled earnings, meanwhile, undershot expectations in February. Inflation believers have been relying on a developing wage-price spiral but bumper headline pay awards in the spring Shunto may not be representative of trends across the whole economy – chart 3.

Chart 3

Japan scheduled earnings (% yoy) & agreed rise in base pay in Spring Shunto.

Automated smart robot arm system for innovative warehouse and factory manufacturing.

The stock market experienced significant volatility last week due to escalating trade tensions following President Donald Trump’s announcement of new tariffs aimed at reducing the US trade deficit. These tariffs were implemented on April 2, 2025 – a day referred to as « Liberation Day » – leading to widespread market reactions across developed markets globally.

The technology sector for both large and small caps were among the sectors most adversely affected during this period. Technology stocks faced substantial declines, with companies like Tesla and Nvidia experiencing drops of 36% and nearly 20% respectively, over a two-day span. Industrials and consumer discretionary also suffered notable losses, as companies within these industries are often sensitive to trade policies and global economic conditions.

In contrast, defensive sectors such as consumer staples, healthcare and utilities showed resilience. These sectors tend to be less sensitive to economic cycles and trade fluctuations, providing a buffer during periods of market volatility.

The new US tariffs could reduce global GDP growth by 50 bps, with a 100-150 bp drag on US growth, a 60 bp drag on Asian growth and a 40-60 bp drag on Euro-area growth. It is expected the US administration will negotiate country-specific comprehensive packages involving trade, defense, energy and immigration. The aim is de-escalation in the global trade war over the coming weeks and months, though negotiations with China will likely prove difficult, given the geopolitical tensions between the two countries.

Global Alpha will continue to monitor the effect of tariffs on the companies it is invested in. From supply chain to end consumer, the ripple effects are multi-factor dependent. Can production relocate? Is it a service or a good?  Where are competitors located? Can the buyers absorb the price increase? And ultimately, what is the demand destruction?

The length of tariffs is also unknown as we recently saw with Vietnam which offered to remove tariffs less than 48 hours post Liberation Day. Nike re-couped half its losses on the announcement.

Presently, our largest exposure to tariffs is the aluminum company Alcoa Corp. (AA US) with 50% of its Canadian production destined to the United States with no real US substitution. The company estimates that a car price tag will increase by $1200 from aluminum alone. If tariffs persist, on-shoring plans could re-surge.

On-shoring will continue to accelerate whether tariff induced or not. Political tensions are only increasing and productivity will continue to rise and automate. In fact, we may be on the verge of one of the largest productivity gains in recent times through the realization of a theme society has dreamt of for a long time: humanoid robotics.

In our discussion with companies, we can start seeing mid- to near-term plans to use humanoid robots. Tesla’s development plans for the Optimus humanoid robot begins with progression of human-superior autonomous driving by Q4 2025 (sensorial decision making). Following that step would be the replication of that technology in humanoid robots. The first launches of the Optimus Robot in the logistics sector are planned for Q1 2026. With this plan, it is easy to imagine Mr. Musk telling President Trump that his industrial labour shortages will be solved in the mid-to-long term.

The global humanoid robot market size was valued at USD 2.4 billion in 2023 and is projected to grow from USD 3.3 billion in 2024 to USD 66.0 billion by 2032, exhibiting a CAGR of 45.5% during the forecast period. Asia Pacific dominated the humanoid robot market with a share of 42.0% in 2023.

The wheel-drive version (versus biped) segment held the highest market share of 65.6% in 2024 and an even higher market share in real-use cases; the biped is still in its infancy when addressing performance.

In 2022, Elon Musk suggested that the Optimus robot could eventually be priced at around $20,000 to $30,000 per unit when mass production begins. This price range is based on Musk’s vision for the robot to be affordable, allowing widespread adoption and possibly replacing some human labour in industries like manufacturing, logistics and even home use.

The Optimus robot is designed to resemble a human in both appearance and movement. It stands 5’8” tall (around 173 cm) and weighs about 125 lbs (approximately 57 kg).

Global Alpha is a shareholder of GXO Logistics Inc. (GXO US)

GXO is a global leader in supply chain solutions and logistics services. The company focuses on providing advanced logistics capabilities for customers across a variety of industries, including retail, e-commerce, consumer goods, automotive and technology. GXO operates with a strong emphasis on innovation and technology, aiming to enhance efficiency, optimize operations and improve customer service through automation, robotics and artificial intelligence.

Today, GXO is a leader in the implementation of traditional robots like autonomous mobile robots (AMRs) or robotic arms. However, the company is likely to continue exploring humanoid robots as the technology evolves.

Key areas of GXO:

  1. Warehouse management: GXO operates large-scale, automated warehouses that utilize sophisticated technology to manage inventory, order fulfillment and distribution. This includes the use of robotics, AI and data analytics to improve efficiency and accuracy in managing supply chains.
  2. E-commerce fulfillment: GXO specializes in providing logistics services for e-commerce companies, including fast order processing, picking, packing and last-mile delivery solutions.
  3. Transportation and distribution: The company offers end-to-end transportation management services, optimizing routes and using data-driven systems to improve fuel efficiency, delivery time and cost-effectiveness.
  4. Cold chain logistics: GXO also manages cold storage and temperature-sensitive goods, offering specialized logistics solutions for food, pharmaceuticals and other perishable products.

GXO is exploring humanoid robots for:

  1. Assistive tasks in warehouses: Humanoid robots are being developed with the potential to assist in warehouses with tasks that require human-like dexterity and mobility. They could perform tasks like sorting, packaging and even delivering materials across different sections of a warehouse.
  2. Customer service: Humanoid robots might also be used in customer-facing roles within logistics operations. For instance, they could assist with customer queries or provide support in retail environments where GXO provides fulfillment services.
  3. Human-robot collaboration: GXO, like other companies in the logistics and supply chain sector, is likely to focus on robots that complement human workers rather than replace them entirely. Humanoid robots can be deployed in environments where human workers are still essential, but can be augmented by automation to handle repetitive or physically demanding tasks.

Global Alpha also owns Kerry Logistics Network Limited (636 HK)

Kerry Logistics is a Hong Kong-listed third-party logistics (3PL) provider offering a comprehensive range of supply-chain solutions. Their services include integrated logistics, international freight forwarding (air, ocean, road, rail and multimodal), industrial project logistics, cross-border e-commerce, last-mile fulfillment and infrastructure investment. With a presence in 59 countries and territories, Kerry Logistics has established a solid foothold in many of the world’s emerging markets. ​

Incorporating robotics into their operations has significantly enhanced Kerry Logistics’ efficiency and profitability. For instance, in 2023, they implemented the « KOOLBee » sorting robots across facilities in Hong Kong, Tianjin and Dongguan. These intelligent and flexible robots increased overall sorting productivity by 270%, enabling the company to meet the growing demands of fashion e-commerce fulfillment. ​

Additionally, in 2021, Kerry Logistics introduced « KOOLBotic » robotic arms dedicated to cold chain logistics in the food and beverage industry. These robotic arms improved sorting productivity by 20% and allowed operations to run 20-hour shifts in low-temperature environments, effectively reducing human contact during the pandemic. ​

By integrating such robotic solutions, Kerry Logistics has not only boosted operational efficiency but also enhanced its capacity to handle large volumes and meet customer expectations, thereby positively impacting profitability.

Although we are excited by the prospect of humanoid robots, the early stages of the technology keeps us from integrating their commercial viability in our financial assumptions.  It is a question of “when,” not “if.” These themes continue to provide us with opportunities and earnings growth in our investment universe.

Global money growth has picked up since late 2024 but remains subdued, while the stock of money is no longer in excess relative to nominal economic activity and asset prices. The monetary backdrop, therefore, appears insufficiently supportive to offset economic / market damage from US-led tariff hikes.

Prospective tariff effects, meanwhile, require a revision to the previous forecast here of a downside global inflation surprise in 2025 related to extreme monetary weakness in 2023. A price level boost this year is unlikely to yield second-round effects given disinflationary monetary conditions, so a near-term lift to annual inflation should reverse in 2026. The effect may be to extend the lag between the money growth low of 2023 and the associated inflation low from two to three years.

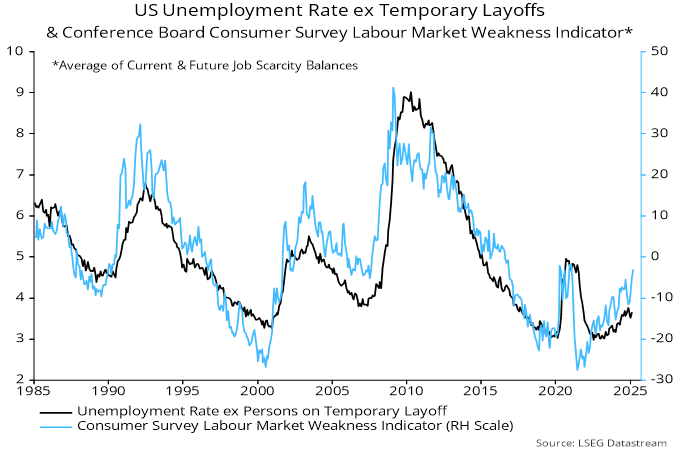
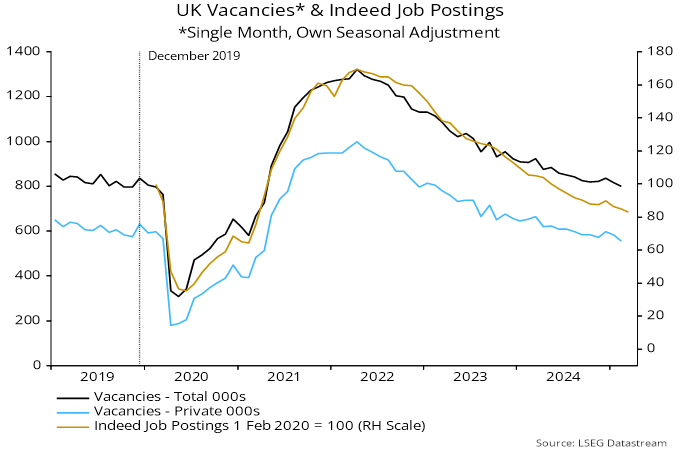
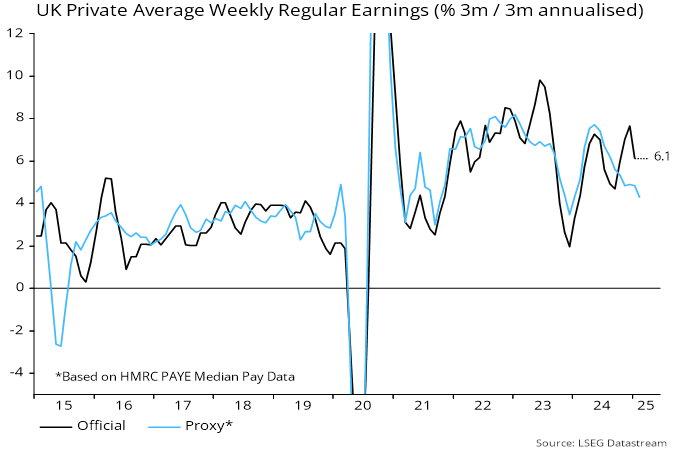
The elimination of a surplus stock of money has been mirrored by erosion of excess labour demand, with job openings / vacancy rates mostly now around or below pre-pandemic levels. Economic weakness, therefore, may be reflected in a rise in unemployment that eventually dominates central bank concerns about inflationary tariff effects, suggesting that current policy caution will give way to renewed easing later in 2025.

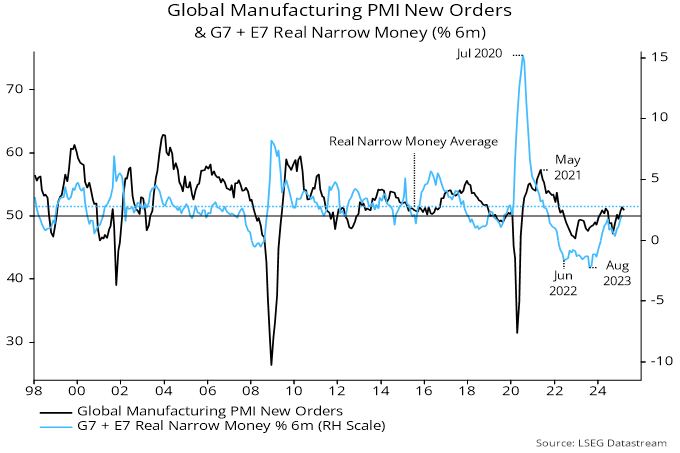
Global six-month real narrow money momentum – the key monetary leading indicator followed here – fell between June and October 2024 but has since rebounded, reaching a post-pandemic high in February. (The timing of the mid-2024 dip has changed slightly from previous posts, mainly reflecting annual revisions to seasonal adjustment factors for US monetary data.) Real money momentum, however, remains below its long-run average – see chart 1.

Chart 1

020425c1

The lead time between real money momentum and manufacturing PMI new orders has averaged 10 months at the four most recent turning points. Based on this average, the 2024 real money slowdown and subsequent reacceleration suggest a PMI relapse in Q2 / Q3 followed by renewed strength in late 2025 – chart 2.

Chart 2

020425c2

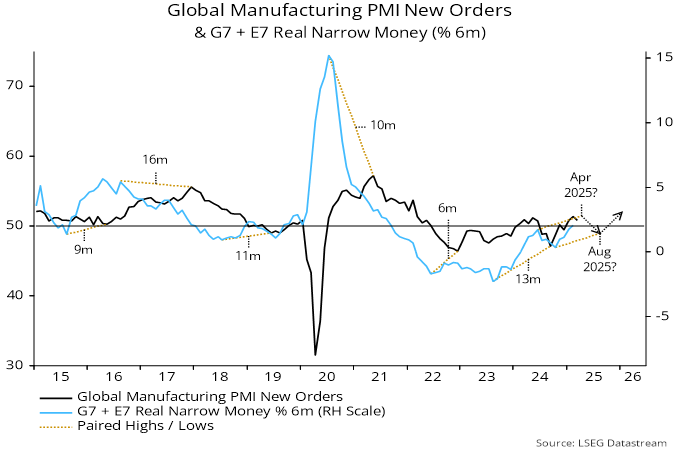
Tariff effects – including payback for a front-loading of trade flows – are likely to magnify mid-year economic weakness and could push out or even abort a subsequent recovery: delayed central bank easing, a confidence hit to business / consumer credit demand and a near-term inflation lift could reverse the recent pick-up in real money momentum.

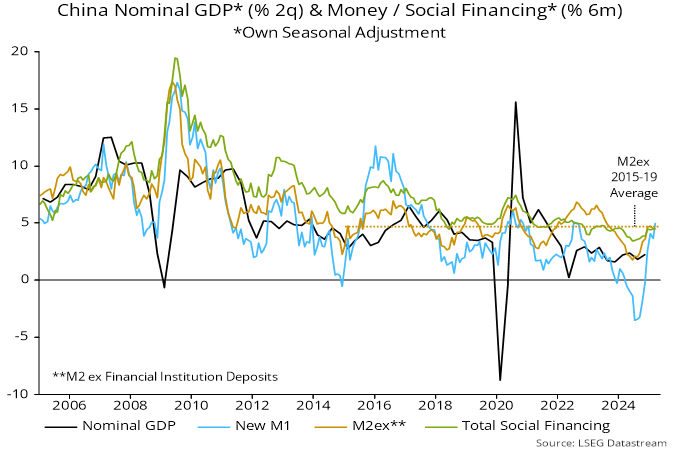
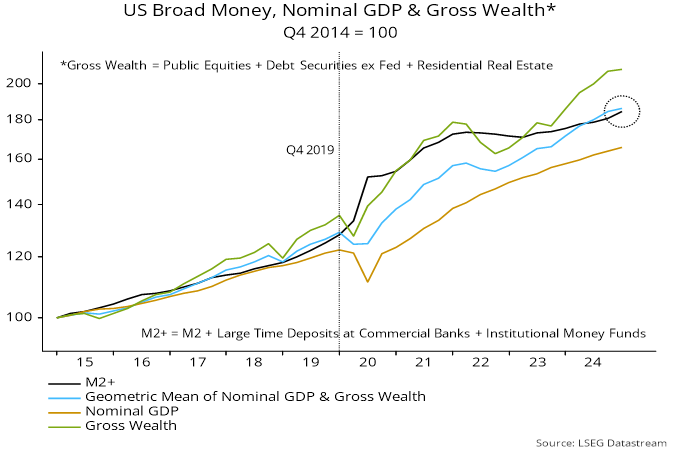
Previous posts, meanwhile, argued that stocks of (broad) money in the US, Japan and Eurozone are no longer higher than warranted by prevailing levels of nominal economic activity and asset prices, implying an absence of a monetary “cushion” against negative shocks. Excess money appears to be substantial in China but could remain frozen as US trade aggression and domestic policy caution sustain weak business / consumer confidence.

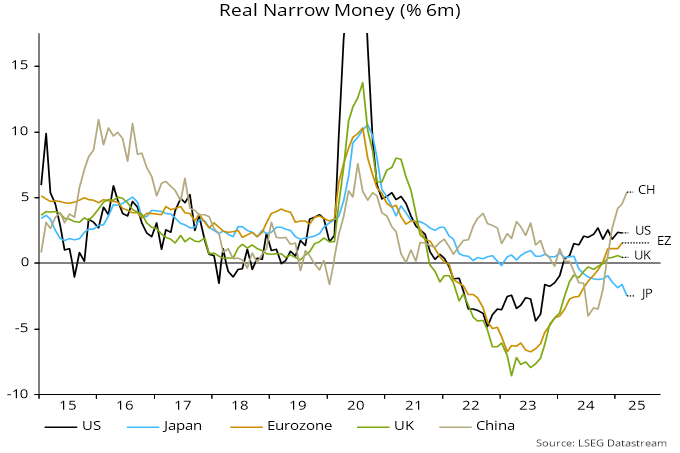
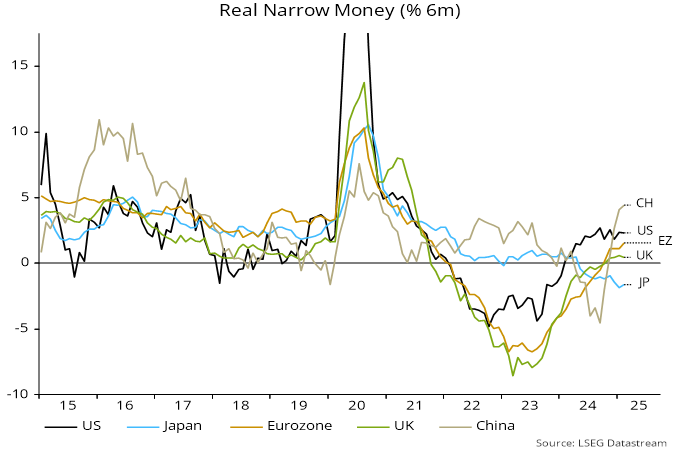
Chart 3 shows six-month real narrow money momentum in major economies. Chinese strength is a stand-out but may partly reflect payback for earlier weakness – momentum needs to remain solid to warrant continued (relative) optimism. A Eurozone recovery still leaves momentum lagging the US (where revised numbers show less of a recent slowdown), with the UK further behind. Japanese weakness is alarming, suggesting significant downside economic / inflation risk and consistent with recent lacklustre equity market performance.

Chart 3

020425c3

European economic optimism has been boosted by a relaxation of German fiscal rules and a wider drive to increase defence spending. This is significant for medium-term prospects but has limited relevance for the near-term economic outlook, which hinges on whether an uplift from monetary easing will prove sufficient to offset trade war damage.

The two flow indicators of global “excess” money followed here are giving a mixed message: six-month growth of real narrow money has crossed above that of industrial output (positive) but 12-month growth remains below a long-term moving average (negative). This combination was associated with global equities slightly underperforming US dollar cash on average historically.

From a cyclical perspective, a key issue is whether the US tariff war shock brings forward peaks and downswings in the stockbuilding and business investment cycles, which are scheduled to reach lows in 2026-27 and 2027 or later respectively. The previous baseline here was that upswings in the two cycles would extend into 2026, a scenario supported by the current monetary signal of a rebound in economic momentum in late 2025.

The next downswings in the two cycles are likely to coincide with a move of the 18-year housing cycle into another low. Triple downswings are usually associated with severe recessions and financial crises. Such a prospect is probably still two years or more away but the US policy shock may have closed off the possibility of a final boom leg to current upswings before a subsequent crash.

Table 1 updates a comparison of movements in various financial assets so far in the current stockbuilding upswing (which started in Q1 2023) with averages at the same stage of the previous eight cycles, along with changes over the remainder of those cycles. Three months ago, US equities, cyclical sectors, the US dollar and precious metals were performing much more strongly than average, suggesting downside risk. By contrast, EAFE / EM equities, small caps and industrial commodities appeared to have catch-up potential.

Table 1

020425t1os

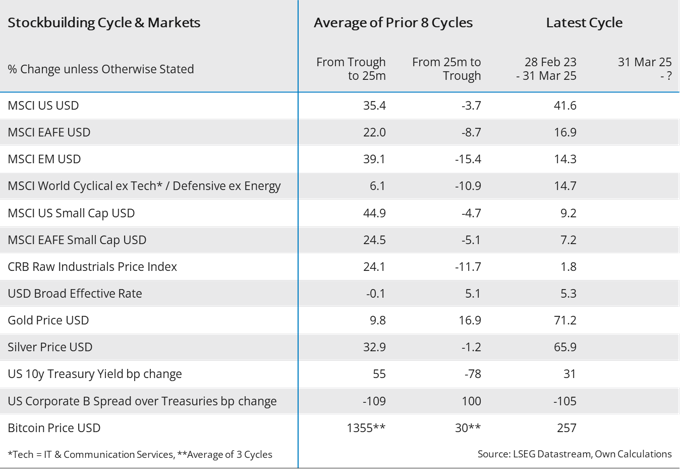
Q1 moves corrected some of these anomalies, with the US market falling back, Chinese / European equities performing strongly, US cyclical sectors lagging, the dollar falling and industrial commodity prices recovering. Precious metals, however, became even more extended relative to history, while small cap performance has yet to pick up.

The updated table suggests potential for further strength in EM and to a lesser extent EAFE equities, along with industrial commodities. Cyclical sector underperformance and dollar weakness could extend, while gold / silver appear at high risk of a correction. The larger message, however, is that, even assuming a delayed peak, the stockbuilding cycle has entered the mid to late stage that has been unfavourable for risk assets historically.

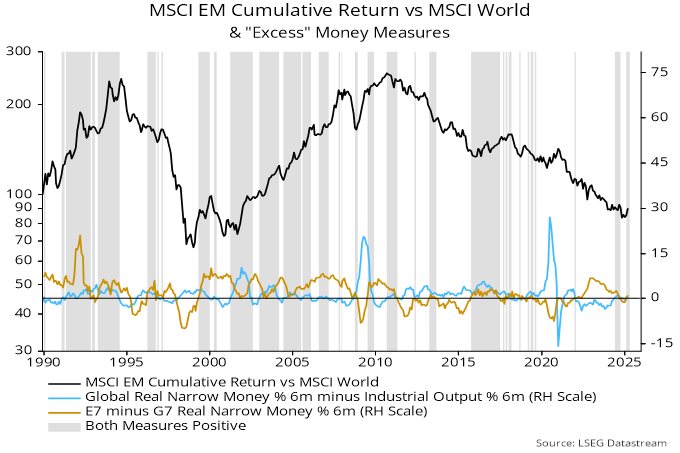
The suggestion of EM outperformance is supported by monetary considerations. Six-month real money momentum is stronger in the E7 large emerging economies than in the G7, while – as noted earlier – global real money is outpacing industrial output. EM equities beat DM on average historically when these two conditions were met, underperforming in other regimes – chart 4.

Chart 4

020425c4

Vue panoramique du quartier financier du centre-ville de Toronto, près de l'intersection de Bay et King.

Fonds Connor, Clark & Lunn Inc. (« Fonds CC&L ») a le plaisir de faire une mise à jour sur deux fonds alternatifs liquides : le lancement du Fonds d’opportunités ciblées PCJ et le changement de nom du Fonds alternatif de revenu CC&L, qui devient le Fonds d’obligations à rendement absolu CC&L (collectivement, les « Fonds »).

Fonds d’opportunités ciblées PCJ

Le nouveau Fonds d’opportunités ciblées PCJ s’inspire d’une stratégie institutionnelle existante qui vise à offrir un profil de croissance à long terme attrayant en prenant des positions acheteur et vendeur sur des actions nord-américaines. Ce fonds opportuniste intègre bon nombre des mêmes thèmes et positions que l’actuel Fonds de rendement absolu PCJ II; or, n’étant pas assujetti à l’exigence de devoir être neutre vis-à-vis du marché, il est en mesure de poursuivre des rendements plus élevés. Le gestionnaire de portefeuille est PCJ Investment Counsel Ltd. (« PCJ »). Cote de risque : moyenne.

« Bien que les fonds alternatifs liquides soient encore une structure relativement nouvelle, notre équipe de placement de PCJ gère avec succès des stratégies alternatives depuis 15 ans dans différentes conditions de marché. « Avec notre Fonds d’opportunités ciblées PCJ, notre équipe cherche à produire des rendements à long terme semblables à ceux des actions, mais avec une corrélation moins forte et des baisses moins marquées, a indiqué Tim Elliott, président et chef de la direction des Fonds CC&L. « Nous estimons que le lancement de ce fonds arrive à point nommé, car les investisseurs en actions font face à des valorisations élevées et à un possible ralentissement de la croissance économique. Pour les investisseurs qui souhaitent diversifier leur exposition aux actions sans réduire le rendement attendu, nous considérons ce fonds comme la solution idéale. »

Fonds d’obligations à rendement absolu CC&L

Le Fonds d’obligations à rendement absolu CC&L, anciennement Fonds alternatif de revenu CC&L, s’inspire aussi d’un portefeuille institutionnel existant, qui utilise trois stratégies de rendement absolu de titres à revenu fixe uniques et complémentaires dans le but d’obtenir des rendements ajustés au risque attrayants tout en étant faiblement corrélé avec les portefeuilles d’obligations conventionnels. Le gestionnaire de portefeuille est Gestion de placements Connor, Clark & Lunn Ltée (« Gestion de placements CC&L »). Cote de risque : faible à moyenne. « Les données sur les flux de capitaux montrent que les investisseurs individuels auraient considérablement augmenté leur exposition aux titres de créance de sociétés ces dernières années. Notre Fonds d’obligations à rendement absolu CC&L offre une solution aux investisseurs qui cherchent à réduire leur exposition/risque à un moment où les écarts de taux, comme les actions, sont assez élevés, sans réduire le rendement attendu des titres à revenu fixe, a souligné Tim Elliott.

Équipes de placement spécialisées, organisation solide et stable

Fonds CC&L, Gestion de placements CC&L et PCJ sont des sociétés affiliées de Groupe financier Connor, Clark & Lunn Ltée (« Groupe financier CC&L »), dont la structure à multiples sociétés affiliées réunit les talents d’équipes de placement diversifiées qui offrent une vaste gamme de solutions de placement traditionnelles et non traditionnelles. Groupe financier CC&L est l’un des plus importants gestionnaires de placements indépendants au Canada; il gère plus de 139 milliards de dollars d’actifs pour le compte d’investisseurs institutionnels et particuliers.

À propos des Fonds

Proposant des parts de série A et de série F, les Fonds sont conformes au cadre réglementaire des fonds communs de placement alternatifs et sont offerts par voie d’un prospectus simplifié. Les parts des Fonds sont vendues par l’intermédiaire de courtiers en placement titulaires d’un permis; leur prix est évalué quotidiennement et elles peuvent être remboursées quotidiennement. Les Fonds sont offerts au moyen de FundServ.

À propos de Fonds Connor, Clark & Lunn Inc.

Fonds Connor, Clark & Lunn Inc. noue des partenariats avec des institutions financières canadiennes de premier plan et leurs conseillers en placement afin d’offrir des stratégies de placements institutionnelles uniques à des investisseurs particuliers, grâce à une gamme de fonds, de placements alternatifs liquides et de comptes en gestion distincte choisis avec soin. En limitant leur gamme à un groupe de solutions de placement précises, les Fonds CC&L sont en mesure d’offrir des stratégies uniques conçues pour améliorer les portefeuilles traditionnels des investisseurs. Pour de plus amples renseignements, consultez le site www.cclfundsinc.com/fr/.

À propos de Gestion de placements Connor, Clark & Lunn Ltée

Gestion de placements Connor, Clark & Lunn Ltée est l’une des plus importantes sociétés de gestion de placements indépendantes au Canada (elle appartient à ses associés) et gère un actif de 76 milliards de dollars. Fondée en 1982, elle propose une gamme diversifiée de solutions de placements traditionnels (actions, titres à revenu fixe et placements équilibrés) et non traditionnels (stratégies neutres au marché, à alpha portable et à rendement absolu). Pour de plus amples renseignements, consultez le site www.cclinvest.com/fr/.

À propos de PCJ Investment Counsel Ltd.

Fondée en 1996, PCJ Investment Counsel Ltd. est une société privée indépendante de gestion de placements, qui se concentre sur les actions canadiennes à grande et à petite capitalisation ainsi que sur les placements non traditionnels, dont les actions neutres au marché et les stratégies de positions acheteur et vendeur. Forte d’un actif sous gestion total d’environ 1 milliard de dollars, la société dispose d’une équipe de gestion de portefeuille stable et expérimentée, qui se concentre sur la recherche et l’exploitation d’occasions de placement uniques ainsi que sur la construction de portefeuilles présentant des caractéristiques de risque et de rendement intéressantes. Pour obtenir de plus amples renseignements, veuillez consulter le site www.pcj.ca.

À propos de Groupe financier Connor, Clark & Lunn Ltée

Groupe financier Connor, Clark & Lunn Ltée est une société de gestion d’actifs indépendante à multiples sociétés affiliées qui offre une vaste gamme de solutions de gestion de placements traditionnelles et non traditionnelles aux investisseurs institutionnels et individuels. Cette structure procure au Groupe financier CC&L une envergure et une expertise considérables qui lui permettent d’assumer des fonctions administratives qui ne sont pas liées aux placements tout en laissant ses gestionnaires de placement se concentrer sur ce qu’ils font le mieux grâce à la centralisation des activités liées aux opérations et à la distribution. Les sociétés affiliées du Groupe financier CC&L gèrent un actif de plus de 139 milliards de dollars. Pour obtenir de plus amples renseignements, consultez le site www.cclgroup.com/fr/.


Personne-ressource

Joanna Lewis, CIM
Associée, Produits et service à la clientèle
Fonds Connor, Clark & Lunn Inc.
416 365 5296
[email protected]

GACM_COMM_2025-03-27_Banner

In early March, our emerging markets team traveled to Jakarta, Indonesia. Given the political transition following the presidential election last year and ongoing macroeconomic headwinds, we sought to assess the market firsthand. For bottom-up investors, Indonesia has long been one of the most promising equity markets in Emerging Asia, and despite near-term challenges, we continue to see compelling long-term investment opportunities.

Jakarta can be a difficult city to navigate, but with the onset of Ramadan, the usual congestion was noticeably lighter, allowing us to efficiently move between meetings. As the world’s largest Muslim-majority country, Indonesia experiences notable shifts in consumer behavior and urban activity during the holy month. While moving around the city, we were particularly impressed by the quality of Jakarta’s road infrastructure, which, in many areas, exceeds what we have seen in the capitals of more developed countries. The improvements in connectivity and urban planning are a testament to Indonesia’s infrastructure investments over the past decade. Over the course of the week, we met with companies across the consumer, healthcare, real estate and industrial sectors, gaining valuable insights into the country’s evolving economic landscape.

A recurring theme in our discussions was the growing fragility of the Indonesian consumer, particularly in Java, the most economically and demographically significant of Indonesia’s 17,000 islands, accounting for 56% of the population and 57% of GDP. Over the past few years, real wage growth has lagged inflation, eroding purchasing power across all income segments. However, while businesses serving the urban middle class are experiencing a notable slowdown, some ex-Java regions have shown resilience, benefiting from recent minimum wage increases, social aid for low-income groups, commodity-linked employment and past infrastructure investments.

This consumer sentiment is most evident in downtrading, as households opt for cheaper alternatives across food, personal care and general merchandise. A notable trend has been the shift away from multinational companies, such as Unilever, in favour of more affordable local alternatives that offer comparable quality at lower price points. Companies in healthcare and discretionary retail are reporting lower volumes, even as premium segments remain more stable. Our meetings and channel checks confirmed that consumption weakness among middle-income consumers is entrenched, creating a challenging near-term outlook for businesses exposed to domestic demand.

The continued depreciation of the rupiah adds to the pressure. The currency is among the worst-performing in Asia year to date, despite active central bank interventions. Foreign investors have pulled USD1.8 billion from Indonesian equities this year, and on March 18, the Jakarta Composite Index triggered a trading halt after a 5% intraday drop, highlighting nervousness in the local market.

Although the new government has set ambitious economic targets, many investors remain cautious about execution risks. President Prabowo has announced a goal of achieving 8% GDP growth, a level Indonesia has not seen since 1995. With structural constraints and weak private sector investment, breaking out of the 5% growth range recorded in recent years remains a significant challenge.

One of the government’s most ambitious initiatives is the Danantara Sovereign Wealth Fund, designed to consolidate state-owned assets and fund strategic projects. Danantara has a goal of reaching USD900 billion in assets under management, which would make it one of the largest sovereign wealth funds globally. However, questions remain about its governance, transparency and the potential impact on state-owned enterprises (SOEs). With Danantara expected to rely on SOE dividend payouts, banking and energy sectors could see their capital allocation priorities altered.

At the same time, the government’s pivot away from infrastructure spending raises concerns about long-term economic sustainability. Over the last decade, Indonesia’s growth has been supported by significant public infrastructure projects, such as the Trans-Java Toll Road, which improved connectivity and regional economic development. The decision to reallocate resources toward populist policies, such as the free school meal program, has introduced fiscal uncertainties, particularly as recent revenue collection fell short of expectations.

Implementing free school meal programs has proven effective in combating malnutrition and improving educational outcomes in various countries. For instance, India’s Mid Day Meal Scheme, which serves nutritious lunches to over 97 million children daily, has led to increased school attendance and a 31% reduction in anemia prevalence among adolescent girls. However, executing such an initiative across Indonesia’s vast archipelago presents significant logistical challenges. Ensuring the consistent distribution of fresh meals to remote and diverse regions requires substantial infrastructure and coordination efforts.

Beyond economic policies, we noted concerns about the rising military presence in government institutions, a development that some investors worry could signal a shift toward a more centralized power structure. While Indonesia has undergone remarkable democratic progress since the fall of Suharto’s authoritarian rule in 1998, memories of military-dominated governance still linger. While this shift has raised alarms among some observers, it is important to distinguish today’s political landscape from the Suharto era, as institutional limits on military influence have since been established.

For foreign investors, rule of law, policy predictability and strong institutions remain critical factors in assessing investment opportunities. Any perception of reduced transparency or shifts away from a market-driven economy could weigh on investor sentiment. While the trend warrants monitoring, fears of a full-scale return to military-dominated governance appear overstated.

Despite macro headwinds, Indonesia continues to offer structural advantages that make it one of the most attractive long-term investment destinations in Emerging Asia. With a population of over 270 million and a median age of just 30, the country remains one of the largest and youngest consumer markets globally.

Amid the macroeconomic pressures, healthcare remains one of Indonesia’s most resilient sectors, driven by rising demand and structural under-penetration. The country’s healthcare expenditure stands at only ~3% of GDP, one of the lowest in ASEAN, with the doctor and hospital bed ratios per 1,000 inhabitants (0.7 and 1.2, respectively) remaining well below the global average. The positive demographic trend and government-backed healthcare program (BPJS Kesehatan) continue to support patient volumes, with private hospital networks benefiting from both scale efficiencies and growing intensities. As Indonesia works to improve access to quality healthcare and expand private insurance adoption, the sector presents compelling long-term growth potential, even in a more challenging economic environment.

Indonesia has demonstrated resilience through past economic cycles, maintaining a relatively strong external position with foreign exchange reserves of approximately USD155 billion and government debt at ~39% of GDP. In 2024, the country recorded a current account deficit of 0.6% of GDP and a fiscal deficit of 2.3% of GDP, both within a manageable range for an emerging market. From a valuation perspective, Indonesian equities are now trading at very compelling levels, with the Jakarta Composite Index (JCI) at ~11x forward P/E, roughly two standard deviations below its 10-year average.

Line graph illustrating the levels of the Jakarta Composite Index over the last ten years.
Source: Bloomberg

If global monetary conditions ease, Indonesia could be well-positioned for a rerating.

In this environment, stock picking is key. We continue to focus on companies with strong pricing power, resilient demand drivers and long-term structural advantages – qualities exemplified by our holdings in Sido Muncul and Mitra Adiperkasa.

Industri Jamu Dan Farmasi Sido Muncul Tbk PT (SIDO IJ) is Indonesia’s leading producer of traditional herbal medicines and functional beverages. Its flagship brand, Tolak Angin, is synonymous with natural flu and cold relief, commanding a market share of 72% in the herbal cold symptoms product category and enjoying strong consumer loyalty and premium pricing power while remaining a staple of Indonesian households. The company’s vertically integrated supply chain improves cost efficiency, further strengthening its margin resilience in an inflationary environment. Unlike many consumer goods companies that face pressure from rupiah depreciation, Sido Muncul is largely insulated from currency volatility as its raw material sourcing and key input costs are primarily local. With a net cash position and ~7% dividend yield, Sido Muncul combines defensive qualities with long-term structural growth, supported by expansion into functional beverages and overseas markets.

Mitra Adiperkasa Tbk PT (MAPI IJ) is Indonesia’s largest specialty retailer, operating a diverse portfolio of global brands, including Zara, Sephora, Nike, Starbucks and Apple (via authorized retail partnerships). The company benefits from strong pricing power through exclusive brand partnerships and a premium positioning, which allows it to maintain healthy performance even in softer consumption periods. While mass-market retail faces headwinds, Mitra Adiperkasa is well-positioned in the more resilient mid-to-premium consumer segment. Its long-term structural advantages stem from strong brand relationships, a well-executed omnichannel strategy and a track record of navigating economic cycles, making it a long-term winner in Indonesia’s evolving retail landscape.

Indonesia is experiencing a challenging economic transition, but its long-term structural advantages remain intact. Our Indonesian holdings are positioned for strong business fundamentals despite macro volatility.

The Fed’s economic forecasts are inconsistent with the suggestion of a 50 bp cut in rates by year-end, according to a model of its historical behaviour.

The model assesses the probability of the Fed being in tightening or easing mode in a particular month based on currently reported and lagged values of core PCE inflation, the unemployment rate and the ISM manufacturing delivery delays indicator. Despite the small number of inputs, the model does a satisfactory job of “explaining” the Fed’s past actions – see chart 1.

Chart 1

260325c1

The model predicted that the Fed would hold in March with a slight tightening bias – the probability reading rose to just above the 0.5 neutral level, having previously been in the easing zone.

The FOMC median projections for core PCE inflation and the unemployment rate in Q4 2025 were raised to 2.8% and 4.4% respectively this month, from 2.5% and 4.3% in December. Assuming a smooth progression to these values, the model signals a greater chance of tightening than easing over the remainder of the year – chart 2.

Chart 2

260325c2

The suggestion is that inflation and / or labour markets news will need to surprise significantly to the downside to warrant the 50 bp cut in rates by year-end implied by the median dot.

Chart 3 shows the model prediction in an alternative scenario in which the unemployment rate and core inflation move to 4.7% and 2.5% in Q4. The probability reading remains above 0.5 into the summer but falls back into the easing zone at end-Q3.

Chart 3

260325c3

The Fed’s projection of a 4.4% unemployment rate in Q4 implies only a 0.17 pp rise relative to a recent (November) high. An indicator of labour market weakness from the Conference Board consumer survey rose further in March and is almost back to its January 2021 level, when the jobless rate excluding temporarily laid-off workers was more than 1 pp higher than now – chart 4.

Chart 4

260325c4

The US economy and markets previously enjoyed a tailwind from an “excess” stock of money relative to prevailing levels of nominal spending and asset prices. A post in December argued that nominal economic growth and rising markets had eliminated this excess by mid-2024, with a small monetary shortfall opening up Q3. An updated analysis suggests that recent weakness in equities has been insufficient to restore a surplus.

To recap, the “quantity theory of wealth”, explained in posts in 2020, is a suggested modification of the traditional quantity theory recognising that (broad) money demand depends on (gross) wealth as well as income and proposing equal elasticities. Nominal income Y is replaced on the right-hand side of the equation of exchange MV = PY by a geometric mean of income and wealth.

Chart 1 applies the “theory” to US data since end-2014. Nominal GDP is used as the measure of income, with wealth defined as the sum of market values of public equities, debt securities (excluding Fed holdings) and the housing stock.

Chart 1

210325c1

The combined income / wealth variable closely tracked moderate growth of broad money over 2015-19. Wealth rose faster than income, so traditionally-defined velocity fell. The velocity of the combined income / wealth measure was stable.

Policy easing following the covid shock resulted in possibly unprecedented monetary disequilibrium. Asset prices responded swiftly to the excess, causing wealth to overshoot broad money in 2021 before a sharp correction in 2022.

The combined income / wealth measure was still well below the level implied by broad money even before this set-back. Deployment of excess money fuelled a second surge in wealth from late 2022 while sustaining economic growth despite monetary policy tightening.

Asset price gains, goods / services inflation and real economic expansion resulted in the income / wealth measure finally catching up with broad money in mid-2024, with a small overshoot emerging in Q3. The velocity of the combined measure, in other words, had fully reversed its pandemic fall.

Asset stock numbers in the Q4 financial accounts released last week allow the calculation to be updated to end-2024. Broad money grew slightly faster than the combined income / wealth measure in Q4 but not by enough to close the end-Q3 gap.

Has the recent equity market correction pushed the combined measure back below the level implied by the money stock? Available information suggests not: ongoing growth in the stock of debt securities along with rising goods / services prices may have offset the decline in equities – unless the economy turns out to have contracted in Q1. Broad money, meanwhile, grew modestly in January, with a February number released next week.

The previous monetary excess imparted a positive skew to the economy / markets so its withdrawal suggests greater vulnerability to negative developments.

GACM_COMM_2025-03-20_Banner

Earlier this month, we attended the Daiwa Investment Conference in Tokyo, which is the largest conference of its kind in Japan. Over 400 companies and 650 investors participated. We met a total of 20 companies, of which six are holdings in our portfolios. Across various industries, many companies emphasized improving ROE, shareholder return and corporate governance.

The overall sentiment remained cautiously optimistic despite tariff concerns. So far, only one new tariff has been applied to imports from Japan during this second Trump administration: 25% tariffs on steel and aluminum products from all countries and regions, including Japan.

Negotiations between the United States and Japan are hard to predict. Below are key factors to consider:

Year to date, Japanese small caps have outperformed large caps thanks to less exposure to tariffs. This is an ideal environment for domestic-oriented companies that benefit from healthy inflation, higher consumption driven by wage hikes, and inbound tourism.

  • Inflation: The core consumer price index in Japan is expected to rise 2.9% year-over-year in February 2025, after +3.2% in January. The central bank policy rate in Japan is at only 0.5%; still lots of room to raise the rate to keep inflation under control.
  • Wage hike: According to Rengo, Japan’s largest union group, Japanese companies have agreed to raise wages by 5.46% in the fiscal year 2025, the second year in a row above 5%. This reflects record-high corporate profits and the need to retain staff amid a labour shortage.
  • Inbound tourism: A record high of 36.9 million foreigners visited Japan in 2024, up 47.1% from 2023, and up 15.6% from 2019. The largest number of visitors to Japan came from South Korea, followed by China, Taiwan and Hong Kong. Tourists’ consumption exceeded 8 trillion yen (USD53 billion) for the first time. Expo 2025 Osaka will take place between April 13 and October 13, 2025, and aims to attract over 28 million visitors, including 3.8 million from overseas.

As part of its growth strategy, Japan has set a target of 60 million foreign visitors and 15 trillion yen in consumption in 2030. Kotobuki Spirits Co. Ltd. (2222 JP), a company we initiated last year, is well positioned to benefit from such trend.

Founded in 1952, Kotobuki Spirits is a leader in premium gift sweets in Japan. The flagship brand is LeTAO which is known for its desserts, but especially its cheesecake. Other brands include Now on Cheese, Tokyo Milk Cheese Factory, The Maple Mania and more. Points of sale are in prime locations such as train stations, department stores, shopping malls and airports. Customers are local consumers, corporates and inbound tourists (20% of total sales). Gift giving is a common part of Japanese culture and oftentimes gifts are in the form of food or treats. The size of Japan’s domestic food and beverage gift market was estimated to exceed $32 billion in 2023.

Kotobuki Spirits’ main growth strategy is to expand distribution. About half of sales are from its directly owned stores, while the rest is from wholesale and online retail. Currently, it owns 130 stores and plans to open 5-10 every year. Thanks to its strong pricing power, the company raised prices by an average of 3% in fiscal year 2023 and by 10% in fiscal year 2024.

The management team is very stable and experienced. President Seigo Kawagoe is the son of the late founder. He has been with the company since 1994. The Kawagoe family owns 29% of outstanding shares. In the December 2024 quarter results, its sales grew over 14% and its operating profit was up 15%.

The Malaysian city of Johor Bahru, with traffic on the Johor-Singapore Causeway.

Last July we wrote to clients about the vicious and virtuous circles which define EM investment cycles and argued there are signs of potential shift from the former to the latter: Are emerging markets on the cusp of a “virtuous circle”?

In the piece we cautioned that fixation on dominant investment narratives can lead to investors missing opportunities in neglected asset classes:

The disparity between the US and EM over the past decade tempts investors into the behavioural trap of building conviction for future returns based on what has performed well in the recent past. It is easy to forget that the annualised returns from 2000 to end-2023 for EM were 7.6% versus 7.8% for the US, both outpacing 6.2% for MSCI World. The risk here is that a pro-cyclical mindset can lead to perverse thinking where conviction strengthens for a popular asset class as the likelihood of a good result decreases, and vice versa.

Along the same lines, we argued in December that investors needed to be mindful of success bias in US equities:

Making money as an investor is all about the delta between reality and expectations. Investors myopically fixated on market narratives about US exceptionalism as justification for extreme outperformance versus the rest of the world risk overstaying their welcome, along with missing opportunities in unloved markets.

Investors adding to US exposure at the expense of the rest are making a bet that such scorching outperformance can continue.

This was against a backdrop of a raging “Trump trade,” as investors bet on a hot US economy, tariffs feeding inflation, rising yields and dollar, and US stocks outperforming the rest.

These trades are now in retreat on fears of tariff blowback on the US economy, while stocks in China rip higher and the dollar plunges.

Vicious and virtuous circles

Is this the turning point we have been calling for? Let’s re-examine the vicious and virtuous circles for EM equities. The performance of US companies, especially its tech giants has indeed been exceptional, while weak fundamentals in EM have fed a self-reinforcing feedback loop which has been a major headwind for the asst class, illustrated below.

Vicious and virtuous circles in EM equities: Vicious
Source: NS Partners

Is China leading a shift?

Recent dollar weakness as well as a boost to the monetary backdrop in China provides further support to the view that a shift to the virtuous circle may be approaching.

Vicious and virtuous circles in EM equities: Virtuous
Source: NS Partners

Chinese equities have run hard over a short stretch and may well be due a pullback. However, valuations remain attractive with the market ticking up from 10x CAPE to just over 11x. The rally so far has centred on tech giants Tencent and Alibaba as investors wake up to China’s capacity to innovate in AI and compete with the United States.

There is potential for this outperformance to broaden as the economy stabilises, corporate earnings bottom out, and with the potential for more stimulus from Beijing to come in response to President Trump’s trade sorties.

From famine to feast in Southeast Asia

It’s not just China that would enjoy a stalling dollar. There are a number of liquidity-sensitive markets likely to switch from famine to feast, where capital inflows are sterilised by central banks through money creation on commercial bank balance sheets.

The small, open trading economies of ASEAN in particular would be beneficiaries. The liquidity boost from a falling dollar would be a shot in the arm for a region already benefitting from strong foreign direct investment (FDI) flows, relatively stable politics, economic and governance reform initiatives, along with efforts to foster stronger regional economic ties. Investor positioning in the region is light as illustrated below.

 ASEAN investor positioning – active investors are only overweight in Indonesia

Line chart showing ASEAN investor positioning via Global Equity Markets active vs passive country allocations.
Source: EPFR as of 31 January 2025

Malaysia in particular has been unloved by EM investors, a heavy underweight with its stock market being hit by over five consecutive years of outflows. This belies what we think is an opportunity for the country to capitalise on the combination of its position at the intersection of Chinese and US FDI flows, a positive domestic economic reform story, and huge potential of greater economic links with neighbouring Singapore through the Johor-Singapore Special Economic Zone (JSSEZ) which was announced in 2024.

Malaysia’s golden opportunity

We have written previously about how a decade of reform under Modi in India has fuelled a positive development cycle acting as a driver for sustainable economic growth. Malaysia’s reform story is on a much smaller scale given a population of 35 million against India’s 1.4 billion, but it is meaningful and emblematic of wider regional reform efforts. It is also more incremental as Prime Minister Anwar manages a relatively fragile coalition government, in contrast to Modi’s commanding hold over Indian politics.

Like India’s Aadhaar program, Malaysia has introduced biometric identification in MyDigital ID. The system streamlines access to government services such as welfare payments, and reduces fraud. Anwar has also successfully axed costly diesel subsidies, which will save around RM4 billion annually, reduce smuggling, and free up cash to be redirected to healthcare, education, and infrastructure. A far more economically impactful (but equally contentious) reform of wider fuel subsidies is also on the agenda.

We think the most exciting development is the government’s ambition to form closer economic ties to Singapore through the JSSEZ. Our Co-CIO Ian Beattie met with both Prime Minister Anwar and Finance Minister II Amir Hamzah over the past few months in London to hear about opportunities for foreign investors.

The JSSEZ aims to capitalize on the geographical proximity and complementary strengths of Johor and Singapore. Singapore is bursting at the seams with people and flush with capital, pushing property prices and rents sky high. These issues are putting constraints on businesses in the bustling Asian financial hub that are looking to expand. Johor’s key advantage is in its geographical proximity to Singapore along with providing access to much more competitively priced land, water and energy, globally connected ports, as well as educated workers able to speak Malay, English and Chinese.

Meeting the Malaysian government

Image showing NS Partners Co-CIO Ian Beattie standing in the second row just to the right of Malaysian Prime Minister Anwar Ibrahim, who visited London in February to promote Malaysia’s promise as an investment destination.
NS Partners Co-CIO Ian Beattie standing in the second row just to the right of Malaysian Prime Minister Anwar Ibrahim, who visited London in February to promote Malaysia’s promise as an investment destination. Source: Invest Malaysia 2025.

“It’s a no-brainer” – Johor-Singapore Special Economic Zone

While the meetings in London were exciting, nothing beats seeing it first-hand. Ian and I travelled to Singapore and Malaysia in late February, kicking the trip off at one of the busiest land borders in the world (10,000 people crossing per hour and rising), between Singapore and the Malaysian city Johor Bahru, the heart of the JSSEZ.

After missing our early morning train (turns out you need to be at the customs counter more than 30 minutes before departing) we were relieved to find that we could swiftly pass through a massive, automated customs facility at the entry to the bus terminal, with departures heading over the border every few minutes. We then spent the day touring the city and surrounding areas which would make up the JSSEZ, which span several areas illustrated in the map below.

Map of Johor-Singapore Special Economic Zone, highlighting its nine flagship areas. 
Source: PWC 2025

Each of these areas, known as flagship areas, will focus on different vital sectors such as manufacturing, business services, digital economy, education, health, tourism, energy, logistics and financial services.

Johor is already a global hub for data centres, attracting investments from US and Chinese tech giants like Nvidia, Microsoft and ByteDance. However, the combined support of the Malaysian and Singaporean governments pushing for more seamless movement of goods and people through the region through developing better transport links and cutting red tape between the economies, is seen as a game changer that will supercharge development.

It really is different this time

The JSSEZ is the latest iteration of previous (and disappointing) attempts to promote investment and development in Johor. However, as explained by the team at the Invest Malaysia Facilitation Centre (IMFC – which had been established only a week or so before we visited), this is the first coordinated push by Malaysia and Singapore, with the IMFC tasked with shepherding capital around the country.

Image of Michael and Ian meeting the head of IMFC Adny Jaffedon bin Ahmad and Iskandar Regional Development Authority VP Rozy Abd Rashid.
Meeting the head of IMFC Adny Jaffedon bin Ahmad and Iskandar Regional Development Authority VP Rozy Abd Rashid.

Booming Johor

While the task of getting all of the various agencies and governmental authorities to work together will be a monumental task, our discussions with companies in the region paint a bright picture. In property, we met with the team at Knight Frank Johor who said that the region had been booming even before the announcement of the JSSEZ. Residential real estate prices have risen around 50% in five years as Singapore’s growth spills over the border, with workers buying property in Johor and commuting into the city-state each day. This looks set to continue with the completion of the Singapore–Johor Rapid Transit System set for completion in 2027 which will directly connect Johor with Changi airport.

We met with property developer EcoWorld which owns a large land bank of residential, commercial and industrial sites close to the border. The company is focused on the development of large townships connected to commercial spaces set to soak up demand from Singaporean businesses looking to expand in a cost-effective way, e.g. HQ based in Singapore, but with an expanding operations team in Johor.

Image of an EcoWorld employee presenting the plan for developing their Botanic township.
EcoWorld taking us through the plan for developing their Botanic township.

Image of visitors trying out EcoWorld’s virtual sales technology; an image of the interior of a home is projected on walls.
Trying out EcoWorld’s virtual sales technology.

Development in residential and commercial property is unfolding at a rapid pace. However, almost all of the companies we met with were wary about whether the local infrastructure could scale up to accommodate the influx of people and activity.

At the centre of the China-US AI investment race

Malaysia is positioning itself as a key Asian hub for where the physical manifestation of the digital world is built out. Huge investment in AI and cloud infrastructure is transforming the region through the construction of data centres, power stations, transmission cables, power plants, water reservoirs and more. Tech giants looking to invest in Malaysia rely heavily on local players across real estate, construction and banking for their knowledge of the market and ability to navigate the regulatory environment to successfully execute on projects.

Everyone we spoke with in Johor was excited about the surge in interest for industrial land to develop data centres, for both cloud and AI. We toured sites where just a few years ago there was dense jungle. Thousands of acres have given way to massive concrete and steel structures built for the some of the largest tech companies in the world.

Image from the exterior of a large data centre park in Malaysia.
Touring an enormous data centre park.

There is so much demand that development is running into resource bottlenecks, and the government is wary that mushrooming data centres could deplete local resources at the expense of the local population. While power supply is cheap in Malaysia, the intensity of power consumption requires huge investment in renewable energy and transmission capabilities. The biggest constraint is water supply for cooling. Local authorities are furiously working to build new reservoirs to support the infrastructure. Some data centre players are looking to move so fast, they are building their own desalination plants, made possible by the close proximity of some sites to the sea.

Leading the region

We made the three-hour drive from Johor up to Kuala Lumpur to meet with a host of companies behind the development story not just in Johor, but also across Malaysia and Southeast Asia. To single out just one business, construction company Gamuda spoke with us about how their technical expertise and strong balance sheet allows them to tender for highly complex and long-term projects that deter competitors while driving double-digit margins. This includes AI and cloud projects for tech giants like Google and Microsoft, as well as for the Malaysian government in its push to improve the country’s infrastructure.

Gamuda has expanded regionally, with operations outside of Malaysia now accounting for over 85% of its business. It boasts stronger margins than peers in the major markets of Australia and Taiwan, with a tightly run project management team based in Malaysia helping to drive costs down. This, along with an innovative engineering culture, allows Gamuda to make competitive bids for highly complex projects that local peers struggle to match. In Australia, this has seen them win bids for multi-year, multi-billion-dollar mega projects in renewables and infrastructure like Sydney’s metro rail network.

Leading the construction of nine kilometres of metro rail tunnels in Sydney

Image of tunnel boring machine breaking through solid rock walls at the Clyde Metro junction caverns in Sydney, Australia.
Source: Gamuda 2025

In Taiwan, Gamuda has been building underground railway lines, transmission lines, sea walls and bridges. Taiwan’s monopoly position in leading-edge semiconductors has left the country flush with capital to fuel an infrastructure upcycle. Gamuda’s order book is growing as it often finds itself the only bidder to some attractive tenders. This is down to both the complexity of projects, but also the lack of competition. Everything is tendered in Mandarin, but Chinese construction businesses are “not welcome” in the market. Local players generally do not have the strength of balance sheet or experience that Gamuda boasts, allowing the company to set very attractive prices in contracts that our contact described as “obscenely fair.”

Ambition and (cautious) optimism

Aside from company research, we also spent a lot of time admiring Kuala Lumpur’s skyline, particularly Merdeka 118 (pictured below) which stands at 679 metres tall (its spire alone being 158 metres tall). It is the second tallest building in the world, surpassed only by the Burj Khalifa, and was officially opened in early 2024. The name « Merdeka » means « independence » in Malay, reflecting its proximity to the historic Stadium Merdeka, where Malaysia’s independence was declared. Not only does it stand as a symbol of the country’s progress, we think it also signals its ambition, potential and the opportunity on offer for many of the excellent businesses that we met.

Merdeka 118

Image of Merdeka 118 during the day. Image of Merdeka 118 illuminated at night.

Source: NS Partners 2025

A stabilisation in the stock of UK vacancies in the three months to February compared with the prior three months has been cited as evidence that labour demand is holding up despite survey indications of job cuts.

Analysis of “experimental” single-month data, however, indicates that stability of the three-month average conceals a small rise in vacancies in November / December that has more than reversed in January / February*. The February single-month number was the lowest since April 2021 and 4% below the pre-pandemic (i.e. December 2019) level – see chart 1.

Chart 1

200325c1

The timely Indeed job postings series also recorded a small increase at end-2024 before falling back in January / February, with the decline continuing in the first half of March (daily information is available through 14 March).

The fall in the single-month vacancies series in January / February was more than accounted for by a decline in non-government-related postings, i.e. openings in public administration, education and health are estimated to have risen after seasonal adjustment. The single-month “private sector” series was 12% below its December 2019 level in February.

Three-month on three-month growth of private sector regular pay remained strong in January but momentum of an employment-weighted average of PAYE data on median pay levels across industries is tracking lower, suggesting better official earnings news ahead – chart 2.

Chart 2

200325c2

*The single-month numbers require seasonal adjustment. A three-month average of the resulting series closely matches official numbers.