Les investisseurs institutionnels sont souvent confrontés à la décision de protéger leurs placements étrangers contre les fluctuations des taux de change. L’une des préoccupations habituelles est que l’exposition aux devises augmentera la volatilité des rendements des actions étrangères.
Le présent article explore les cas où la couverture est bénéfique et ceux où les investisseurs canadiens peuvent avoir intérêt à ne pas se couvrir.
Actions canadiennes ou actions mondiales, lesquelles sont les plus volatiles?
On suppose que les investissements à l’extérieur du Canada, qui sont exposés à différentes devises et différents marchés, peuvent se traduire par des rendements plus volatils pour les actions mondiales que pour les actions canadiennes. Toutefois, sur des périodes courtes (rendements sur des périodes mobiles de trois ans), les actions mondiales ont généralement été moins volatiles que les actions canadiennes, bien qu’il y ait eu des exceptions.
Figure 1 : Volatilité relative des actions canadiennes et mondiales
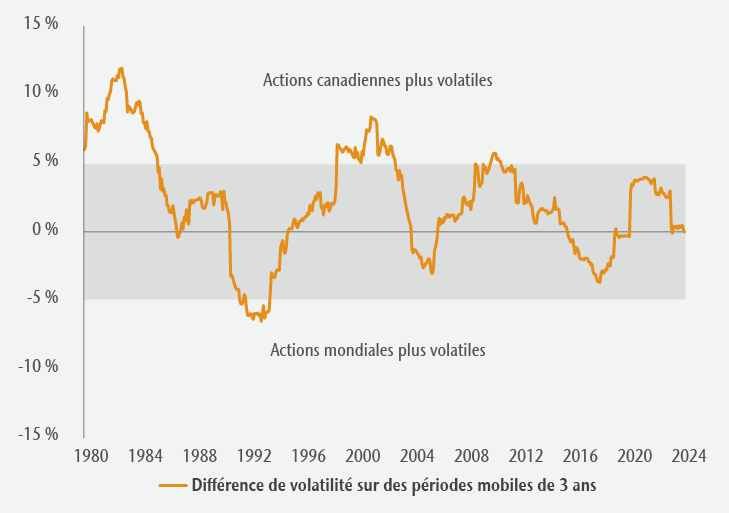
Sources : Bloomberg et MSCI.
La figure 1 illustre la volatilité relative des rendements des actions canadiennes (indice composé S&P/TSX) par rapport aux actions mondiales (indice MSCI Monde non couvert). Lorsque la ligne orange est au-dessus de 0 %, les actions canadiennes ont été plus volatiles; en dessous de 0 %, les actions mondiales ont été plus volatiles. Le graphique montre que, sur de courtes périodes, les actions canadiennes ont souvent été plus volatiles.
Sur des périodes plus longues (rendements sur des périodes mobiles de 10 ans) et en particulier depuis la fin des années 1990, l’analyse montre que les actions mondiales ont été presque systématiquement moins volatiles que les actions canadiennes (figure 2) grâce à un univers d’occasions de placement plus large et plus diversifié.
Figure 2 : Volatilité des rendements absolus des actions canadiennes et mondiales
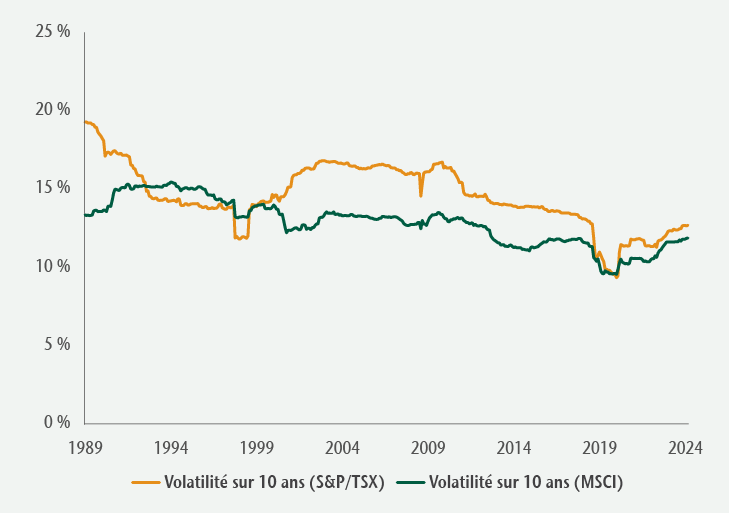
Sources : Bloomberg et MSCI.
La couverture réduit-elle la volatilité des actions mondiales?
Contrairement à la croyance selon laquelle une couverture est nécessaire pour réduire la volatilité, les données historiques indiquent que ce n’est pas toujours le cas.
La figure 3 illustre la volatilité relative des rendements couverts et non couverts des actions mondiales sur des périodes mobiles de trois ans. Lorsque la ligne orange est au-dessus de 0 %, les rendements couverts ont été moins volatils; en dessous de 0 %, les rendements non couverts ont été moins volatils. Les rendements non couverts des actions mondiales ont généralement été moins volatils, surtout depuis le milieu des années 1990, car les fluctuations des taux de change tendent à contrebalancer les rendements boursiers, ce qui réduit la volatilité globale des rendements.
Figure 3 : Actions mondiales couvertes et non couvertes

Sources : Bloomberg et MSCI.
Quel est le ratio optimal de couverture du risque de change?
Le ratio de couverture, la valeur de la position de couverture par rapport à la valeur totale de la position, varie selon l’investisseur. Si un portefeuille détient 10 millions de dollars en actions mondiales et que l’exposition au risque de change est couverte à hauteur de 3 millions de dollars, le ratio de couverture est de 30 %. Bien que la recherche indique souvent qu’un ratio de couverture de 50 % est optimal, les décisions individuelles dépendent de l’exposition aux devises et des perspectives de risque de l’investisseur. La figure 4 montre deux investisseurs dont les ratios de couverture sont différents, mais dont l’exposition nette au risque de change est la même.
Figure 4 : Même exposition nette au risque de change, différents ratios de couverture
|
Exposition au risque de change (a) |
Ratio de couverture (b) |
Exposition nette au risque de change (a-b) |
| Investisseur A |
60 % |
50 % |
30 % |
| Investisseur B |
30 % |
0 % |
30 % |
Sources : Bloomberg et MSCI.
Du point de vue de la gestion du risque, un ratio de couverture de 50 % est parfois utilisé pour gérer le « risque de regret », soit la déception potentielle liée à l’adoption d’une approche non couverte ou entièrement couverte qui se révèle par la suite sous-optimale.
La figure 5 compare les écarts de rendement sur des périodes mobiles de trois ans entre les rendements des actions américaines non couvertes et entièrement couvertes (ligne orange) et entre les actions américaines non couvertes et couvertes à 50 % (ligne verte). Lorsque les lignes sont supérieures à 0 %, la stratégie non couverte a inscrit un rendement supérieur, tandis que les stratégies entièrement couvertes et couvertes à 50 % ont inscrit un rendement supérieur lorsque les lignes tombent en dessous de 0 %.
Figure 5 : Rendement relatif des actions américaines sur des périodes mobiles de 3 ans
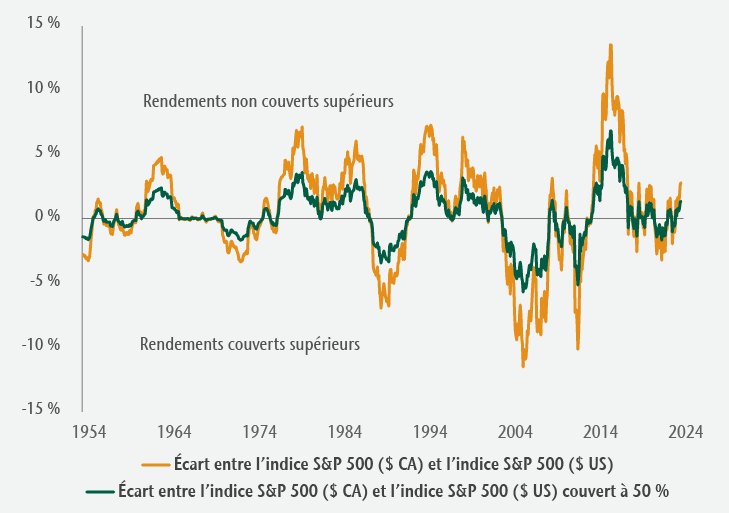
Sources : Bloomberg et MSCI.
Par défaut, l’écart de rendement pour l’approche de couverture de 50 % contre le « risque de regret » (ligne verte) a été moins volatil au cours de la période. Pour certains investisseurs, il est préférable d’enregistrer de plus petites différences liées aux fluctuations des taux de change.
Comment les devises devraient-elles être gérées sur les marchés privés?
Les placements sur les marchés privés mondiaux, comme l’immobilier direct et les actifs d’infrastructures dans les fonds à capital variable, continuent d’augmenter considérablement. Ces actifs moins liquides nécessitent toujours un examen attentif de l’exposition aux devises, car celle-ci peut avoir une incidence sur leur valeur à court terme. Les investisseurs sur le marché privé s’attendent généralement à un revenu et à une diversification au moyen de rendements absolus, qui peuvent être significativement impactés par les fluctuations de change.
La couverture permet de gérer ces risques, mais une évaluation des facteurs propres à chaque placement est nécessaire. Cela comprend la compréhension des charges et des revenus sous-jacents de l’actif, des couvertures naturelles potentielles, des coûts de couverture et de la durée de la couverture. Il est également important d’apparier la devise de l’exposition nette avec le financement connexe.
Pour les investisseurs canadiens, la façon la plus simple et la plus efficace de gérer le risque de change est de confier la couverture de change au gestionnaire de placement sur le marché privé.


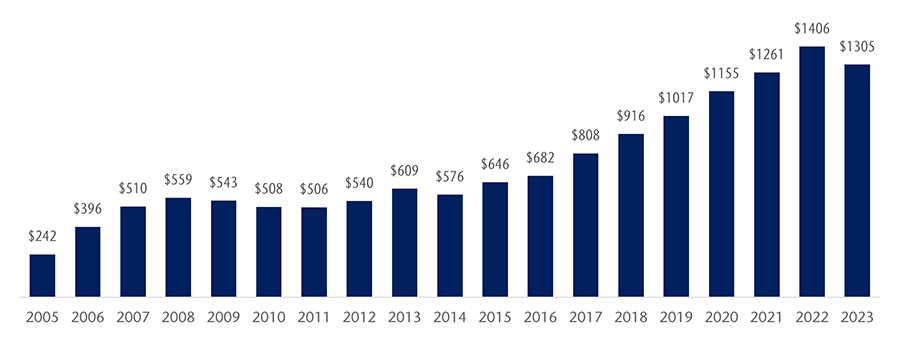 Source: PitchBook.
 Source: Statista.