
Jeff Wigle discute le partenariat de 12 ans avec Purity Life et du monde du capital-investissement sur le podcast.
Jeff Wigle discute le partenariat de 12 ans avec Purity Life et du monde du capital-investissement sur le podcast.

The fluctuation in mergers and acquisitions (M&A) activity in 2021 followed a typical cyclical pattern, echoing broader economic trends. The initial surge in M&A was propelled by low interest rates and a swift reopening from the COVID-19 pandemic that encouraged companies to pursue strategic acquisitions. This led to the highest M&A volumes since 2007.
However, several factors dampened the momentum in 2022-23. Aggressive interest rate hikes, rising inflation, geopolitical tensions such as the war in Europe, and an overall economic slowdown contributed to a decline in M&A activity. Additionally, decreasing confidence among C-suite executives and a wider bid-ask spread between buyers and sellers further reduced dealmaking.
As a result, total M&A volumes dropped by 18% to approximately $3 trillion in 2023, according to data from Dealogic. This marked the lowest level of M&A activity since 2013 when deal volumes were at $2.8 trillion, indicative of the challenges and uncertainties faced by global dealmakers amidst shifting economic conditions and geopolitical risks.
All of this changed when the Federal government started hinting about lowering interest rates in 2024. This week, we look at how this trend stands to benefit our portfolio.
Global M&A volumes
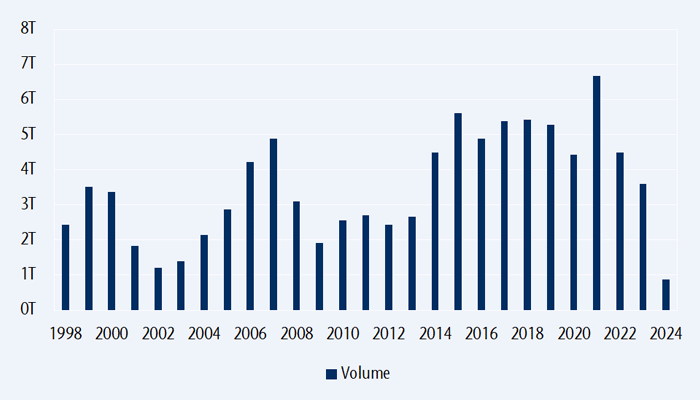
Source: Bloomberg
Despite ongoing macroeconomic and geopolitical uncertainties, signs are pointing to a potential turnaround for dealmaking in 2024. Three key factors support this optimism:
Global non-financial listed companies hold $5.6 trillion in cash, while private market investors possess $2.5 trillion in dry powder, providing substantial resources for dealmaking. Additionally, depressed small cap valuations along with structural factors such as advancements in AI, the transition to clean energy, innovation in life sciences, reshoring initiatives and geographic diversification are further driving demand for M&A.
The dismal performance of 2023, marked by the lowest completed M&A volumes in a decade relative to nominal US GDP, underscore the potential for a rebound in deal activity in 2024. So, how big can it get?
Based on Dealogic’s data, global M&A volume has averaged around $5.5 trillion per year since 2014. With corporations potentially aiming to catch up on the $2 trillion shortfall from the last two years, M&A volumes for 2024 could range from $5.5 trillion to about $9.5 trillion. Actual figures will depend on various factors such as economic conditions, geopolitical stability and corporate strategies.
The underlying drivers are especially visible in markets like Europe that have seen a drought in M&A activity.
Western Europe M&A volumes
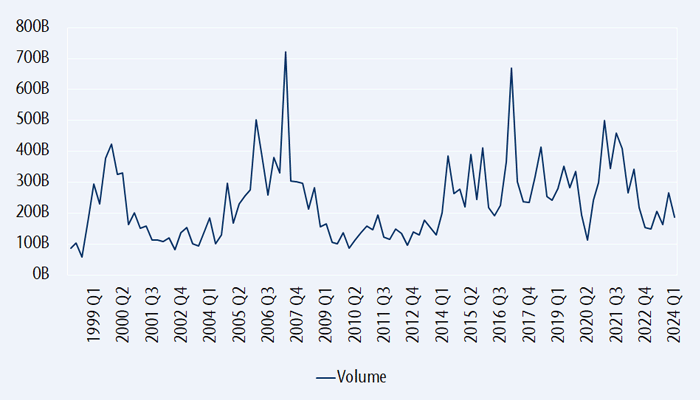
Source: Bloomberg
Looking at Japan, the structural shift towards greater corporate efficiency and activity is notable and expected to drive further M&A activity in the market. Despite the challenges faced by global markets, Japan has managed to maintain positive M&A volumes, demonstrating a resilience and proactive approach among Japanese companies.
Rising costs, stricter governance rules and mounting shareholder pressure are compelling companies in Japan to explore strategic options, including M&A. This trend is part of a broader effort to enhance corporate performance and unlock shareholder value.
Moreover, the potential wave of management buyout (MBO) activity in Japan is bolstered by recent reforms in the Tokyo Stock Exchange and guidelines by the Ministry of Economy, Trade and Industry (METI) for corporate takeovers. These reforms and guidelines are meant to promote shareholder earnings and increasing corporate value, aligning with the goals of enhancing efficiency and profitability.
For Japanese companies, especially those with lower capital efficiency, MBOs present an attractive way to streamline operations, improve governance and maximize shareholder returns. As a result, we can anticipate more M&A and MBO activity in Japan as companies adapt to evolving market dynamics and regulatory environments.
Japan M&A volumes
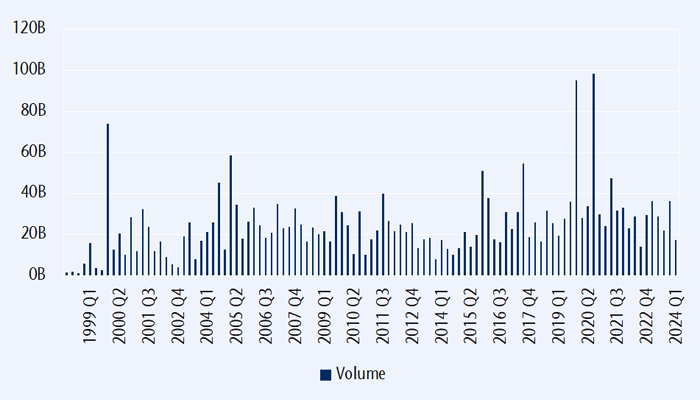
Source: Bloomberg
Many other markets like Australia, India, Korea and ASEAN are also expecting heightened M&A activity this year.
The accelerating M&A environment can be positive for smaller companies as their larger counterparts are willing to pay to acquire agile and innovative companies that can provide positive long-term growth perspectives. Furthermore, big companies seem to be diversifying by acquisition type. Larger, maturing companies can lack the same innovation capabilities as small companies to adjust, create and develop faster due to their nimble structure.
Another way to capitalize on this trend is by investing in a M&A advisory firm. These companies provide advice on corporate mergers, acquisitions and divestitures as well as debt and equity financing, acting as intermediaries in business sale transactions for either the selling company or the buyer.
We have profited from the M&A theme via Rothschild & Co., a France-based merger and acquisition boutique firm that has generated solid returns for our clients. Also, we recently initiated a position in Evercore, a name we have owned in the past and decided to repurchase because it is poised to outperform its competitors in the M&A space.
Founded in 1995, Evercore is an independent investment bank and asset manager, ranking #1 among independent firms and #4 among all M&A boutiques, including well-known players like Goldman Sachs. The company has a strong and liquid balance sheet, making it an excellent example of an investment that should benefit from the exciting uptick in M&A activity.

Michael Mormile, ancien gestionnaire de portefeuille de Citadel, ainsi que Jonathan Hartofilis et Richard Li, s’associent au Groupe financier Connor, Clark & Lunn Ltée (Groupe financier CC&L) pour lancer conjointement FortWood Capital (FortWood), un nouveau gestionnaire de placements dans les marchés émergents. Dans le cadre du lancement, le Groupe financier CC&L fournira des capitaux de démarrage ainsi que des placements d’autres clients.
FortWood cherche à tirer parti des occasions offertes par les inefficiences structurelles des titres de créance des marchés émergents mondiaux au moyen d’un portefeuille diversifié de titres de créance. Michael Mormile explique : « Notre approche combine une analyse macroéconomique et fondamentale approfondie avec un cadre de gestion du risque rigoureux afin de gérer efficacement les complexités du marché des titres de créance des marchés émergents et de transformer la volatilité inhérente aux marchés en force pour le portefeuille. »
Les stratégies de rendement absolu et à gestion active composées exclusivement de positions acheteur sur les marchés émergents ciblent les obligations de sociétés et d’État libellées en monnaies étrangères. Ces stratégies sont conçues pour les clients qui cherchent à tirer parti des taux attrayants et des divergences de valeur que l’on trouve dans les marchés sous-étudiés.
« Notre partenariat avec Michael, Jonathan et Richard pour étendre notre présence dans les titres de créance des marchés émergents est une excellente nouvelle pour nous. L’expertise de l’équipe FortWood dans ces régions et ces marchés offre aux clients la possibilité d’une diversification supplémentaire complémentaire à nos produits existants, ainsi que des rendements potentiellement plus élevés, » déclare Warren Stoddart, chef de la direction du Groupe financier CC&L.
« En nous joignant au Groupe financier CC&L, nous obtenons non seulement un soutien opérationnel institutionnel et une distribution mondiale, mais aussi une culture d’excellence partagée qui nous permettra sans aucun doute de nous concentrer sur ce que nous faisons le mieux et d’obtenir des résultats exceptionnels pour nos clients, » déclare Michael Mormile.
Ce partenariat, qui repose sur une équipe solide et des principes communs, permet à FortWood et au Groupe financier CC&L de tirer parti d’une catégorie d’actif en croissance ainsi que de nouvelles occasions de produire de meilleurs résultats pour les clients.
FortWood Capital se spécialise dans les stratégies de titres de créance des marchés émergents à gestion active. En mettant en œuvre son expertise en placement et un cadre de gestion du risque rigoureux, la société compose avec des marchés complexes et des conditions difficiles afin de dénicher de la valeur. FortWood, dont le siège social est situé à Greenwich, au Connecticut, fait partie du Groupe financier CC&L. Pour obtenir des précisions, consultez le site fortwoodcapital.com.
Le Groupe financier CC&L est une société indépendante de gestion d’actifs multientreprises appartenant à ses employés qui travaille en partenariat avec des professionnels des placements pour bâtir et faire croître des entreprises de gestion d’actifs prospères. Il offre, par l’intermédiaire de ses sociétés affiliées, une vaste gamme de produits et de solutions de gestion de placements traditionnels et non traditionnels aux clients institutionnels, aux clients fortunés et aux particuliers. Comptant des bureaux aux États-Unis, au Royaume-Uni, en Inde et partout au Canada, le Groupe financier CC&L a plus de 40 ans d’histoire et ses sociétés affiliées gèrent collectivement un actif d’environ 90 milliards de dollars américains. Pour obtenir des précisions, consultez le site cclgroup.com.
Rebecca Jan
[email protected]
États-Unis
Eric Hasenauer
[email protected]
Europe et EMOA
Carlos Stelin
[email protected]
Canada
Brent Wilkins
[email protected]
The quarterly commentary in mid-2023 noted that the cycle and monetary analyses were giving conflicting signals. The stockbuilding cycle appeared to be tracing out a low, a development usually associated with stronger performance of equities and other cyclical assets. However, greater weight was accorded to continued weakness in global real narrow money momentum, which suggested downside risk to economic activity and insufficient liquidity to support market gains.
The cycle signal has so far proved the correct one, with cyclical assets rallying strongly over the past five months. Monetary conditions have been more permissive than expected, probably reflecting continued deployment of “excess” money balances left over from the 2020-21 monetary surge, as well as unusual US deficit-financing operations.
What now? Valuations of some cyclical assets appear already to discount a solid and sustained economic upswing. Global real narrow money momentum has recovered slightly but remains negative, while the level of money balances may now be below “equilibrium”. Until money growth normalises, the risk is that an initial stockbuilding cycle recovery will prove disappointingly weak or even fail, with a retest of the 2023 low. A monetary revival, meanwhile, may have been pushed back by major central banks’ caution in reversing 2022-23 policy restriction, although an easing trend is under way in EM.
Commentaries in 2022 argued that the stockbuilding cycle was likely to bottom in 2023, probably in H2, based on the cycle’s 3.33-year average length and the prior low having occurred in Q2 2020. The possibility of an earlier trough was considered, on the view that the current cycle could be shorter than average to compensate for a longer prior cycle (4.25 years).
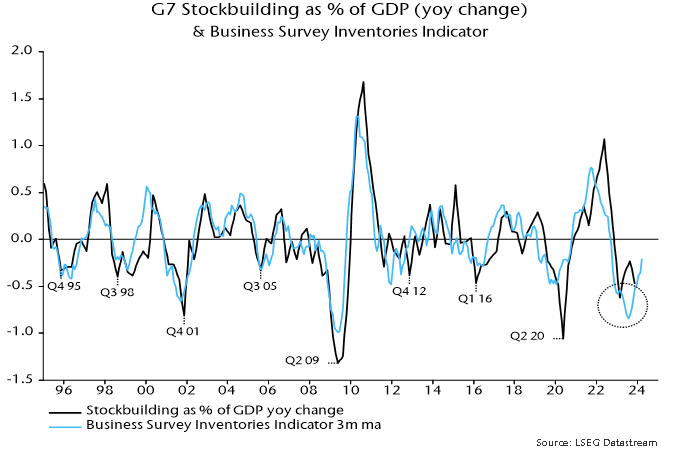
The key indicator used to monitor the cycle – the annual change in the stockbuilding share of G7 GDP – appears to have reached a major low in Q1 2023. A secondary indicator based on business surveys confirmed this trough in July – see chart 1.
Chart 1

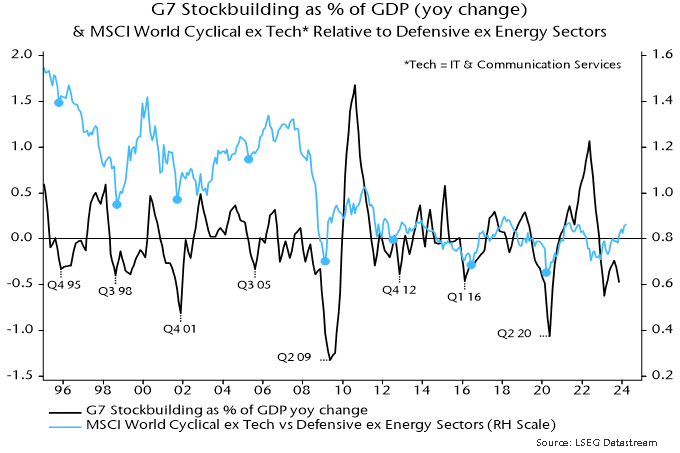
Stockbuilding cycle lows historically were usually associated with nearby major or minor lows in cyclical asset prices. Chart 2 shows the relationship with the relative performance of equity market cyclical sectors, excluding IT and communication services. A cyclical rally gathered pace from April 2023, consistent with a H1 cycle trough.
Chart 2

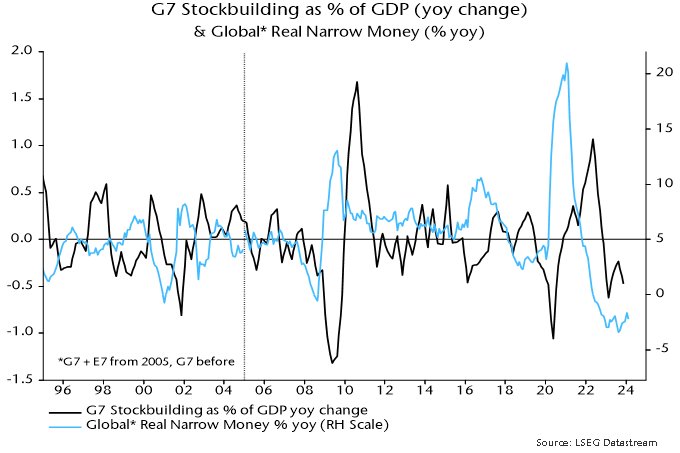
Why was a scenario anticipated in 2022 sadly underplayed in commentaries last year? The difficulty was that stockbuilding cycle lows historically were preceded by an upturn in global real narrow money momentum – chart 3. A marginal recovery in annual momentum occurred between February and June last year but a relapse to a lower low ensued. With no monetary improvement, and major central banks continuing to tighten into H2, it seemed unlikely that economic news and fund flows would support outperformance of cyclical assets.
Chart 3

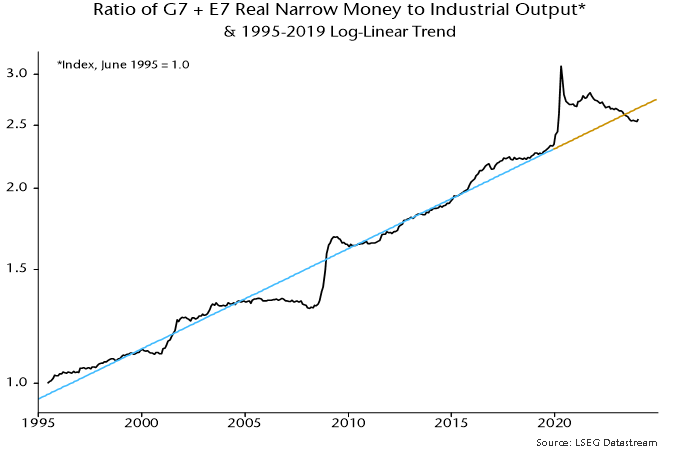
One explanation for the disconnect is that real money momentum, while a reliable indicator historically, failed to capture the availability of money to support activity and markets because of an overhang of “excess” balances created by earlier monetary strength. The ratio of the stock of global real narrow money to industrial output at end-2022 was still 4% above its steeply rising pre-pandemic trend – chart 4.
Chart 4

The strength of US equities may also have partly reflected the US Treasury’s decision, following the suspension of the debt ceiling in June, to “overfund” the federal deficit via issuance of bills, which were purchased mainly by money-creating institutions. This had the effect of more than offsetting the monetary drag from the Fed’s QT, while low coupon issuance created space in investors’ portfolios for additional purchases of credit and equities.
Support from these influences should be at or close to an end. The ratio of global real narrow money to industrial output returned to its March 2020 level in mid-2023, moving sideways since and now 4% below the pre-pandemic trend – chart 4. The Treasury’s financing plans, meanwhile, envisage a reduction in the bill float in Q2, raising the possibility of renewed monetary US weakness unless the Fed swiftly tapers QT.
Global real narrow money momentum has firmed again since Q3 2023 but remains negative, in both annual and six-month terms. A revival could, in theory, continue even if major central banks delay policy easing: rising economic confidence could be reflected in a switch out of time deposits and money funds into demand / overnight deposits, while EM money trends may improve further in response to recent policy easing. More likely, a normalisation of money growth will require a significant reversal of 2022-23 DM policy rate hikes.
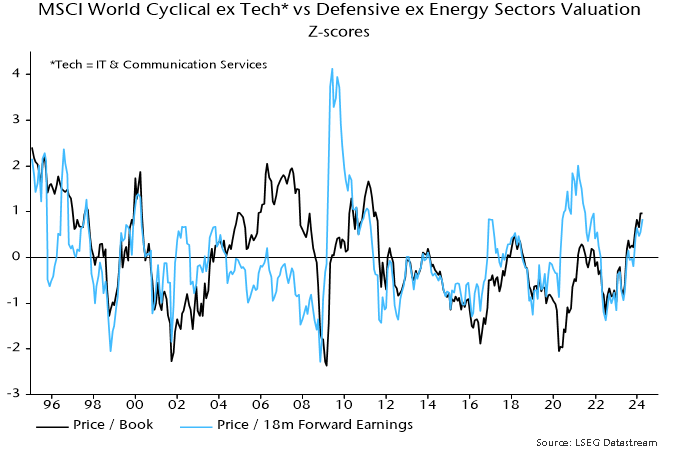
Without a further rise in real money momentum, the initial stockbuilding cycle recovery may prove disappointingly limp or even fizzle altogether, revisiting the H1 2023 low. Such a scenario would pose a major risk to some cyclical assets now apparently discounting solid / sustained economic growth, such as the DM cyclical equities sector basket – chart 5.
Chart 5

How could investors sharing the latter concern and favouring a defensive bias hedge against the possibility that a stockbuilding cycle upswing unfolds normally, implying economic acceleration into 2025? Some cyclical assets have lagged, including industrial commodity prices, the DM materials sector and EM cyclical sectors, which – unlike in DM – are at a low valuation versus defensive sectors relative to history.
Chart 6 shows six-month real narrow money momentum in major countries. The US remains above Europe but the gap has narrowed, while, as argued above, the US recovery could go into reverse into Q2. The UK, meanwhile, has crossed above the Eurozone, suggesting improving relative economic prospects following GDP underperformance in the year to Q4.
Chart 6

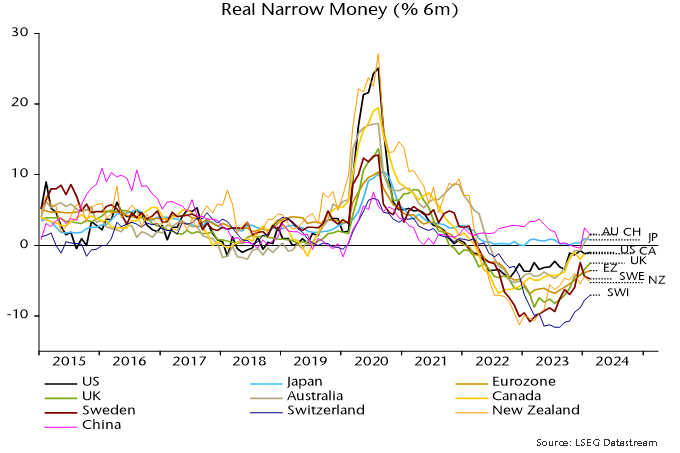
China was a significant contributor to the recent rise in global real narrow money momentum, following record PBoC lending to banks in Q4. Such lending, however, contracted in January / February and a decline in term money rates has stalled, raising concern that the recovery in money growth will falter.
Other notable features include a pick-up in Australia, continued relative weakness in Switzerland and a relapse in Sweden. The suggestion is that the Australian economy will outperform, delaying rate cuts; by contrast, the Swiss National Bank has already embarked on easing, with the Riksbank expected to follow in Q2.
G7 inflation has continued to moderate in line with a simplistic monetarist forecast based on the profile of broad money growth two years earlier. A note in November 2022 suggested that annual consumer price inflation (GDP-weighted average), then at 7.8%, would fall below 3% by December 2023. The latest reading, for February, was 2.9%.
US annual core inflation on the Fed’s favoured PCE measure was 2.8% in February or 2.2% excluding lagging rents. Market concerns about inflation remaining “stubborn” are based on a rebound in shorter-term momentum measures but this has been mainly due to an outsized January gain, possibly reflecting residual seasonality (which could also explain unexpected weakness in late 2023), i.e. these measures are likely to fall back sharply as the January effect drops out.
G7 annual broad money growth continued to decline into April 2023, suggesting that the primary inflation trend will remain down into H1 2025. The reduction to date, however, was accelerated by post-pandemic normalisation of supply chains and weakness in commodity prices – the former effect is over and commodity prices usually rise during stockbuilding cycle upswings. The baseline view here remains that inflation rates will return to target by H2 2024 with significant risk of a subsequent undershoot and no sustained rebound before H2 2025.