A further rise in China’s trade surplus over the past year has been accompanied by bumper growth of US dollar deposits in Hong Kong, suggesting that Chinese entities have been building a hedge against RMB depreciation – see chart 1.
Chart 1
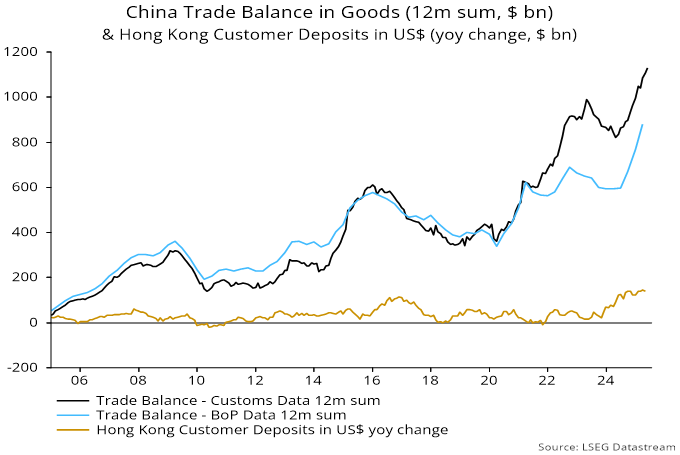
US dollar deposits grew by $139 bn or 15.6% in the year to April to stand at $975 bn, equivalent to 4.5% of US M2. They have risen much more strongly than Hong Kong dollar deposits, now representing 92% of the value of the latter, up from 79% at end-2022.
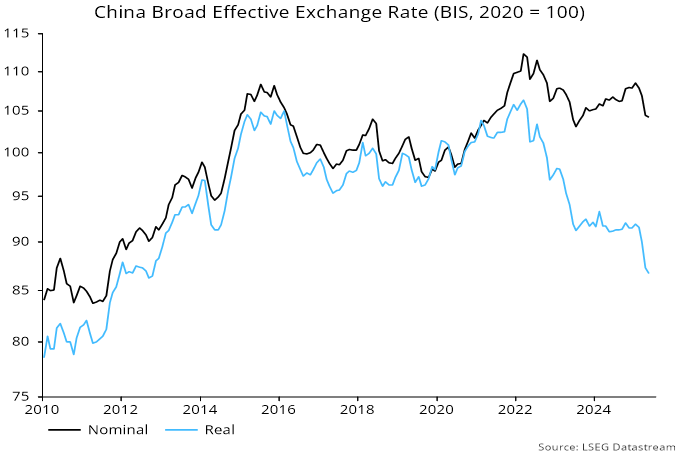
Low inflation has allowed China to gain competitiveness without nominal depreciation, with the BIS real effective rate at a 13-year low – chart 2.
Chart 2
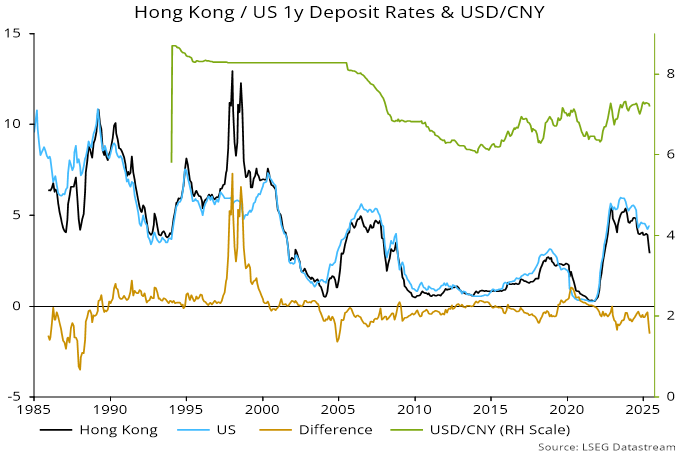
Is demand for US dollar balances starting to wane? The recent fall in Hong Kong rates is consistent with a switch into local dollars. The one-year Hong Kong / US rate differential is the most negative since 2005, before a sustained appreciation of the RMB – chart 3.
Chart 3
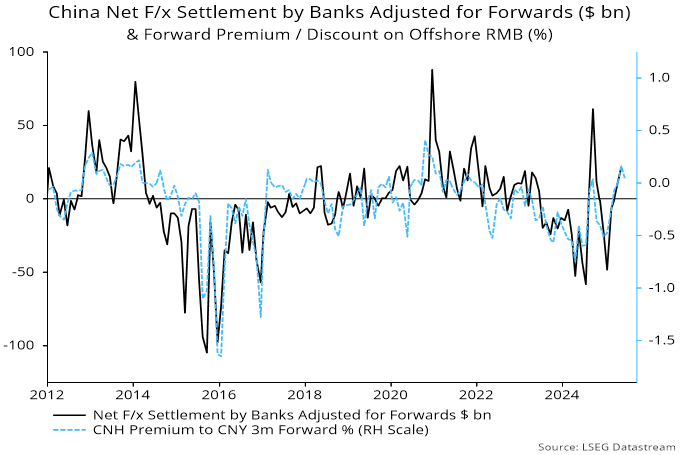
Chinese f/x settlement numbers, meanwhile, indicate that the authorities intervened to hold down the RMB for a second month in May. Upward pressure had been signalled by a forward premium on the offshore RMB, which has persisted in June – chart 4.
Chart 4
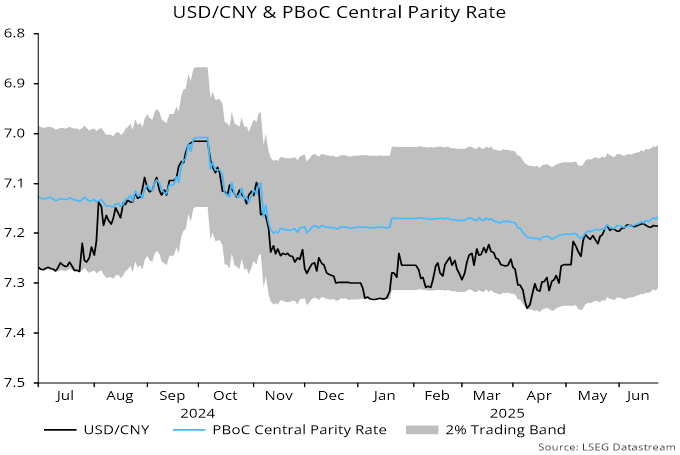
The onshore spot rate has moved from the weak end to the middle of the PBoC’s trading band, with the central parity rate edging higher – chart 5.
Chart 5
Any signal from the Chinese authorities of acquiescence to an appreciating trend could quickly become self-fulfilling by encouraging a further unwind of hedges, including via a reduced US dollar share of Hong Kong deposits.